Who Runs the Web's Address Book: Cloudflare Leads DNS at 28%, Not 40% — and the Market Is Fragmenting
Update — 2026-06-29: Refreshed against LLMSE's current index of 3.4M classified URLs (up from ~1.5M at first publication), now covering 1,664,141 domains with a detected DNS provider (up from 685,940). The headline is corrected: Cloudflare runs 28.3% of detected DNS, not the 40% reported originally — still #1 by 3.2x, but the broader index added a long tail of registrar-default, regional-hosting, and parked domains that diluted the top of the market. Concentration fell across every tier (top-2 50.6%→37.2%, top-10 72.8%→58.3%). The original's per-industry "DNS fingerprints" and provider-by-segment splits were built on a 500-domain-per-provider sample that is not reproducible against the live index, and have been dropped. The core thesis — Cloudflare dominates a DNS layer that is still more fragmented than business email — holds; the magnitude is corrected, and the market is measurably de-concentrating.
Every domain delegates its DNS to a set of nameservers — the NS records that decide who actually answers when the rest of the internet asks "where is this site?" Those records are public, and resolved at scale they give the clearest available picture of who controls the web's address book: the resolution layer that sits beneath every page load, every email, every API call.
The conventional read, repeated in our own early-2026 analysis, was that this layer had effectively been won. One company — Cloudflare — was said to run "40% of DNS," a near-monopoly built on a free tier bundled with CDN, DDoS protection, and a friendly dashboard. The number was tidy enough to become a talking point. It implied that the address book had a single editor and the contest was over.
Re-running the count against an index that has since more than doubled tells a more interesting story. Cloudflare still leads, decisively. But it leads by far less than 40%, and the gap to everyone else narrows as the measurable web broadens past its Anglophone, Cloudflare-heavy core into the European and Asia-Pacific hosting and registrar brands that the round headline never counted.
We resolved the NS records for every domain in LLMSE's index and matched the delegated nameserver against a database of 1,129 nameserver patterns, yielding 1,664,141 domains with an identified provider across 325 distinct providers. Provider detection is keyed on the bare domain, so this post reports market share by provider — it does not cross-reference DNS choice against a site's content category (see Methodology for why the old per-industry breakdown is gone).
Cloudflare runs the DNS for 28.3% of those domains — still more than three times its nearest rival and #1 by a wide margin, but a long way from the 40% we reported in February. The market is de-concentrating: the top two providers hold 37.2% (down from 50.6%), the top ten hold 58.3% (down from 72.8%), and DNS remains far more fragmented than business email, where the top two control 54.4%.
The Data
The single most important change since the original is not the ranking — Cloudflare, GoDaddy, and AWS Route 53 still hold the top three — but the shape of the curve. As the detected-DNS population grew 2.4x, every concentration measure fell.
| Snapshot | Domains with detected DNS | Providers | Cloudflare share | Top-2 share | Top-5 share | Top-10 share |
|---|---|---|---|---|---|---|
| Feb 2026 (original) | 685,940 | 316 | 40.4% | 50.6% | 65.0% | 72.8% |
| June 2026 (this update) | 1,664,141 | 325 | 28.3% | 37.2% | 48.9% | 58.3% |
The dataset is weighted toward active, content-bearing websites — domains someone cared enough to build and publish — rather than the full registered-domain universe (Verisign's Domain Name Industry Brief counted 378.5 million registrations across all TLDs at the end of Q3 2025). It is also a long-tailed distribution: 305 of the 325 providers sit outside the top 20 and split 29.9% of all DNS between them, and 125 providers serve fewer than 100 domains each. The headline belongs to Cloudflare; the bulk of the providers are regional hosts, registrars, and niche services almost no market report names.
Methodology
This post makes quantitative claims about market share, so the definitions and limits matter.
- What "market share" means here. Share is the count of domains whose delegated nameservers match a given provider, divided by the 1,664,141 domains for which we detected any recognized provider. It is share of the measurable, content-bearing web in LLMSE's index, not share of all registered domains and not weighted by traffic.
- Detection. For each domain we resolve NS records with dnspython and match nameserver hostnames against a database of 1,129 patterns mapped to known providers. We attribute a domain to the provider of its delegated, outermost authoritative nameservers. A domain that runs, say, Route 53 behind a white-labeled service is counted under the nameserver it actually delegates to.
- Cross-references are not reproducible here, by design. Provider indices (
ns-*) are keyed on the bare domain, while content-category and grade indices are keyed on the full URL. A set intersection between them returns zero, so DNS market share is reproducible from the provider cardinalities, but DNS-provider-by-industry and provider-by-grade breakdowns are not. The original post's "DNS fingerprints by industry" (e.g. "Akamai runs 46.7% of news sites") and its enterprise-vs-SMB divide came from a one-off sample of up to 500 domains per provider that cannot be reproduced read-only against the live index. We have dropped those claims rather than carry forward numbers we cannot stand behind. - The business-model grouping is an editorial classification. Where we group providers into "managed DNS," "registrar default," "web hosting," etc., that is a manual classification of each provider's primary business by name — not a Redis segment index. The cardinalities are reproducible; the labels are a judgment call, and many providers genuinely span roles (Cloudflare is managed DNS and a CDN; GoDaddy, OVH, and IONOS are registrars and hosts). Treat the segment totals as indicative.
- Why these numbers differ from the original. The detected-DNS population grew from 685,940 to 1,664,141 domains. The early sample skewed toward the visible, Anglophone, security-conscious web where Cloudflare adoption is highest; broadening coverage pulled in a large mass of registrar-default, regional-hosting, and parked domains that Cloudflare does not serve. Cloudflare's absolute footprint rose (277,244 → 471,110 domains); its share fell because the denominator grew faster. The 40%→28% move is largely a coverage and composition effect, not evidence that Cloudflare lost customers.
- Known limits and exclusions. We detect only the frontmost authoritative nameserver; secondary or hidden-primary configurations are invisible. Detection requires successful resolution, so expired or misconfigured domains drop out. NS records for blocked TLDs (
.ru,.su) are excluded by design, and Russian data is excluded from every aggregate. Counts are a live snapshot and drift as classification continues.
The Scorecard
The top of the table is stable and lopsided. Cloudflare's 471,110 domains are 3.2x GoDaddy's 147,356 and 5.5x AWS Route 53's 86,267. After that the field collapses into a dense pack of low-single-digit providers.
| Rank | Provider | Domains | Share | Primary business |
|---|---|---|---|---|
| 1 | Cloudflare | 471,110 | 28.31% | Managed DNS / CDN |
| 2 | GoDaddy | 147,356 | 8.85% | Registrar |
| 3 | AWS Route 53 | 86,267 | 5.18% | Cloud / managed DNS |
| 4 | OVH | 59,630 | 3.58% | Registrar / hosting (FR) |
| 5 | IONOS | 49,647 | 2.98% | Registrar / hosting (DE) |
| 6 | Namecheap | 35,376 | 2.13% | Registrar |
| 7 | Google Cloud DNS | 34,311 | 2.06% | Cloud / managed DNS |
| 8 | Bluehost | 29,626 | 1.78% | Web hosting |
| 9 | All-Inkl | 28,891 | 1.74% | Web hosting (DE) |
| 10 | One.com | 28,444 | 1.71% | Hosting / registrar (DK) |
| 11 | Strato | 28,351 | 1.70% | Web hosting (DE) |
| 12 | SiteGround | 25,581 | 1.54% | Web hosting |
| 13 | HostGator | 23,212 | 1.39% | Web hosting |
| 14 | DNS Parking | 22,562 | 1.36% | Domain parking |
| 15 | Wix | 18,126 | 1.09% | Website builder |
| 16 | NS1 | 17,731 | 1.07% | Managed DNS |
| 17 | Hetzner | 15,783 | 0.95% | Web hosting (DE) |
| 18 | Network Solutions | 15,207 | 0.91% | Registrar |
| 19 | Alibaba Cloud | 14,934 | 0.90% | Cloud DNS (CN) |
| 20 | DreamHost | 13,845 | 0.83% | Web hosting |
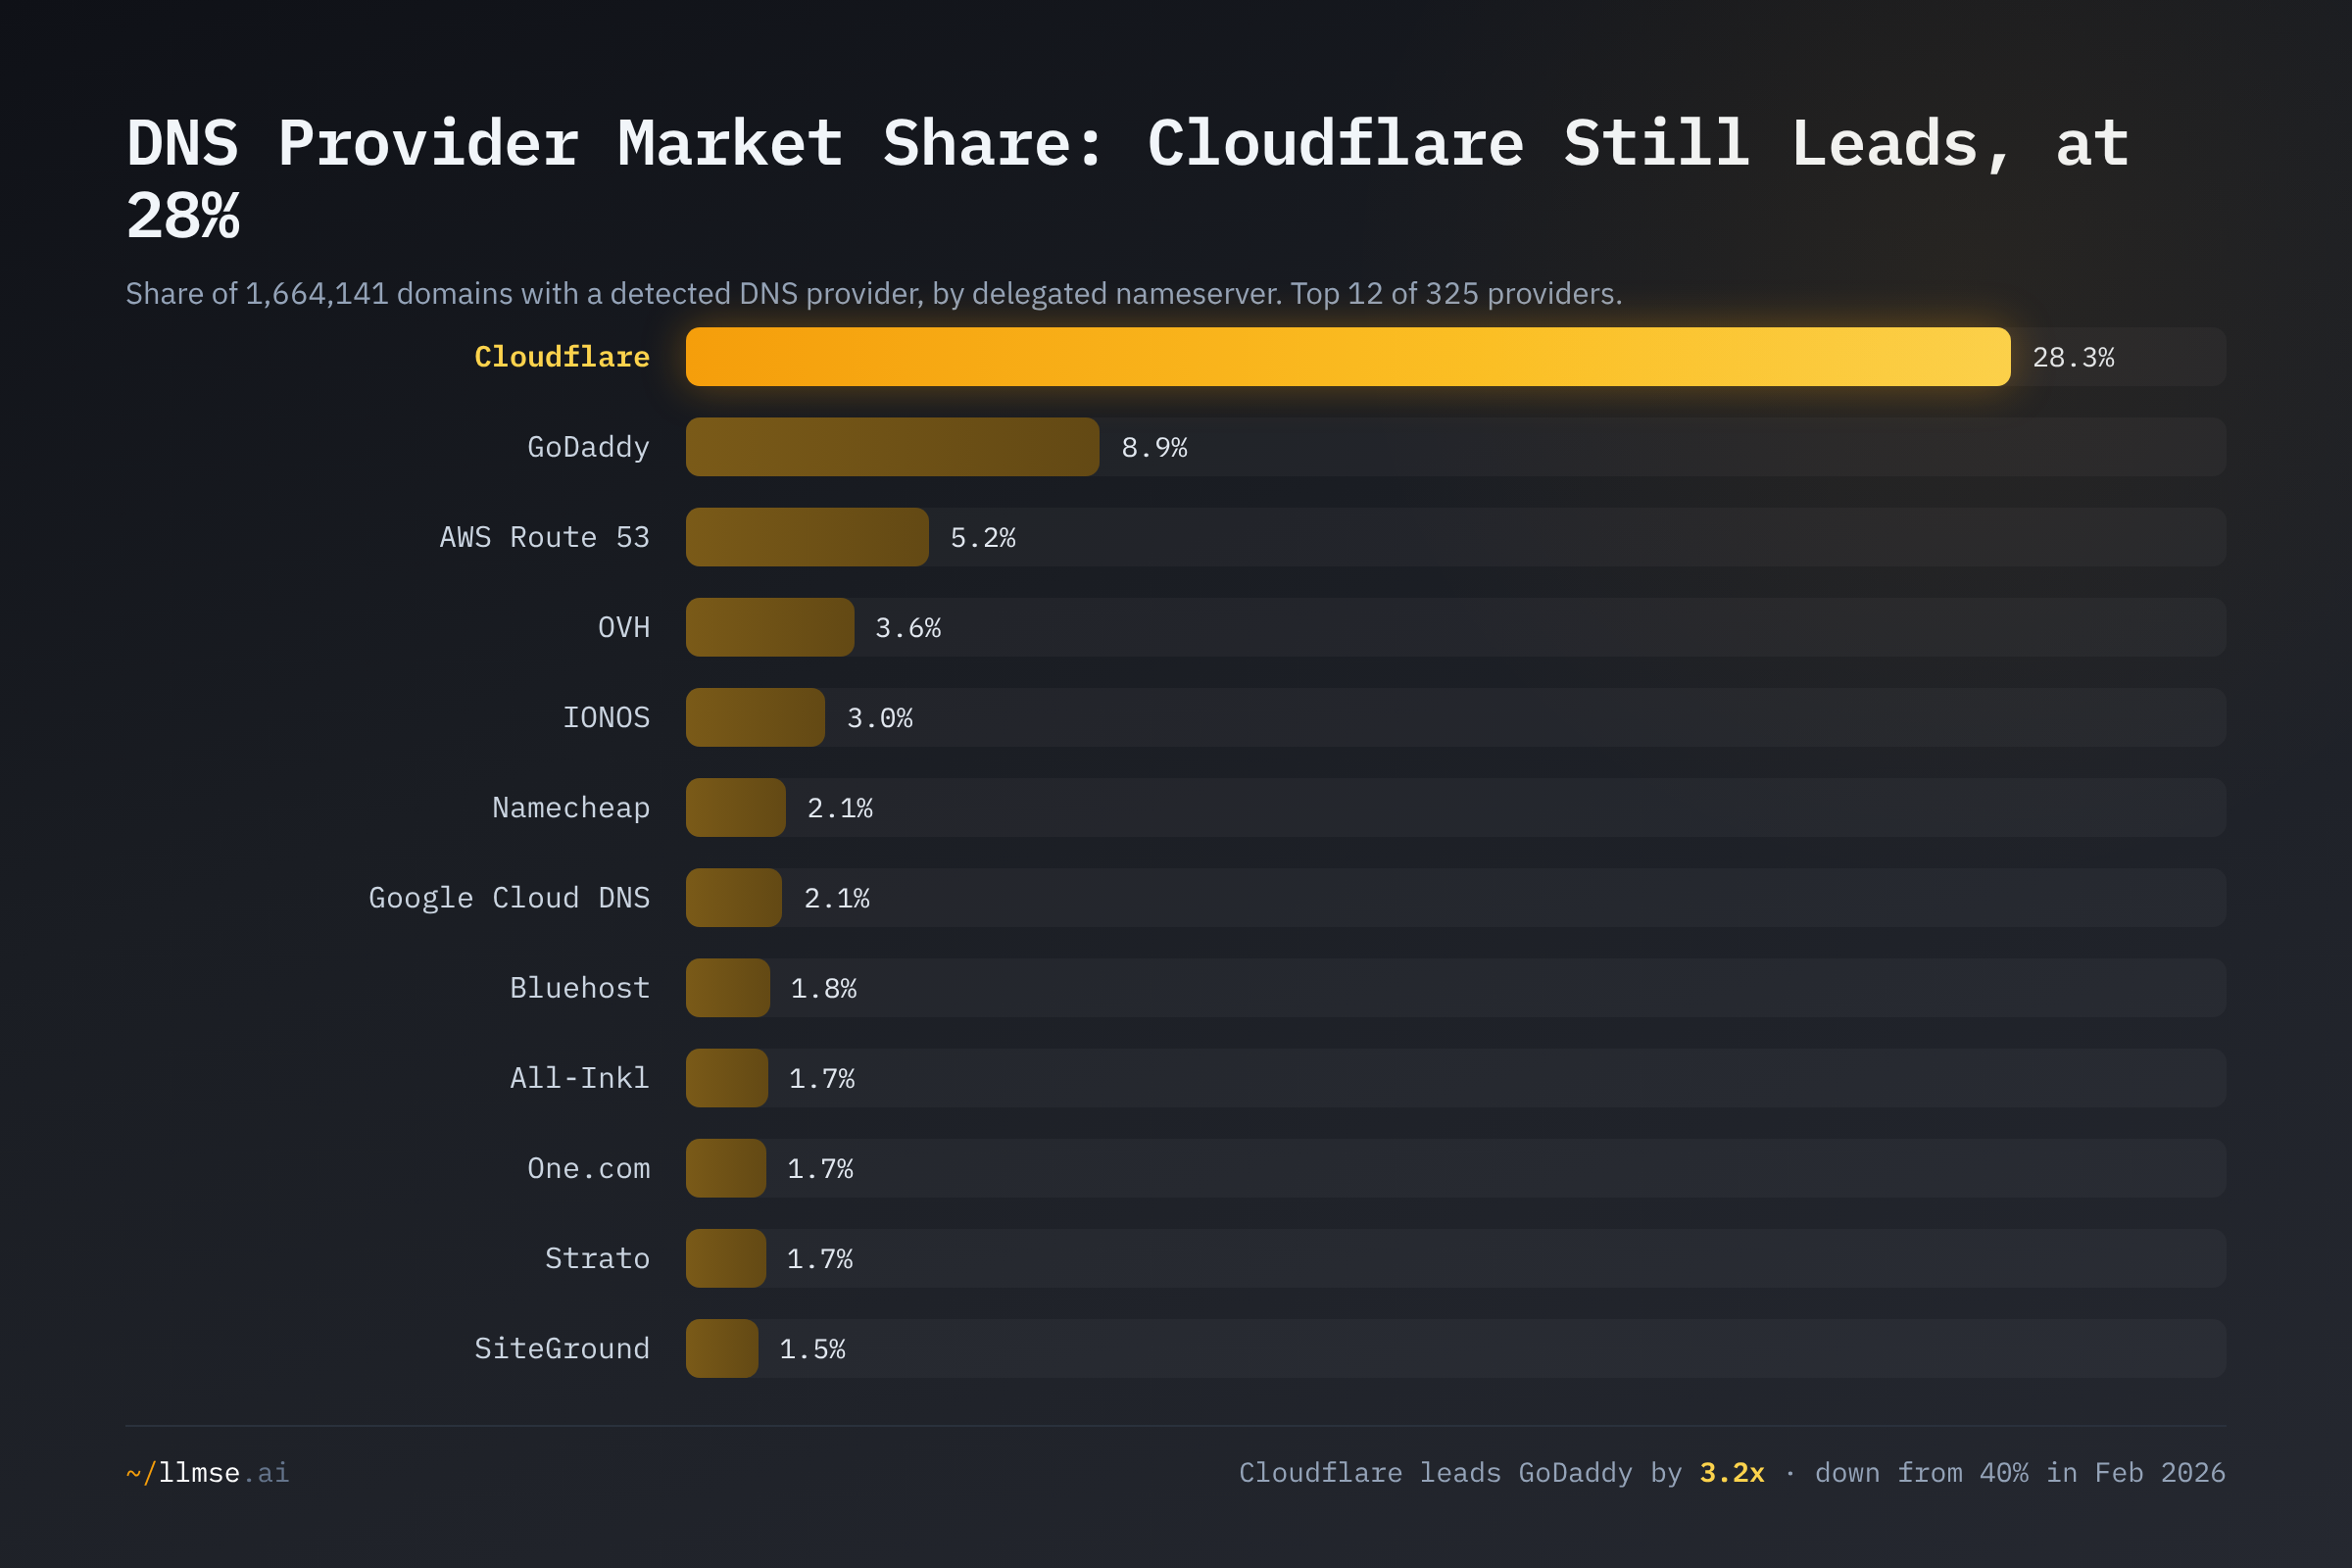
Cloudflare is the only provider above 9%, and the gap between it and GoDaddy is the defining feature of the layer. This is the genuinely durable finding: across two snapshots and a 2.4x change in sample size, no challenger has come within a factor of three. The shape is consistent with an independent industry view — W3Techs (June 29, 2026), which crawls a top-site sample rather than the broad content web, also ranks Cloudflare #1 in DNS at 17.3% and GoDaddy Group #2 at 10.0%. The two datasets disagree on the absolute number — exactly as you would expect from different sampling frames — but agree on the order and on Cloudflare's lead. The 40% figure was never wrong about who leads; it was wrong about by how much.
Cloudflare's Lead Is Real, but the 40% Was a Coverage Artifact
The drop from 40.4% to 28.3% looks like decline. It is mostly arithmetic. Cloudflare served 277,244 domains in the original 685,940-domain sample and serves 471,110 today — a 70% rise in absolute footprint, tracking the company's continued growth (W3Techs records Cloudflare DNS climbing past two million active domains on its own crawl). What changed is the denominator: the index added roughly a million domains, disproportionately the registrar-default and regional-hosting domains that never delegate to Cloudflare.
This matters because round, top-heavy market-share numbers tend to come from top-site samples, and top sites over-represent the security-conscious, performance-obsessed operators who choose Cloudflare. Widen the lens to the ordinary web — the small-business sites on a registrar's default nameservers, the European agency sites on OVH or IONOS, the parked inventory — and the picture flattens. The managed-DNS market that Cloudflare anchors is, by independent assessment, still being contested: Mordor Intelligence sizes it at USD 1.35 billion in 2025, growing to USD 3.10 billion by 2030 (18.16% CAGR), and characterizes it as "medium concentration" with no single vendor dominating overwhelmingly — a description that fits a 28% leader far better than a 40% one.
The Concentration Curve: Flatter Than Email, Built on a Long Tail
DNS is concentrated at the very top and fragmented everywhere else, and on every tier it is less concentrated than the other infrastructure layer most people delegate by default — business email.
| Tier | DNS share | Email share |
|---|---|---|
| Top 2 providers | 37.2% | 54.4% |
| Top 5 providers | 48.9% | 65.6% |
| Top 10 providers | 58.3% | 75.9% |
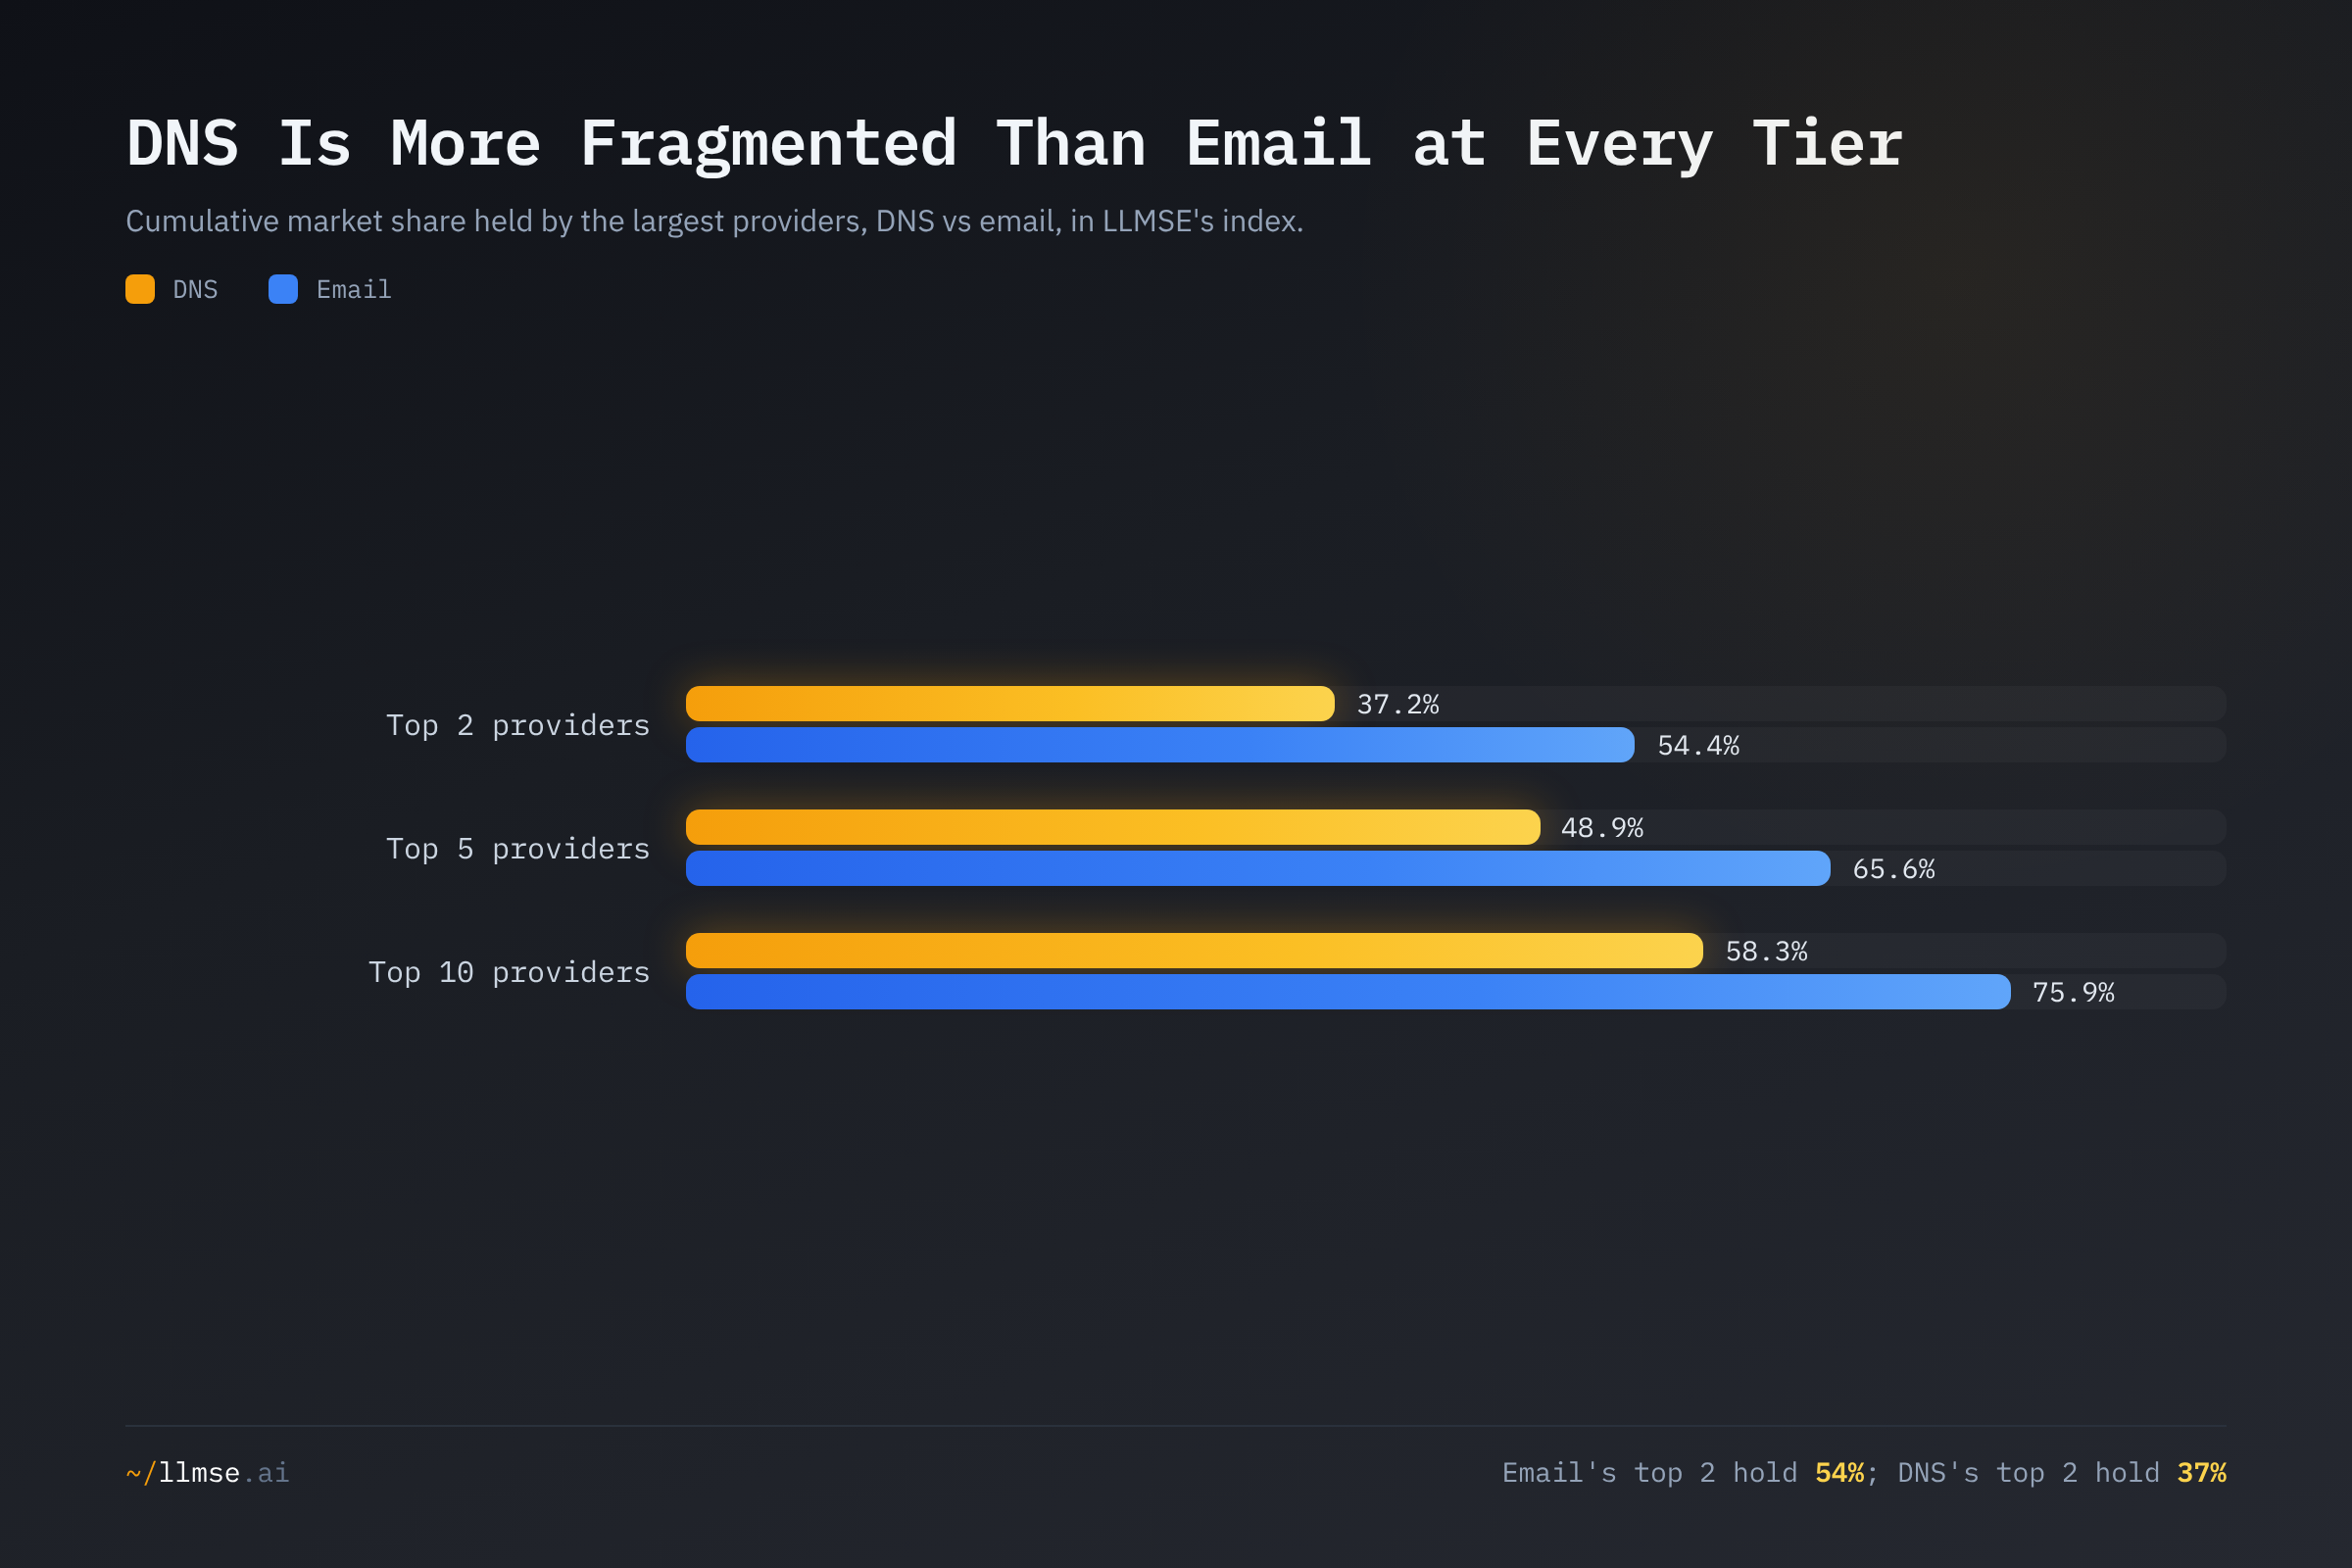
The DNS top two (Cloudflare + GoDaddy) hold 37.2%; the email top two (Google Workspace + Microsoft 365) hold 54.4% — a 17-point gap that widens further down the curve. The structural reason is switching cost. Changing nameservers is a one-time DNS record update with no data migration; moving email means cutting over live mailboxes, calendars, and authentication, a project measured in weeks. Lower friction supports more competition, and the data is consistent with that: where email collapses into a Google-Microsoft duopoly (see Mail Provider Market Share), DNS sustains a viable second tier of cloud, registrar, and regional providers. The original post drew the same contrast; with both datasets refreshed, the gap is narrower in absolute terms but the direction is unchanged — DNS remains the more open of the two layers.
The fragmentation lives in the tail. The 305 providers outside the top 20 together hold 29.9% of all DNS — more than GoDaddy and AWS Route 53 combined. This is the part of the market that top-site benchmarks erase entirely, and it is where the de-concentration since February actually came from.
Registrars, Managed DNS, and Hosts: Who Actually Holds the Nameservers
DNS providers are not interchangeable. Grouping the named top providers by their primary business model — an editorial classification, with the caveats in the Methodology — shows three distinct ways a domain ends up delegated.
| Business model | Domains | Share of detected DNS | Examples |
|---|---|---|---|
| Managed / cloud DNS | 670,347 | 40.3% | Cloudflare, Route 53, Google Cloud DNS, NS1, Azure |
| Registrar default | 395,098 | 23.7% | GoDaddy, OVH, IONOS, Namecheap, Network Solutions |
| Web hosting bundle | 278,437 | 16.7% | Bluehost, All-Inkl, Strato, SiteGround, Hetzner |
| Domain parking | 36,371 | 2.2% | DNS Parking, Above.com, ParkLogic |
| Website builder | 35,495 | 2.1% | Wix, WordPress.com, Jimdo |
Covers 85.1% of detected DNS; the remaining 14.9% is split across providers we did not classify. Boundaries blur — registrars like OVH and IONOS also host, and Cloudflare bundles CDN with DNS — so read these as indicative.
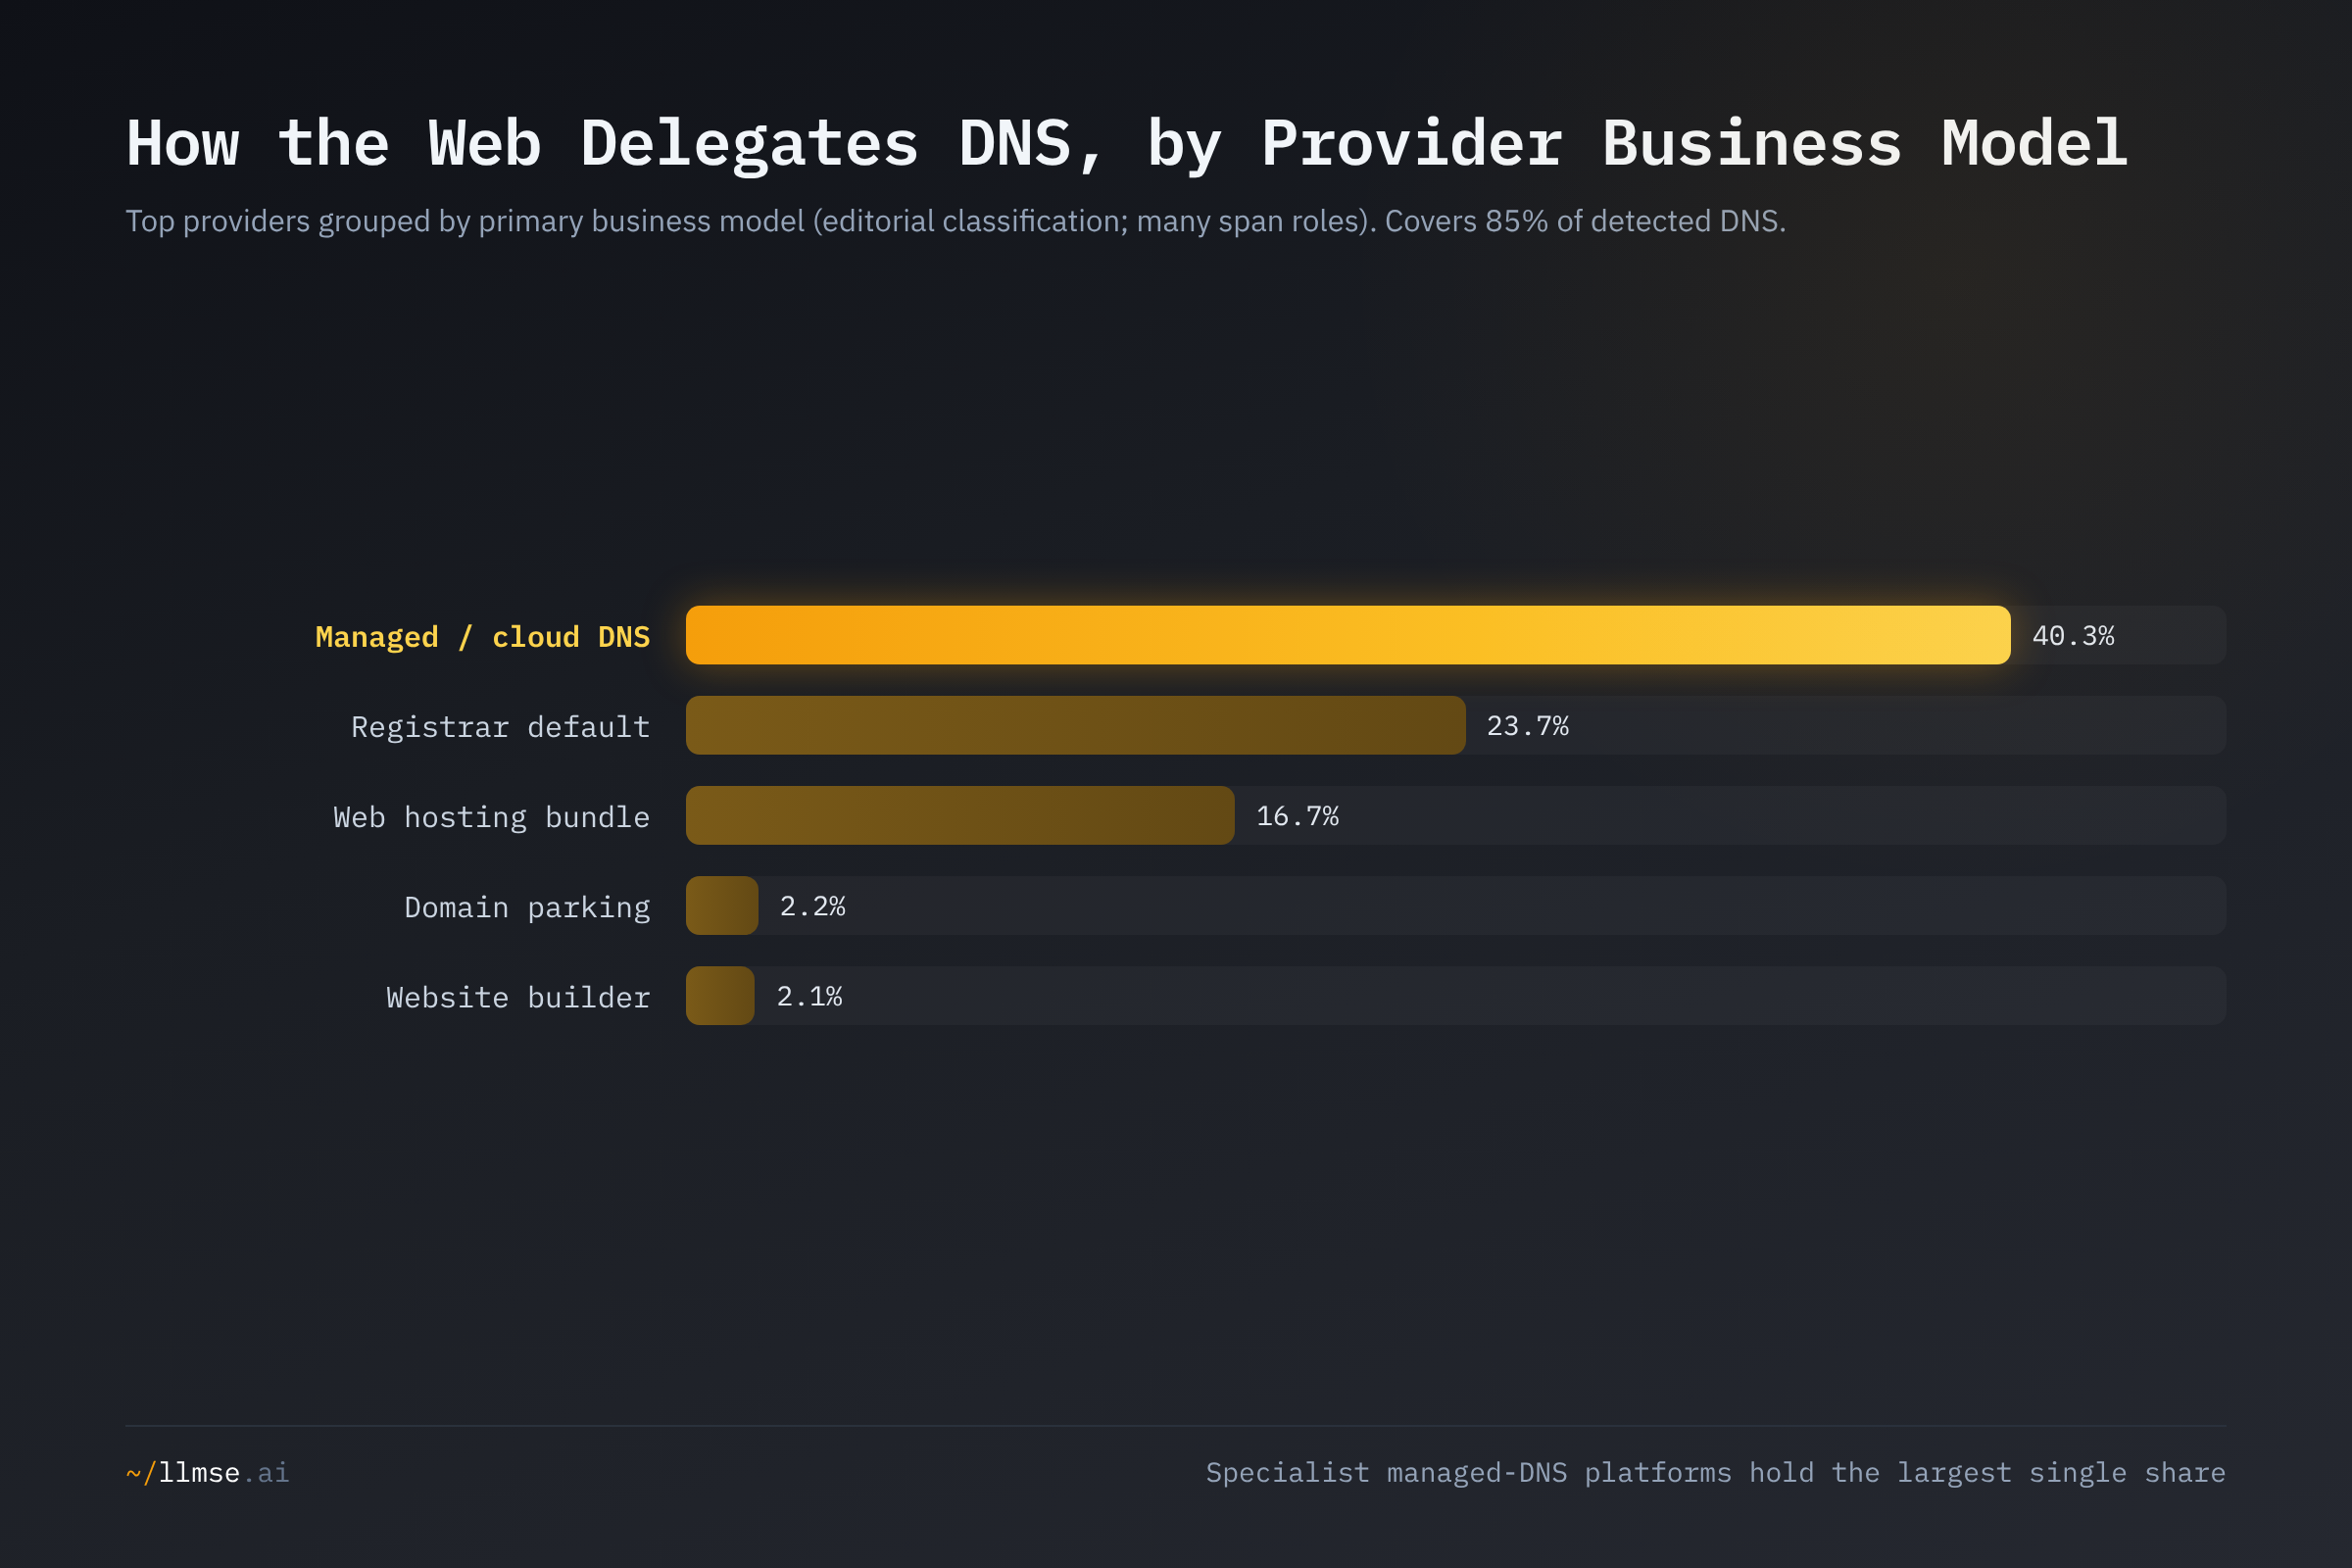
The single largest bloc is specialist managed and cloud DNS — Cloudflare plus the hyperscalers — at roughly 40% of detected DNS. That is the performance-and-security tier: providers chosen deliberately for anycast, DNSSEC, DDoS absorption, and API control. The second force on the layer is inertia: nearly a quarter of domains simply run whatever nameservers their registrar pre-configured. GoDaddy is #2 in DNS for exactly this reason — not because it is a managed-DNS specialist, but because it is the world's largest domain registrar, controlling 91 million-plus domains, about 10.8% of all registrations, most of which never have their nameservers changed. Registrar-default DNS frequently lags dedicated providers on DNSSEC support and resilience features, which makes that 23.7% a standing performance and security gap rather than an active choice.
The Long Tail Is European and Asia-Pacific
The clearest signal in the refreshed data is geographic. The providers that climbed as coverage broadened are overwhelmingly regional hosts and registrars — the names that a US-centric, top-site market report never surfaces.
| Provider | Region | Domains |
|---|---|---|
| OVH | France | 59,630 |
| IONOS | Germany | 49,647 |
| All-Inkl | Germany | 28,891 |
| One.com | Denmark | 28,444 |
| Strato | Germany | 28,351 |
| Hetzner | Germany | 15,783 |
| Alibaba Cloud | China | 14,934 |
| Infomaniak | Switzerland | 13,567 |
| TransIP | Netherlands | 13,527 |
| X-Server | Japan | 11,194 |
| Hostpoint | Switzerland | 10,686 |
| WebSupport | Slovakia | 9,062 |
A sample of named European hosting and registrar brands accounts for roughly 332,000 domains — about 19.9% of all detected DNS, comfortably more than GoDaddy. OVH (#4) and IONOS (#5) now outrank Namecheap and Google Cloud DNS; in the original ranking they sat at #6 and #9. Germany alone fields four providers in the top 20 (IONOS, All-Inkl, Strato, Hetzner). A separate Asia-Pacific cluster — Alibaba Cloud, X-Server, DNS.ne.jp, Lolipop, Tencent Cloud, GMO — adds another ~46,000 domains (2.8%). These providers are nearly invisible in Western market reports yet collectively rival the global names. The de-concentration since February is, in large part, this tail becoming visible: the same reason the top-line shares fell is the reason the regional map filled in.
What's at Stake
- A single provider answers DNS for 471,110 domains — Cloudflare's 28.3% is far below the 40% scare number, but it is still the largest single point of failure on the resolution layer. When an authoritative DNS provider fails, affected domains don't load slowly; they vanish from the internet. The systemic-risk view — outage history, cross-layer overlap, and the HHI concentration math across web/DNS/email — is covered in the Infrastructure Concentration Index; this post is the provider-level map beneath it.
- The "registrar default" is the second-biggest force on the layer — 23.7% of detected DNS is whatever nameserver a registrar pre-set, with GoDaddy alone behind 8.9%. That is a large population running DNS they never chose, often without DNSSEC or anycast resilience, and unlikely to migrate until something breaks.
- The measurable web is more regional than the headline implied — 305 providers outside the top 20 hold 29.9% of DNS, and the fastest-rising names are European and Asia-Pacific hosts. Market analyses that sample only top sites overstate the dominance of US-centric providers and understate this tail.
- Managed DNS is a growth market, not a settled one — the segment is forecast to more than double from USD 1.35B (2025) to USD 3.10B (2030) at 18.16% CAGR and is rated "medium concentration" by Mordor Intelligence. A 28% leader in an expanding, medium-concentration market is a contestable position, not a lock.
What Would Help
- Domain owners: delegate DNS deliberately, not by default. Nearly a quarter of the web runs on a registrar's pre-set nameservers. Check who actually answers for your domain — its detail page on llmse.ai/classify or the DNS provider browser will show you — and decide whether a dedicated managed-DNS provider with DNSSEC and anycast routing is worth the one-time record change.
- Operations and SRE teams: avoid single-vendor lock-in across resolution and serving. The failure risk compounds when the same vendor holds both your DNS and your CDN or web serving; the Infrastructure Concentration Index quantifies how many domains carry that double dependency. A secondary DNS provider is cheap insurance against a provider-wide outage taking your domain offline entirely.
- Regulators and policymakers: measure the tail, not just the headline. Concentration figures drawn from top-site samples overstate single-vendor dominance; the broad population shows a flatter curve and a large regional tail. As frameworks treating DNS as critical infrastructure mature, base resilience requirements on the layer's actual structure rather than on a round number.
- Researchers and journalists: retire the "40% of DNS" figure. Our own February number was a coverage artifact of a narrower sample. The reproducible figure on a broad index is 28.3%; triangulate it against W3Techs (17.3% on its top-site frame) and a managed-DNS market report before quoting any single share, and state the sampling frame.
- Managed-DNS and CDN vendors: the contested ground is regional. Cloudflare's lead rests on the Anglophone, security-conscious core; the fastest-growing slice of the measurable web delegates to European and Asia-Pacific hosts and registrars. Growth in the segment is more likely to come from that tail than from the saturated top.
Explore the Data
LLMSE's DNS provider browser lets you explore all 325 detected providers, view domain counts, and drill into any provider to see which domains delegate to it. You can also use ns: filters in advanced search to find domains by DNS provider, or check any single domain's full nameserver delegation on its detail page.
This analysis was conducted using LLMSE, which has classified over 3.4 million websites across SEO, EEAT, AEO, WCAG accessibility, readability, GARM brand safety, and privacy dimensions. DNS figures reflect 1,664,141 domains with a detected DNS provider in the index as of June 2026. To analyze your own site, visit llmse.ai/classify.