The Infrastructure Concentration Index: Only the Server Layer Is Concentrated — DNS Has De-Concentrated and Email Is Merely Moderate
Update — 2026-06-29: Refreshed against LLMSE's current index of 3.4M classified URLs (up from ~1.4M at first publication), with provider detection now covering 3.17M web-server headers, 1.66M nameserver records, and 1.05M mail records — roughly 2.4–3.5x the original samples. The larger denominators overturn the original's central claim that "two of three layers are highly concentrated": DNS concentration has fallen from HHI 2,578 to 947 (now unconcentrated), email from 2,541 to 1,549 (now only moderate), and Apache — not Cloudflare — now leads the web-server layer. Only the web-server layer remains concentrated (HHI 2,013). The original's unreproducible cross-layer overlap (the "202,884 Cloudflare web+DNS" figure) and its per-industry DNS/email fingerprints have been dropped because LLMSE's nameserver and mail indices are keyed by bare domain, not by URL, so those intersections cannot be reproduced read-only. Corrected thesis: the web's core infrastructure is less concentrated than the original argued — only one of three layers clears the antitrust line, and no single vendor reaches the 30% structural-presumption threshold.
On November 18, 2025, a bad database-permissions change at Cloudflare doubled the size of an internal Bot Management file, crashed proxies worldwide, and took X, ChatGPT, Spotify, and thousands of other services dark for five hours and 38 minutes. A month earlier, a latent race condition in DynamoDB's DNS automation had emptied a single Route 53 record and cascaded through AWS's US-EAST-1 region, disrupting more than 1,000 services for the better part of a day. Two single-operator failures, two global blackouts, weeks apart. The lesson everyone drew was the obvious one: the internet runs on a handful of companies, and that concentration is getting dangerous.
The first version of this index, published in February 2026, reached for that same conclusion with numbers. It reported that two of three infrastructure layers — DNS (HHI 2,578) and email (HHI 2,541) — were "highly concentrated" under U.S. antitrust standards, with the web-server layer "approaching" the same threshold. The framing was that the web is more consolidated than the bar regulators use to block mergers.
That conclusion does not survive a larger dataset. When the original ran, LLMSE had detected web servers on 1.22M domains, DNS on 696K, and email on 469K — a sample skewed toward the most visible, most-crawled sites, which are disproportionately fronted by Cloudflare and hosted by Google and Microsoft. The index has since grown to 3.4M classified URLs, with provider detection now spanning 3.17M server headers, 1.66M nameserver records, and 1.05M mail records. As coverage broadened into the long tail of independently hosted sites, every concentration number fell.
We recomputed the Herfindahl-Hirschman Index — the measure the DOJ and FTC use to judge market concentration — for all three layers against the current data. HHI is the sum of squared provider market shares; we report it over the top 10 providers in each layer (including the full long tail changes nothing, as we show below), and benchmark each figure against the DOJ/FTC concentration thresholds.
Only the web-server layer is concentrated today (HHI 2,013), and that is largely a software artifact — Apache and nginx, the two leaders, are open-source software running across thousands of independent hosts, not single vendors. The two layers that map to actual companies are not concentrated at all: DNS sits at HHI 947 (unconcentrated) and email at 1,549 (moderately concentrated). No single provider crosses the 30% single-firm threshold the DOJ treats as a structural presumption of harm. The concentration the outages exposed is real, but it is operational, not market-structural — and the distinction matters.
The Data
Every website depends on at least three infrastructure services that can each be a single point of failure: a web server to deliver pages, a DNS provider to resolve the domain name, and a mail provider to route email. LLMSE detects each independently during classification, so we can measure how concentrated each layer is across millions of sites.
| Layer | Detection method | Domains with detection | Distinct providers | Top provider | Top share |
|---|---|---|---|---|---|
| Web servers | HTTP Server header |
3,171,383 | 3,593 | Apache | 29.2% |
| DNS | NS records | 1,664,141 | 325 | Cloudflare | 28.3% |
| MX records | 1,051,461 | 158 | Google Workspace | 28.4% |
The three layers have very different coverage: a Server header is returned by nearly every site that answers an HTTP request, so the web-server layer is the deepest at 3.17M domains. DNS and email require successful resolution of NS and MX records, so their populations are smaller. The "distinct providers" count for web servers (3,593) is inflated by a long, noisy tail of obscure and self-identified server strings; the analysis below uses the identifiable top providers. No single provider reaches 30% in any layer — the closest are Apache's 29.2% of server headers, Cloudflare's 28.3% of DNS, and Google Workspace's 28.4% of mail.
Methodology
This post makes quantitative concentration claims, so the definitions and limits matter.
- The concentration measure. The Herfindahl-Hirschman Index (HHI) is the sum of the squared percentage market shares of the firms in a market; it ranges from near 0 (perfect competition) to 10,000 (monopoly). We compute each provider's share as its detected-domain count divided by the layer's total detections, then sum the squares of the top 10 shares. Including the entire long tail moves the figures negligibly (DNS rises from 947 to 972, web servers from 2,013 to 2,016, email from 1,549 to 1,565) and changes no classification.
- Concentration bands. Under the DOJ/FTC framework, an HHI below 1,500 is "unconcentrated," 1,500–2,500 is "moderately concentrated," and above 2,500 is "highly concentrated." The 2023 Merger Guidelines lowered the trigger for a "highly concentrated" market to 1,800 and added a structural presumption when any single firm exceeds 30% market share. We report against both regimes.
- Provider detection. Web servers are read from the HTTP
Serverresponse header; DNS providers by resolving NS records and matching nameserver hostnames against a pattern library covering 240+ providers; mail providers by resolving MX records against patterns covering 180+ providers. - No cross-layer intersections. LLMSE's
ns-*andmail-*indices are keyed by bare domain, while server and category indices are keyed by URL. A RedisZINTERCARDbetween a domain-keyed and a URL-keyed set returns a meaningless count, so cross-layer overlap (the original's "202,884 Cloudflare web+DNS" figure) and per-industry DNS/email breakdowns cannot be reproduced read-only and have been dropped rather than carried forward. Provider market shares within a single layer — which need only cardinalities — are fully reproducible. - Known limits. The
Serverheader captures the frontmost server in the response chain: a site behind Cloudflare's CDN reports "Cloudflare" even when its origin runs Apache or nginx, so Cloudflare's web-server figure mixes true single-vendor hosting with reverse-proxy fronting. DNS and email shares only cover domains that resolved successfully at crawl time. Counts are a live snapshot and drift as classification continues. Russian-language sites are excluded from all aggregates. - Why these numbers differ from the original. The single driver is sample growth. The original's per-layer samples (1.22M / 696K / 469K) were dominated by high-visibility sites, which over-represent Cloudflare (a reverse proxy favored by large sites), Google Workspace, and Microsoft 365. The current samples (3.17M / 1.66M / 1.05M) reach far into the long tail of independently hosted small sites, where Apache, nginx, regional registrars, and hosting companies dominate. Every top provider grew in absolute terms, but the tail grew faster, so concentration fell.
The Scorecard
Plotting HHI by layer against the DOJ thresholds produces a clear, three-tier picture rather than the uniform "everything is concentrated" story the original told.
| Layer | HHI | Top provider (share) | DOJ band (≥2,500 = high) | Above 2023 line (1,800)? |
|---|---|---|---|---|
| Web servers | 2,013 | Apache (29.2%) | Moderately concentrated | Yes |
| 1,549 | Google Workspace (28.4%) | Moderately concentrated | No | |
| DNS | 947 | Cloudflare (28.3%) | Unconcentrated | No |
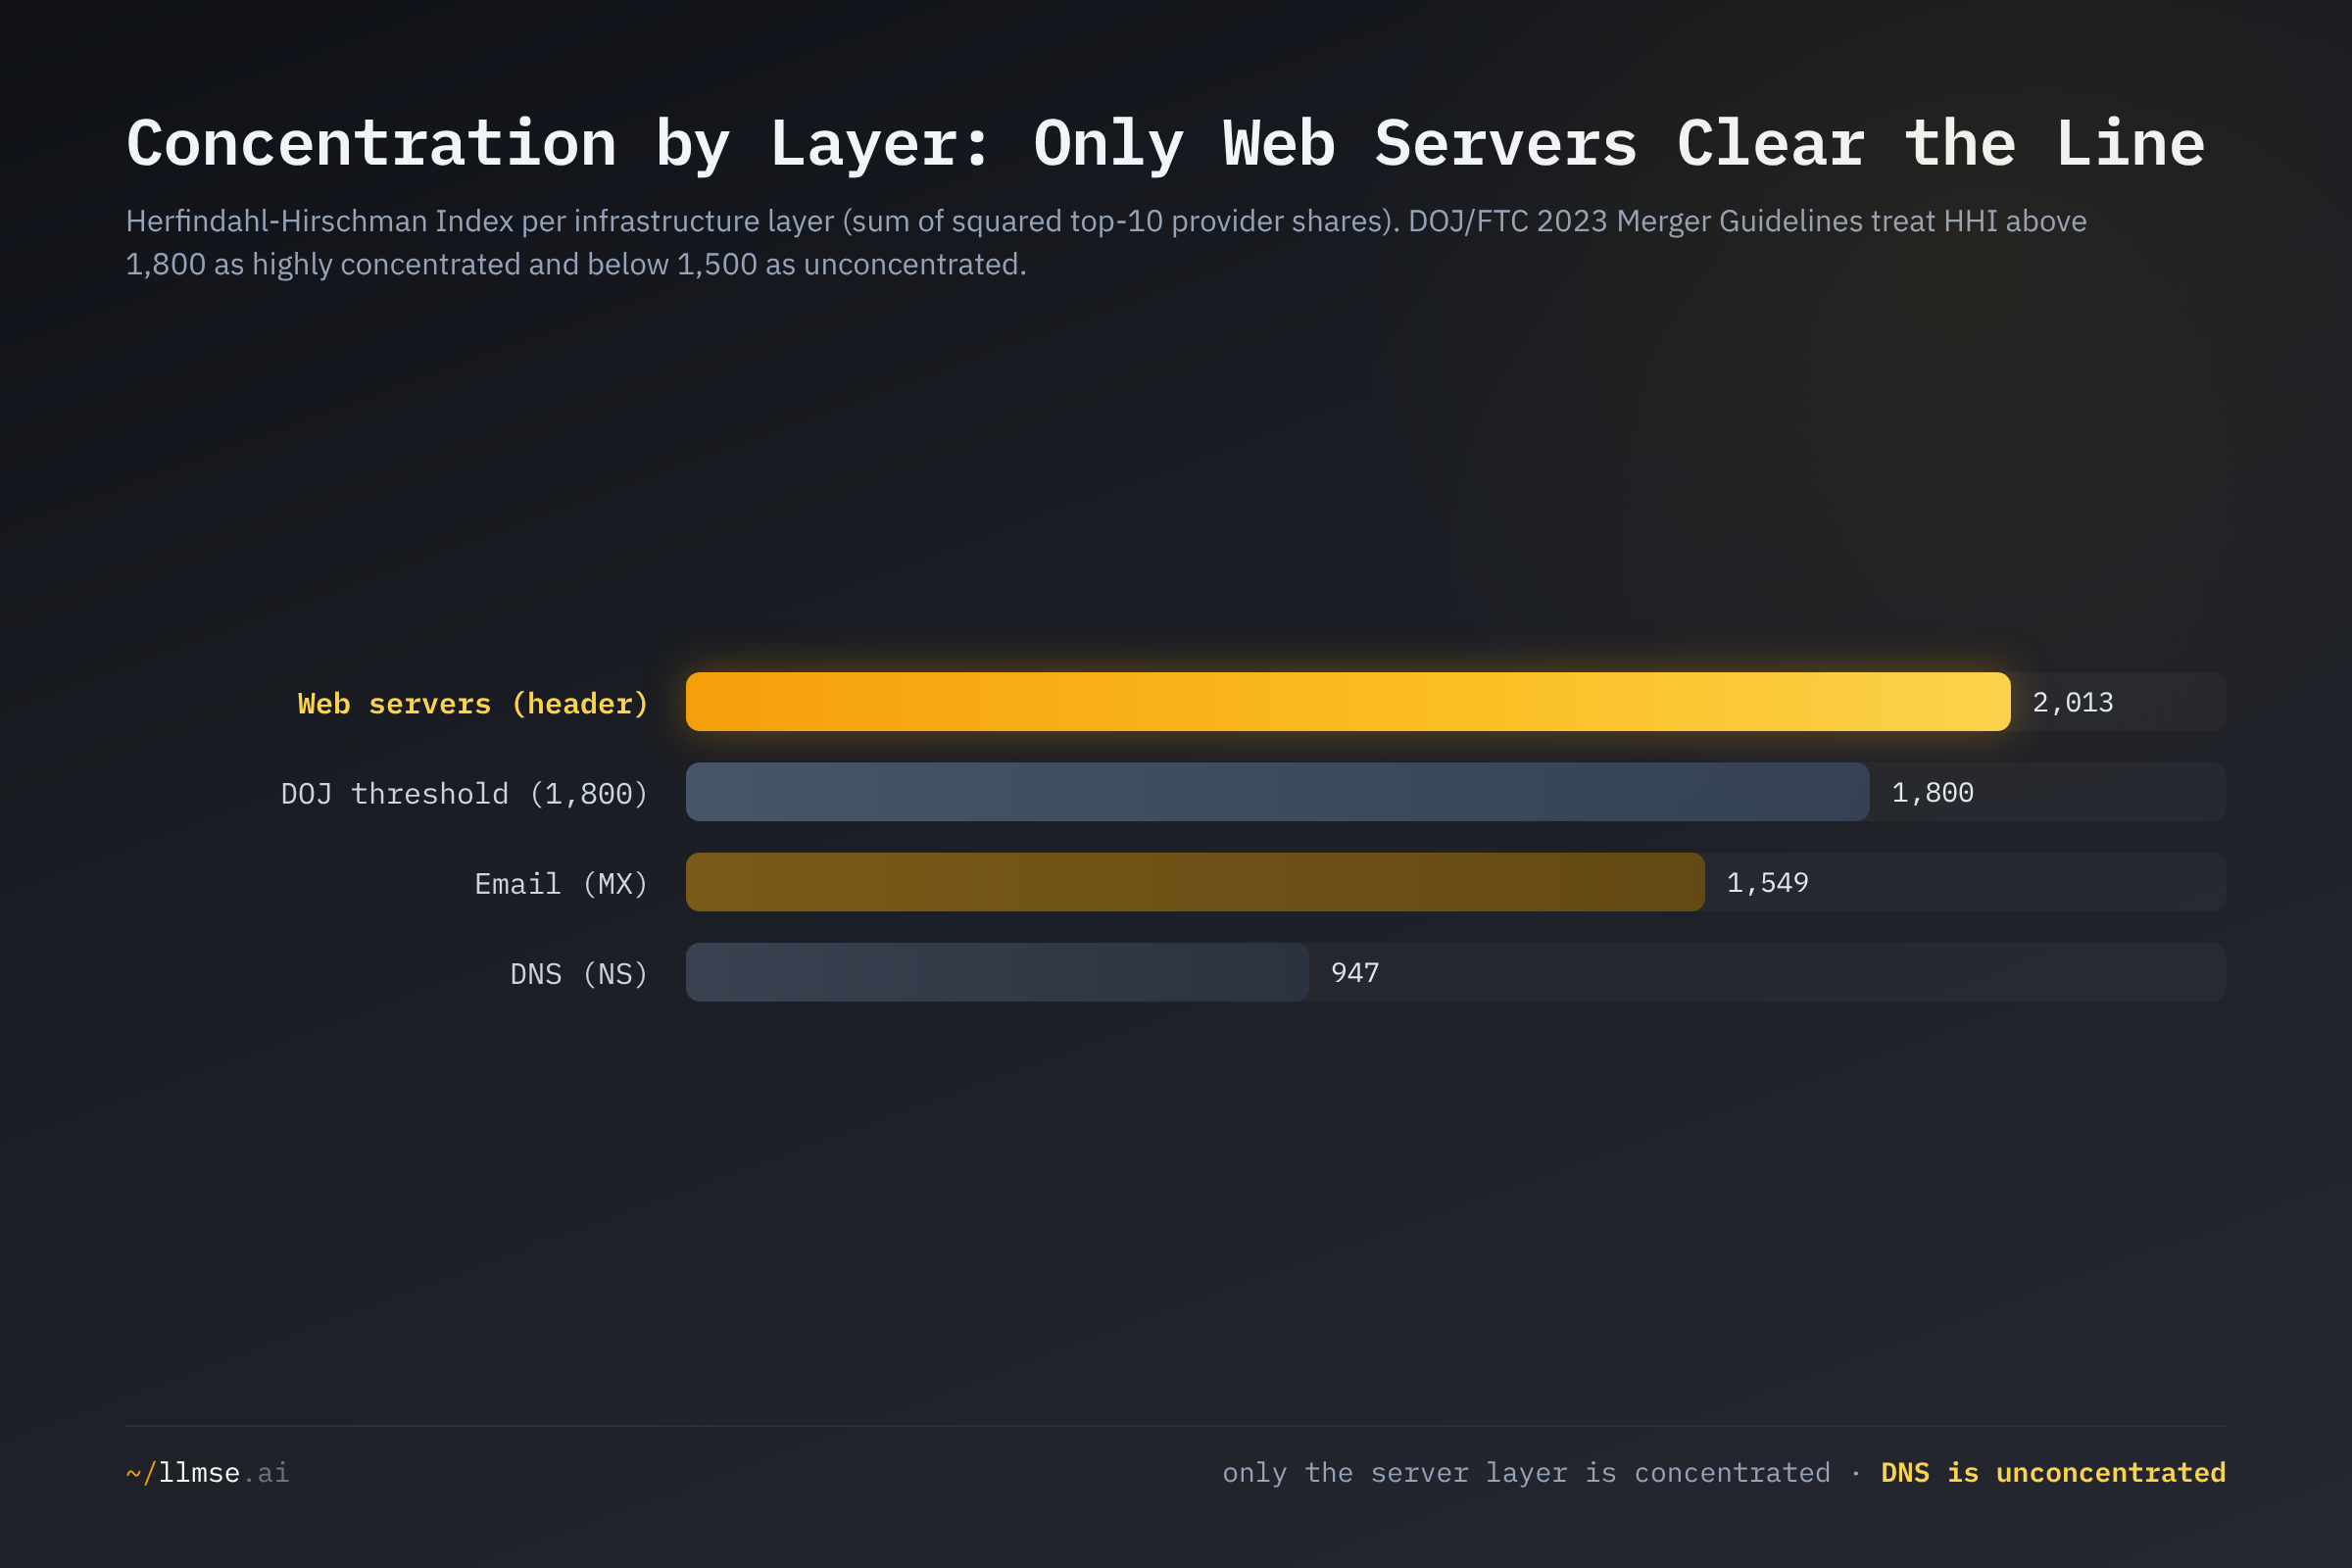
Only the web-server layer is concentrated, and even it sits in the "moderately concentrated" band under the long-standing 2,500 standard — it clears the line only against the stricter 1,800 trigger the agencies adopted in 2023. Email is in the same moderate band but lower, and DNS is outright unconcentrated. The original's headline — that two of three layers were "highly concentrated" — was an artifact of a small, visibility-biased sample, not a feature of the web's infrastructure. The deeper point, developed in the DNS section, is that the one layer above the line owes its position to open-source software popularity, not to any single company's market power.
Web Servers: Concentrated as Software, Not as Vendors
The web-server layer is the only one that clears the concentration line — and the original's leaderboard has been overturned at the top. Cloudflare led with 31.5% when this index first ran; today Apache leads at 29.2%, nginx is second at 26.3%, and Cloudflare has dropped to third at 19.6%.
| Server | Domains | Share |
|---|---|---|
| Apache | 926,068 | 29.2% |
| nginx | 833,854 | 26.3% |
| Cloudflare | 621,775 | 19.6% |
| LiteSpeed | 259,890 | 8.2% |
| GitHub | 88,651 | 2.8% |
| OpenResty | 69,736 | 2.2% |
| IIS | 54,036 | 1.7% |
| OVHcloud | 28,590 | 0.9% |
| Amazon S3 | 27,727 | 0.9% |
| Squarespace | 26,146 | 0.8% |
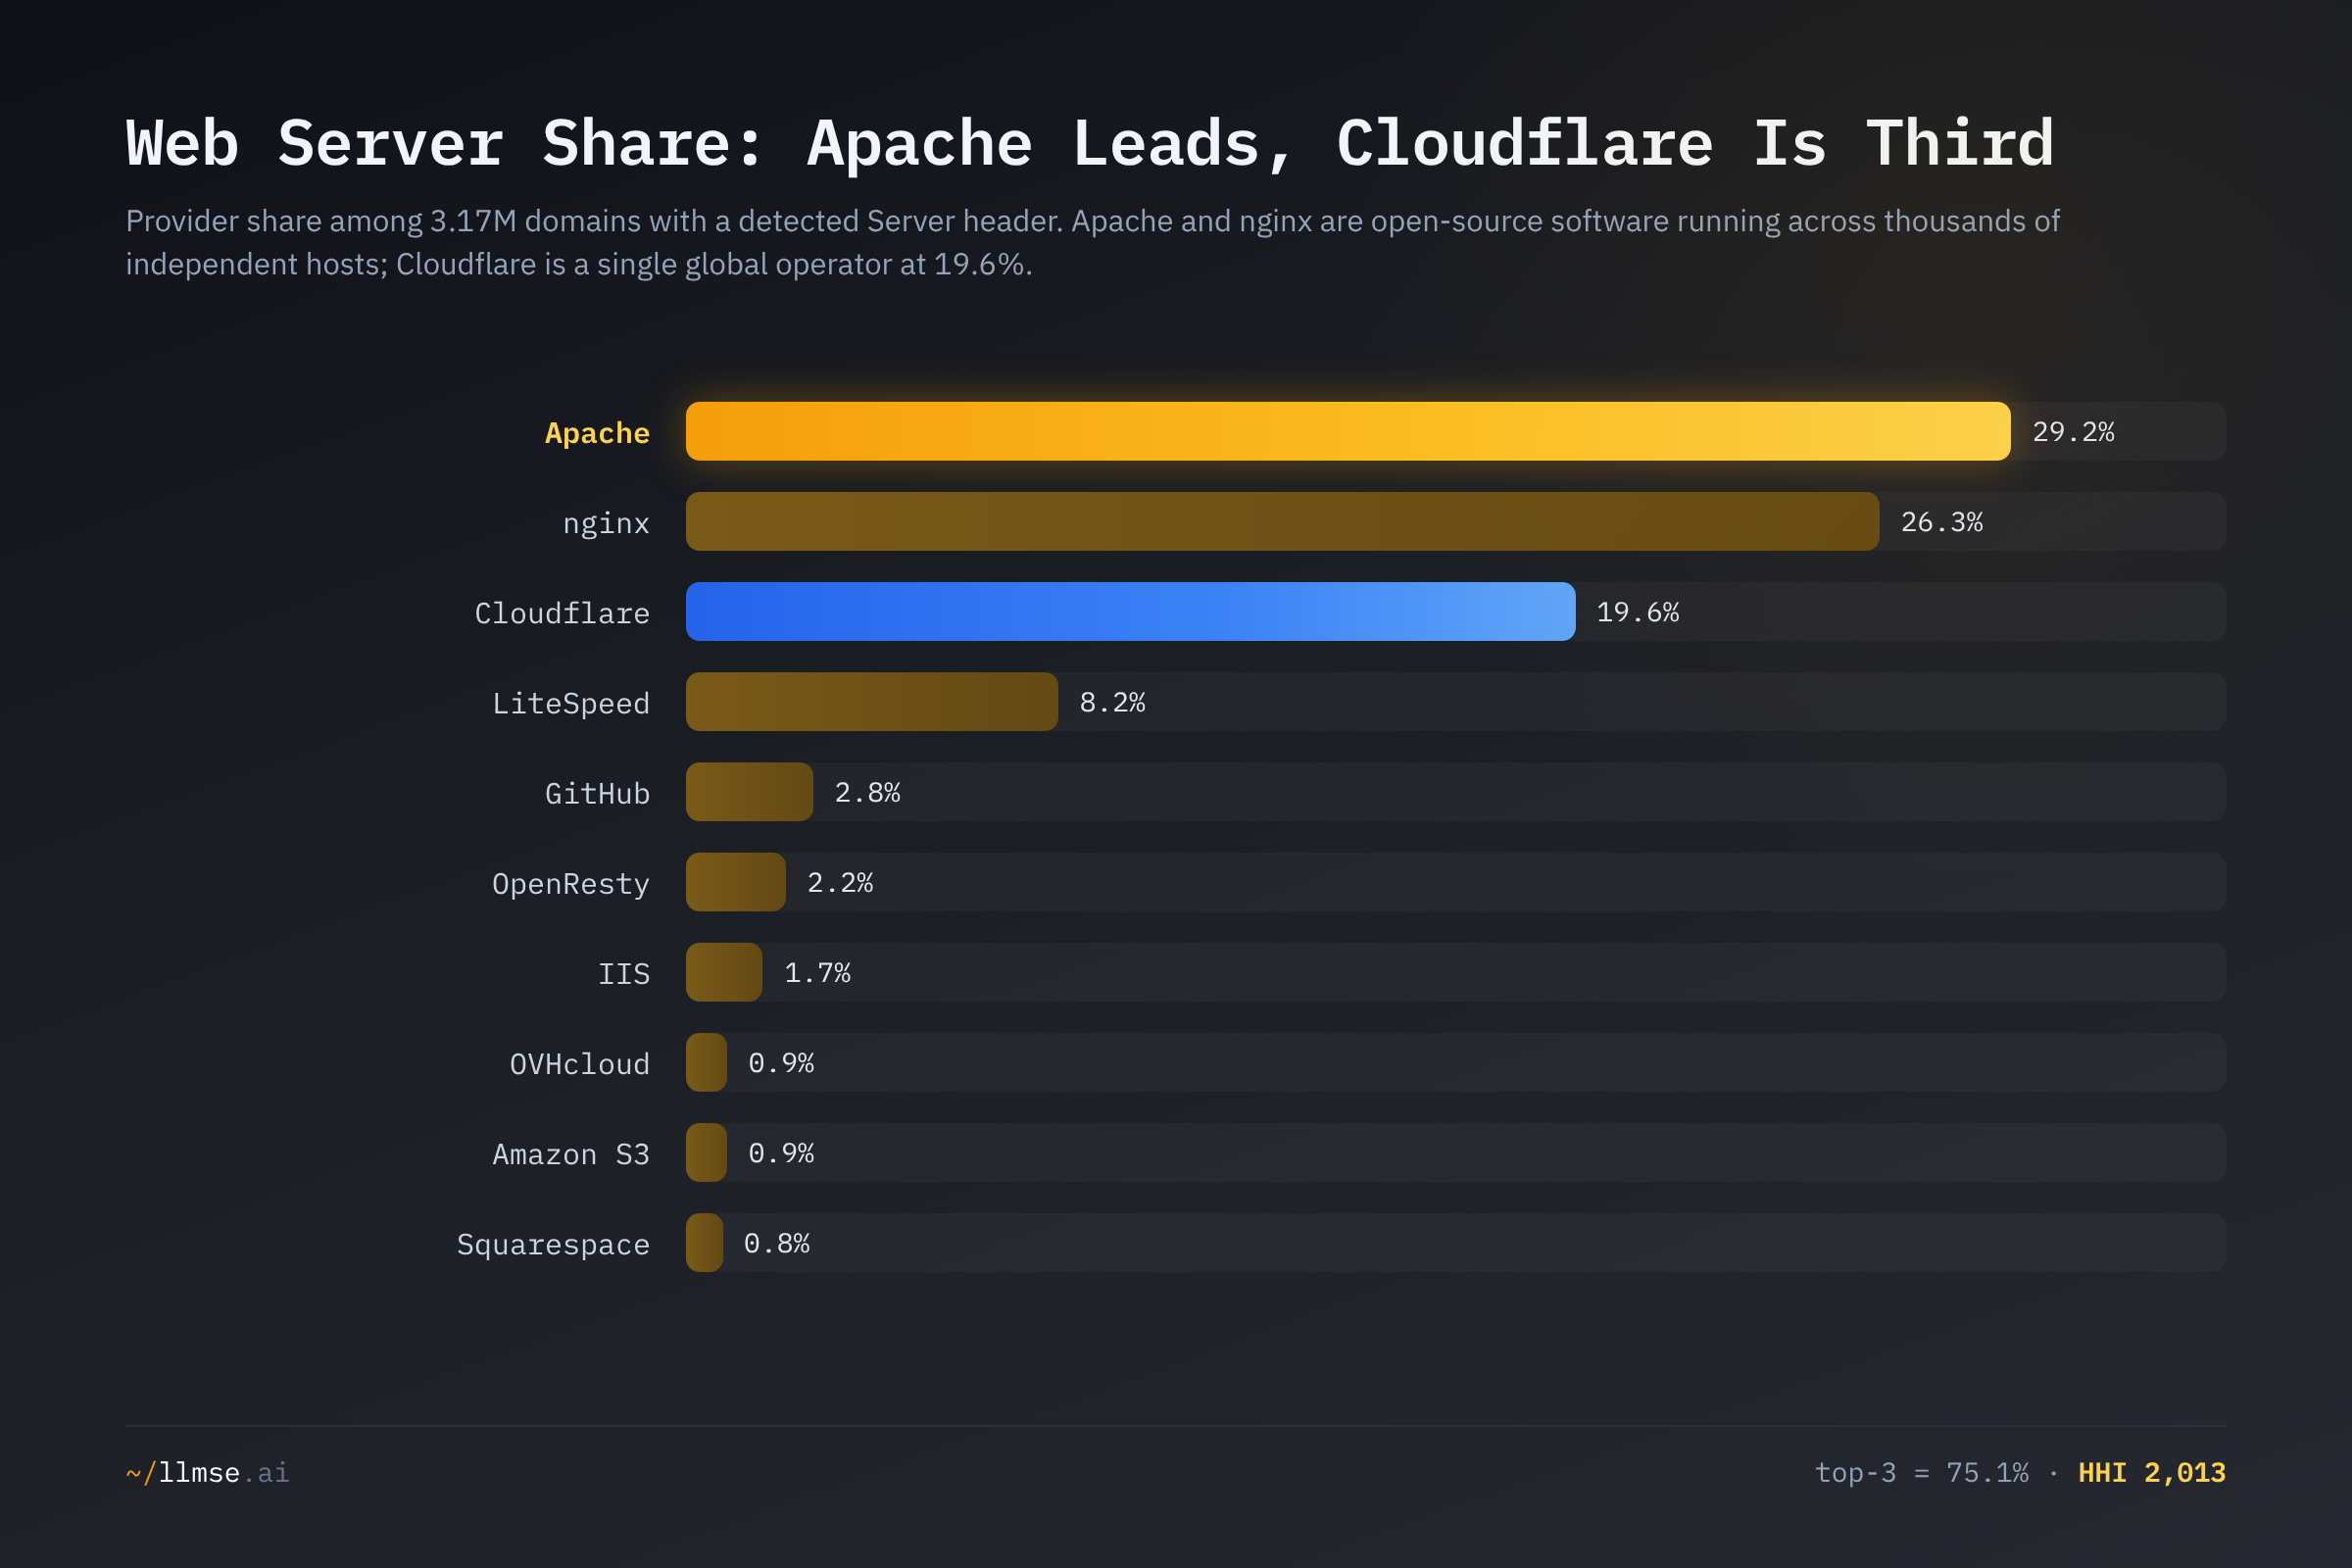
The top three account for 75.1% of detected server headers and produce an HHI of 2,013. But this number overstates real vendor concentration, because the two leaders are not vendors at all. Apache and nginx are open-source software that runs on tens of thousands of independent hosting providers, cloud instances, and self-managed boxes. When nginx ships a vulnerability, patching is distributed across all of those operators; there is no single company whose failure takes "all nginx sites" down. The HHI treats "Apache" as one firm, which is the right input for software-popularity but the wrong input for operator risk. The only entry in the top tier that is a single global operator is Cloudflare, at 19.6% — and even that figure is inflated, because the Server header reports "Cloudflare" for any site sitting behind its reverse proxy regardless of what runs at the origin.
External market trackers see the same three names with the ordering reshuffled by sampling: W3Techs' June 2026 survey puts nginx at 31.8%, Cloudflare Server at 28.5%, and Apache at 23.2% among sites with a known server. The discrepancy with our Apache-led ordering is a sampling difference — W3Techs weights toward higher-traffic sites where Cloudflare fronting and nginx are more common, while LLMSE's broader crawl reaches more long-tail Apache sites. Both datasets agree on the substance: three providers lead, two of them are open-source software, and Cloudflare's "server" share is substantially a reverse-proxy artifact. W3Techs separately estimates that Cloudflare sits in front of roughly 20% of all websites as a reverse proxy — the real measure of its edge footprint.
DNS: The Layer That De-Concentrated
DNS is where the original analysis was most wrong, and the correction is the most dramatic. The first index reported DNS at HHI 2,578 — "highly concentrated" — with Cloudflare at 40.1%. Against 1.66M domains today, the DNS layer scores HHI 947, which is squarely "unconcentrated," and Cloudflare's share has fallen to 28.3%.
| DNS Provider | Domains | Share |
|---|---|---|
| Cloudflare | 471,110 | 28.3% |
| GoDaddy | 147,356 | 8.9% |
| AWS Route 53 | 86,267 | 5.2% |
| OVH | 59,630 | 3.6% |
| IONOS | 49,647 | 3.0% |
| Namecheap | 35,376 | 2.1% |
| Google Cloud DNS | 34,311 | 2.1% |
| Bluehost | 29,626 | 1.8% |
| All-Inkl | 28,891 | 1.7% |
| One.com | 28,444 | 1.7% |
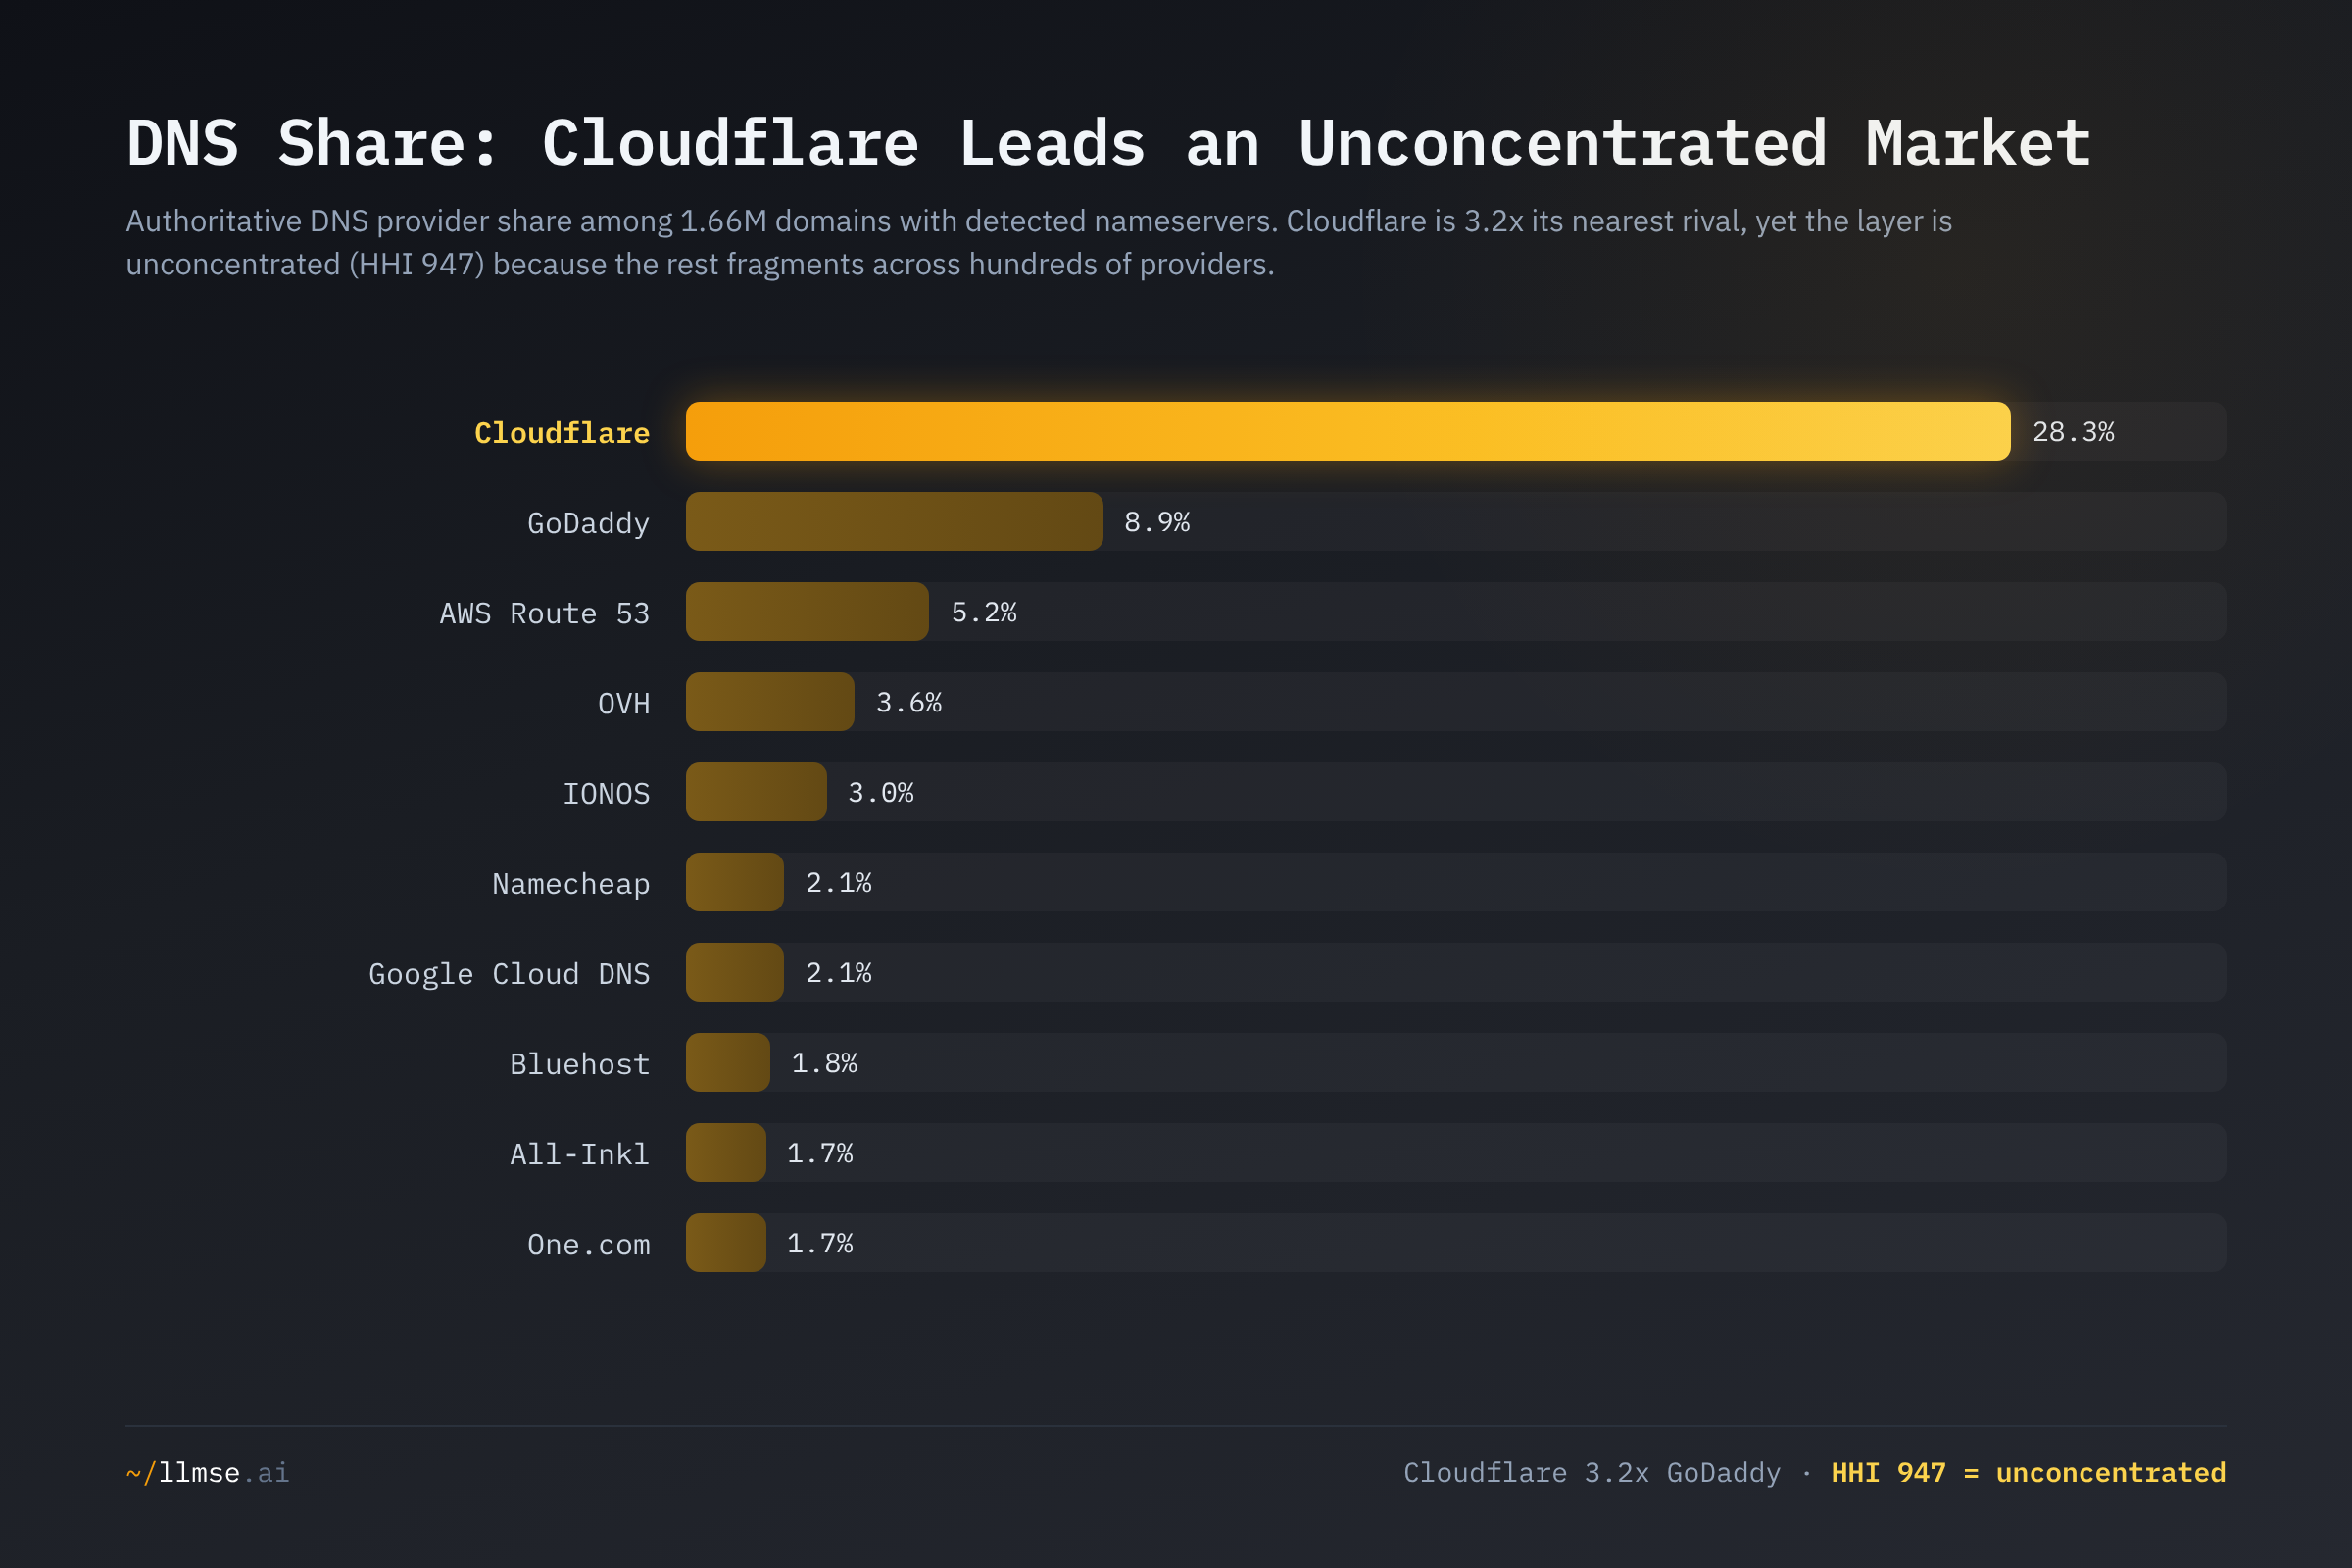
Cloudflare is still the single largest authoritative-DNS provider by a wide margin — 28.3%, more than 3.2 times second-place GoDaddy (8.9%) — yet the layer as a whole is unconcentrated. The reason is the shape of the tail: the top three providers hold just 42.3% combined, and beyond them DNS fragments across 325 detected providers, dominated by registrars and hosting companies (GoDaddy, OVH, IONOS, Namecheap, Bluehost) that each serve a few percent. This is the structure of a competitive market, and it matches how industry analysts describe managed DNS — a field with many credible players including AWS, Cloudflare, Google, Oracle, Verisign, and Akamai rather than a single dominant vendor. The original's 40.1% Cloudflare figure was a property of its small, visibility-biased sample: large, well-known sites disproportionately use Cloudflare DNS, and the early crawl was full of large, well-known sites.
The honest caveat is that unconcentrated by HHI is not the same as resilient. Cloudflare is still one company resolving the names of nearly half a million domains in this dataset, and a Cloudflare DNS failure makes every one of them unresolvable at once. HHI measures market power across the whole layer; it does not measure the blast radius of the largest single operator. Both readings are true: the DNS market is competitive, and its biggest participant is still a systemic node.
Email: A Duopoly That Never Reaches the Threshold
Email is the layer where the duopoly framing is most justified — and even here the concentration has thinned below the original's alarm. The first index put email at HHI 2,541 ("highly concentrated") with a 65.6% Google-plus-Microsoft share. Today the two together hold 54.4%, and the layer scores HHI 1,549 — moderately concentrated, comfortably below the 2023 highly-concentrated line of 1,800.
| Email Provider | Domains | Share |
|---|---|---|
| Google Workspace | 298,751 | 28.4% |
| Microsoft 365 | 273,205 | 26.0% |
| IONOS | 48,529 | 4.6% |
| OVH | 45,398 | 4.3% |
| GoDaddy | 24,072 | 2.3% |
| Strato | 24,054 | 2.3% |
| One.com | 24,022 | 2.3% |
| Zoho Mail | 23,169 | 2.2% |
| Newfold Digital | 19,051 | 1.8% |
| Proofpoint | 18,179 | 1.7% |
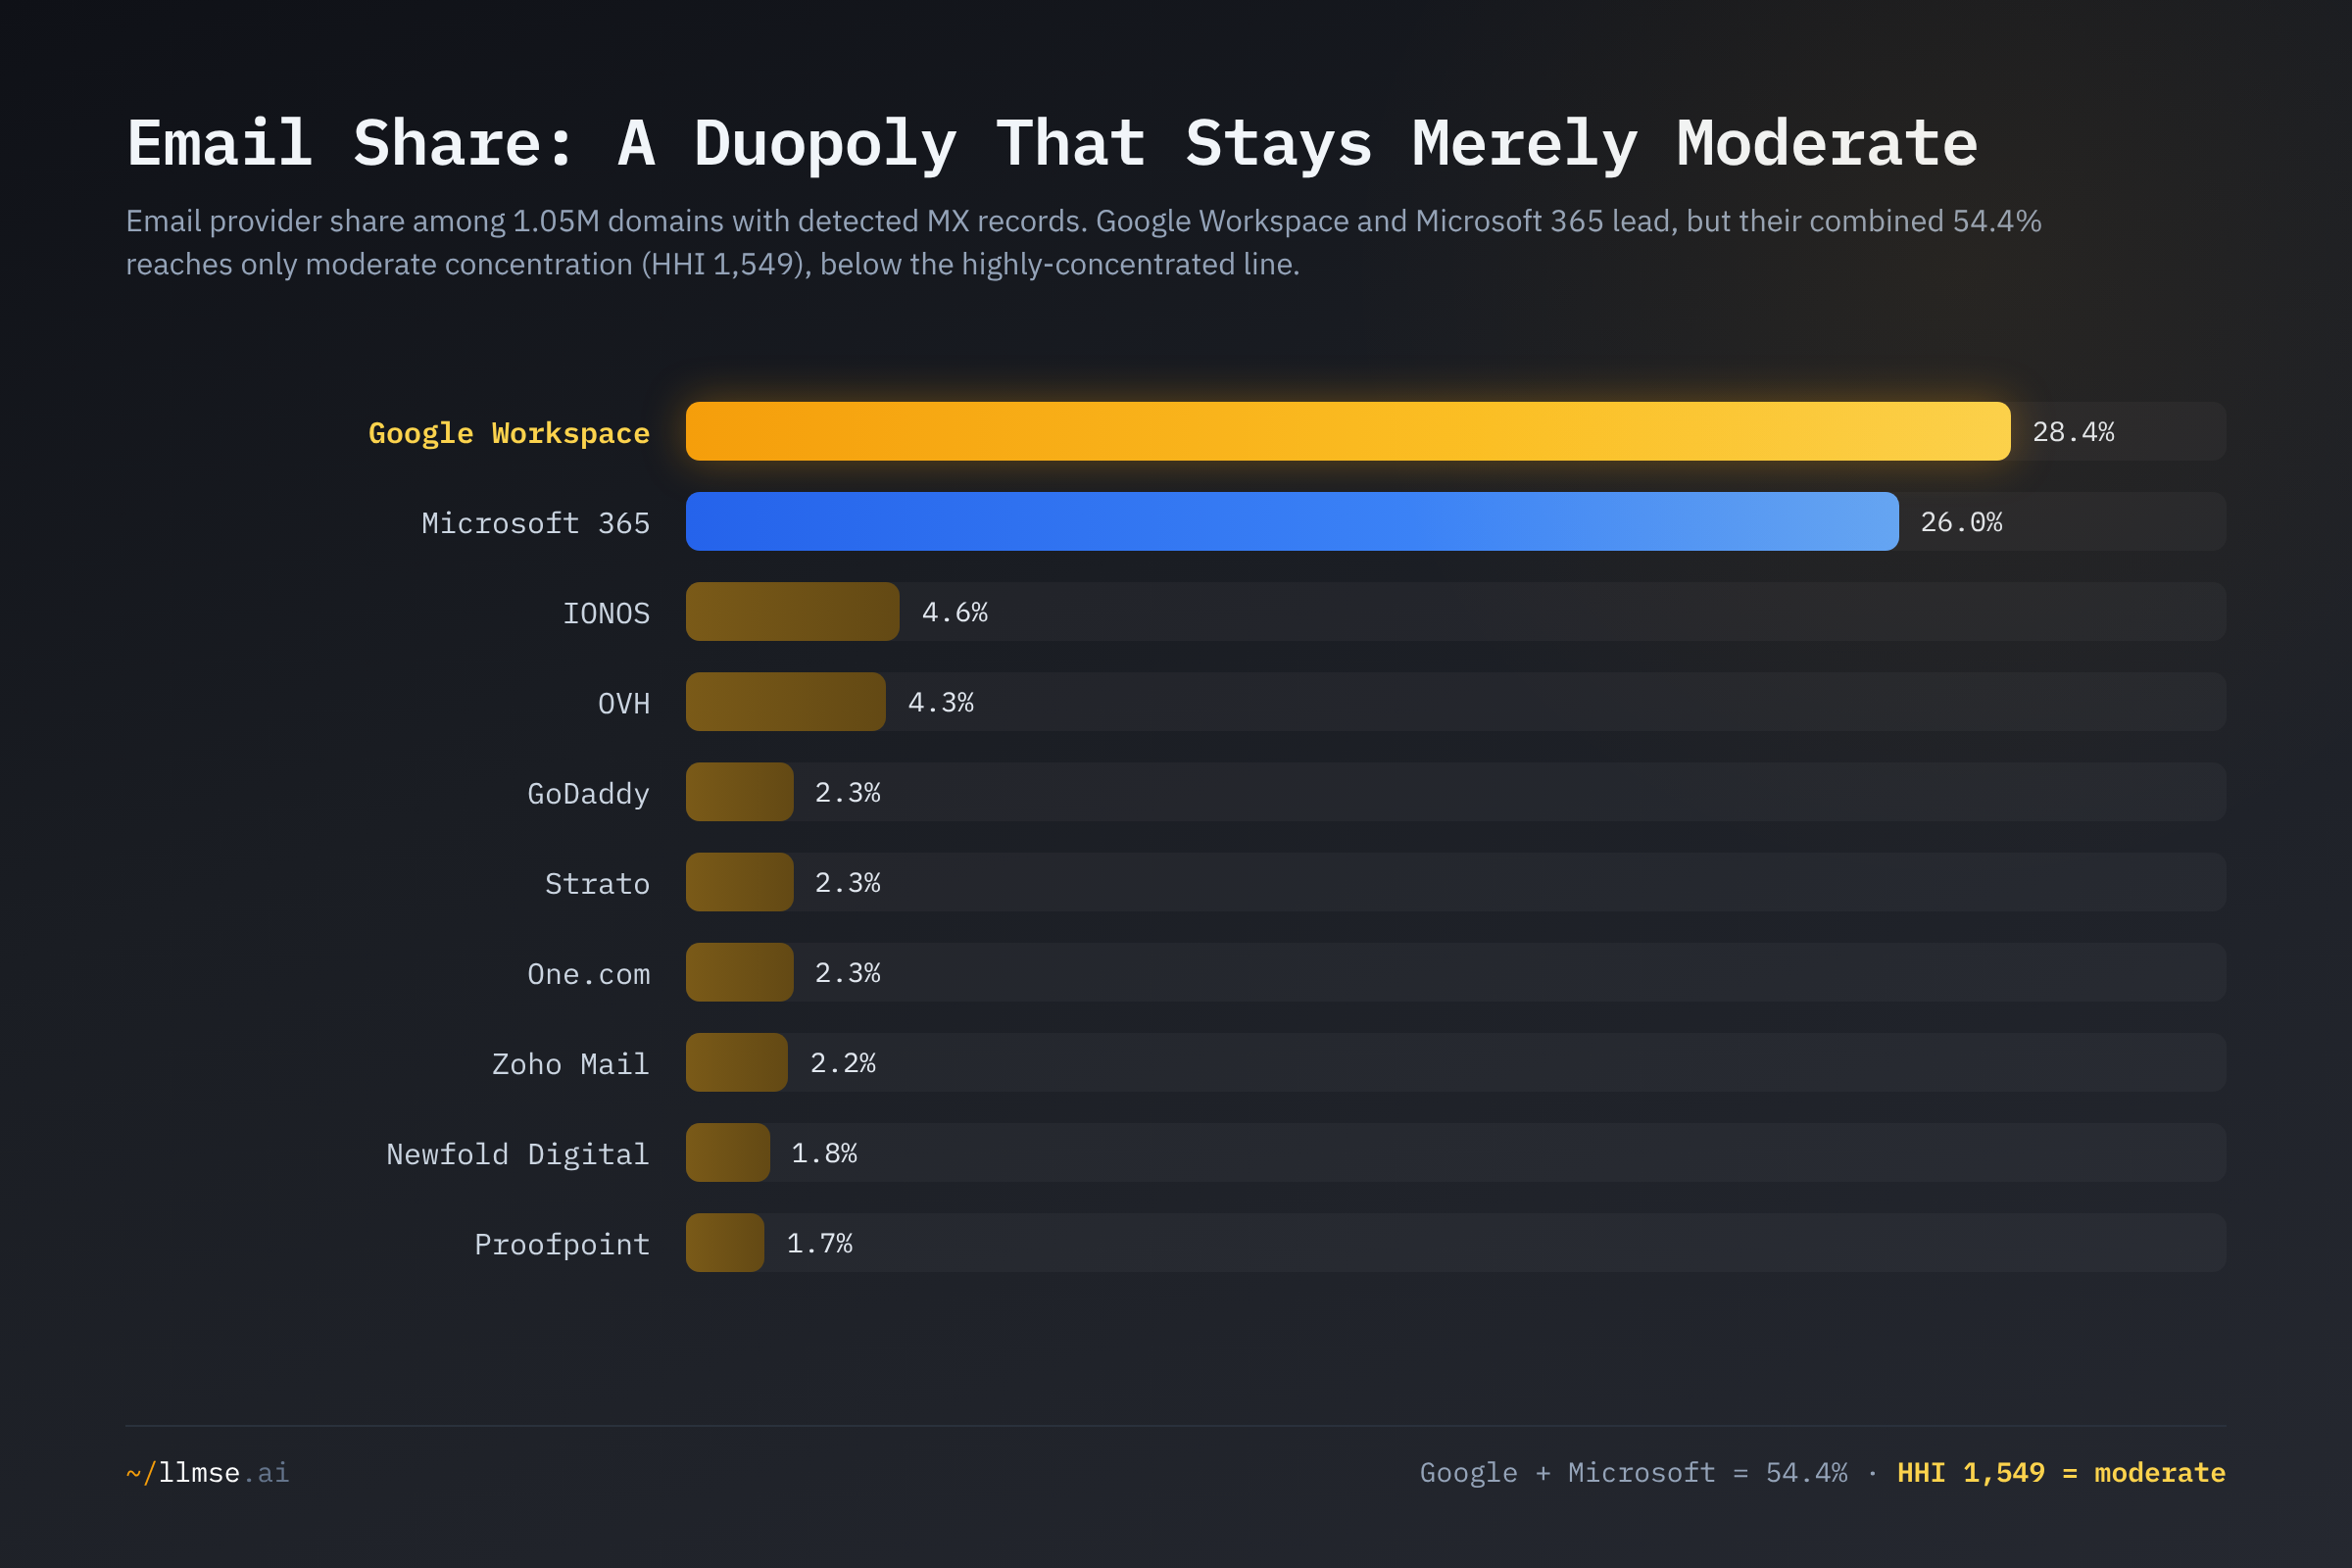
Google Workspace (28.4%) and Microsoft 365 (26.0%) are a genuine duopoly — the only layer where two providers each hold more than a quarter of the market — but neither reaches the DOJ's 30% single-firm threshold, and their combined HHI contribution still leaves the layer in the moderate band. What deflated the original's 65.6% combined share to 54.4% is the same long-tail effect: the broader sample surfaced far more domains using regional hosts and registrars for mail (IONOS, OVH, Strato, One.com, Newfold) and security gateways (Proofpoint, Mimecast). The duopoly is real, but it is a duopoly over the enterprise mail that dominated the early sample, not over the whole web.
The structural concern with email is less about HHI than about jurisdiction: the two leaders are both U.S. companies, and most of the web's business mail routes through them. The EU's NIS2 directive now classifies cloud and DNS providers as essential digital-infrastructure entities, and the data-sovereignty questions that follow from routing half the web's mail through two foreign hyperscalers are a policy issue the HHI does not capture.
What's at Stake
- The "internet is dangerously concentrated" narrative is half right, and the wrong half is the one usually cited. By market structure, the web's infrastructure is more competitive than the merger guidelines would block — DNS is unconcentrated, email is moderate, and the one concentrated layer is concentrated in open-source software, not vendor lock-in. The original framing overstated the market-structure problem.
- Low HHI does not mean no single point of failure. Cloudflare is still the largest single DNS operator (28.3%) and fronts roughly 20% of all websites at the edge; the AWS and Cloudflare outages of late 2025 took down thousands of services even though neither company holds a dominant market share. Operational concentration — one operator's failure domain — is a separate risk from market concentration, and resilience planning should target the former.
- The web-server HHI is a measurement trap. Reading 2,013 as "the server market is concentrated under three vendors" is wrong: two of the three are open-source projects with no single operator. Anyone benchmarking infrastructure concentration should separate software popularity from operator footprint, or they will overstate lock-in.
- The email duopoly is a sovereignty question, not an antitrust one. Two U.S. providers route the majority of detectable business mail. That clears U.S. concentration thresholds but raises jurisdiction and resilience questions in regulatory regimes — NIS2, GDPR — that the HHI does not measure.
What Would Help
- Researchers and journalists: separate software share from operator share before invoking HHI. The web-server HHI of 2,013 is driven by Apache and nginx, which are not companies. Concentration claims about "who could take the web down" should be built on single-operator footprints (Cloudflare's reverse-proxy and DNS share), not on
Server-header popularity. - Site owners: diversify the operator, not the software. The resilience lesson of 2025 is single-operator blast radius, not market share. If your web serving, DNS, and mail all terminate at one vendor, an outage there is total — regardless of how competitive that vendor's market looks. Check your own stack's providers on a domain detail page.
- Regulators: target operational resilience, which HHI misses. NIS2 already names DNS, cloud, and CDN providers as essential entities. The data supports that focus: the systemic risk lives in the largest single operators' failure domains, not in market concentration that mostly clears the merger thresholds.
- Enterprises in the EU: treat the mail duopoly as a sovereignty decision. Google Workspace and Microsoft 365 are operationally excellent and jointly hold a majority of detectable business mail, but both are U.S.-jurisdiction. Where data residency matters, the moderately concentrated tail — IONOS, OVH, Proofpoint, Zoho — is a real and growing field of alternatives.
- Platform and tooling vendors: report concentration honestly. Dashboards that headline a single "infrastructure concentration" score conflate three layers with different structures. The reproducible, per-layer view — server HHI 2,013, email 1,549, DNS 947 — is more useful than any blended index, and it is recomputable from public provider shares.
This analysis was conducted using LLMSE, which has classified over 3.4 million websites across SEO, EEAT, AEO, WCAG accessibility, readability, GARM brand safety, and privacy dimensions. Infrastructure figures reflect provider detection across 3,171,383 web-server headers, 1,664,141 nameserver records, and 1,051,461 mail records in the index as of June 2026. Browse the live distributions on LLMSE's technology index — web servers, DNS providers, and mail providers — or check any domain's full infrastructure profile at llmse.ai/classify.