Web Server Wars 2026: Apache Leads on Volume, Modern Platforms Lead on Quality
Update — 2026-06-29: Refreshed against LLMSE's current index of 3.4 million classified URLs (up from ~1.5M, of which 3.17M now carry a detected Server header versus 1.25M at first publication) and expanded from four graded dimensions to six, adding AEO (AI-answer optimization) and Privacy. The original's headline does not hold: Cloudflare is not the market leader. Across the broader registered-domain crawl, Apache is #1 at 29.2%, nginx #2 at 26.3%, and Cloudflare #3 at 19.6% — the "Cloudflare leads at 30.9%" claim was an artifact of the smaller, CDN-skewed early sample. The big-three concentration (~75%) still holds, and the secondary findings survive directionally: modern deploy platforms still out-SEO the legacy stack ~5x, builders still win accessibility, LiteSpeed is still the WordPress server, and Cloudflare still concentrates gambling traffic. The original's SEO-A leaderboard was recomputed (55.1% on Cloudflare, down from a mis-sampled 70.6%), and its per-server content-category, language, and sentiment tables were dropped to keep this post focused on share and per-server quality. The thesis is reframed, not reversed: your server predicts your site's quality because it proxies who built it — the software does not change the outcome.
W3Techs says nginx leads the web server market. Netcraft, scanning 1.38 billion hostnames, says nginx leads too, with Cloudflare and Apache trailing. The traffic-weighted surveys and the all-hostname surveys disagree on the numbers by double digits, but they agree on the direction of the last few years: nginx and Cloudflare up, Apache down.
Run the same question against a broad crawl of registered domains rather than the traffic-weighted top sites, and a different leader appears. Across the long tail of small business, parked, and shared-hosting domains — the bulk of the registered web — Apache's installed base is still the largest single bloc. The "server wars" look less like a Cloudflare coronation and more like a three-way standoff in which the oldest player still holds the most ground.
We recomputed market share over 3,171,372 sites with a detected Server HTTP header in LLMSE's index, then cross-referenced each server against the six quality dimensions LLMSE grades — SEO, AEO (AI-answer optimization), EEAT (trust), WCAG accessibility, readability, and privacy — using the same automated graders applied to the rest of the web. The point was to answer the question the market-share surveys can't: does your server choice say anything about your site's quality?
It says a great deal — but not about the server. Apache leads market share at 29.2%, yet sites on modern deploy platforms (Vercel 6.3%, Netlify 5.4%) pass technical SEO roughly five times as often as sites on Apache (1.2%) or nginx (1.3%). Website builders double the legacy stack's accessibility pass rate, LiteSpeed is bound to WordPress more tightly than any other server, and Cloudflare carries seven times the gambling concentration of Apache or nginx. The server software is not making these sites better or worse. It is a proxy for who built them and why.
The Data
LLMSE grades each URL it classifies across six independent quality dimensions; not every URL carries every grade, so per-dimension denominators differ. The table below is the web-wide baseline every later server figure is measured against.
| Dimension | URLs graded (web-wide) | Web-average pass rate |
|---|---|---|
| SEO | 3,362,618 | 1.9% |
| AEO (AI answers) | 3,337,211 | 1.5% |
| EEAT (trust) | 3,358,095 | 45.4% |
| WCAG (accessibility) | 3,341,134 | 43.8% |
| Readability | 3,341,285 | 32.8% |
| Privacy | 3,335,398 | 37.0% |
Server identification is based on the Server response header captured during classification. 3,171,372 sites returned a recognizable server header; the rest suppress or customize it and are excluded. The header reflects what the HTTP response reports, not necessarily the origin — a Cloudflare-fronted site may run nginx or Apache behind the edge — so these figures describe the public-facing server, which is the layer a visitor and a crawler actually meet. GitHub Pages, Squarespace, Wix (which fronts with a server token of Pepyaka), Vercel, Netlify, and Framer are website-builder and deploy-platform identities rather than general-purpose servers; we keep them in the analysis because the comparison between them and the traditional stack is the entire story.
Methodology
This post makes quantitative comparisons across servers, so the definitions and limits matter.
- Grades and "pass." Each site is graded A-F by a dedicated automated analyzer (there is no E grade). "Pass" means A+B+C for SEO, AEO, EEAT, WCAG, and Privacy, and A+B for Readability (a Flesch Reading Ease score of roughly 50+, ≈ 8th-grade level or below). GARM brand-safety uses a stricter band — "safe" is A only. SEO grades technical fundamentals; AEO grades answer-extractability and AI-citation signals; EEAT grades experience/expertise/authoritativeness/trust signals; WCAG covers automated accessibility checks; Privacy grades consent gating, policy presence, and tracker behavior.
- Classification basis. Server membership is by the parsed
Serverheader; each grade is an independent automated analyzer. The WCAG check is static-HTML only and covers roughly 30-40% of WCAG 2.1 Level A — full conformance requires manual testing, so "passing" here means "clears the automated bar," not "fully accessible." For scale: WebAIM's 2025 analysis of the top one million home pages found detectable WCAG failures on 94.8% of them, so even a server's "passing" cohort would mostly fail a complete audit. - Cross-references are computed as set intersections (Redis
ZINTERCARD) between aserver-{Name}index and each grade, category (Gambling), or CMS (app-WordPress) index — all URL-keyed, so the intersections are reproducible. Quality percentages are normalized to the population graded on that dimension within each server, not the full server population. - Known limits. (1) Server-builder platforms (Vercel 21,875 graded on SEO; Netlify 17,063; Framer 3,101) are small relative to Apache (922,737) and nginx (829,190); treat sub-30K cohorts as indicative. (2) Static-hosting servers (Amazon S3, Caddy) post high WCAG and readability rates partly because their pages are minimal — fewer elements means fewer detectable errors, an artifact rather than a craft. (3) Correlation between server and quality does not imply causation; server choice reflects who built the site, their budget, and the site's purpose. (4) Counts are a live snapshot and drift as classification continues. (5) Russian-language sites are excluded from every aggregate.
- Why these numbers differ from the original (and from external surveys). The graded population grew from ~1.5M to ~3.4M URLs. The original ranked a 1.25M server-tagged sample and reported Cloudflare first at 30.9% — an artifact of an early crawl that over-weighted actively managed, CDN-fronted sites. The broader crawl reweights toward the long tail of registered domains, where Apache's installed base dominates, so Apache moves to #1 and most absolute pass rates fall a few points as coverage broadens. LLMSE's leader (Apache) differs from W3Techs (nginx) and Netcraft (nginx) for the same reason it should: W3Techs is traffic-weighted toward the top ~10M sites and Netcraft counts all 1.38B hostnames including parked and infrastructure records, while LLMSE indexes a breadth of registered domains. Different sampling frames, different leaders — the section below reconciles them.
The Scorecard: Apache #1, but It Depends How You Count
Ranked by share of the 3.17M server-tagged sites, the field is a clear three-tier structure: a dominant top three, a mid-tier led by LiteSpeed, and a long tail of builders and niche servers.
| Rank | Server | Sites | Share |
|---|---|---|---|
| 1 | Apache | 926,065 | 29.2% |
| 2 | nginx | 833,852 | 26.3% |
| 3 | Cloudflare | 621,772 | 19.6% |
| 4 | LiteSpeed | 259,887 | 8.2% |
| 5 | GitHub Pages | 88,651 | 2.8% |
| 6 | OpenResty | 69,736 | 2.2% |
| 7 | IIS | 54,036 | 1.7% |
| 8 | OVHcloud | 28,590 | 0.9% |
| 9 | Amazon S3 | 27,727 | 0.9% |
| 10 | Squarespace | 26,146 | 0.8% |
| 11 | Wix (Pepyaka) | 23,316 | 0.7% |
| 12 | Vercel | 22,224 | 0.7% |
| 13 | Netlify | 17,133 | 0.5% |
| 14 | Caddy | 12,725 | 0.4% |
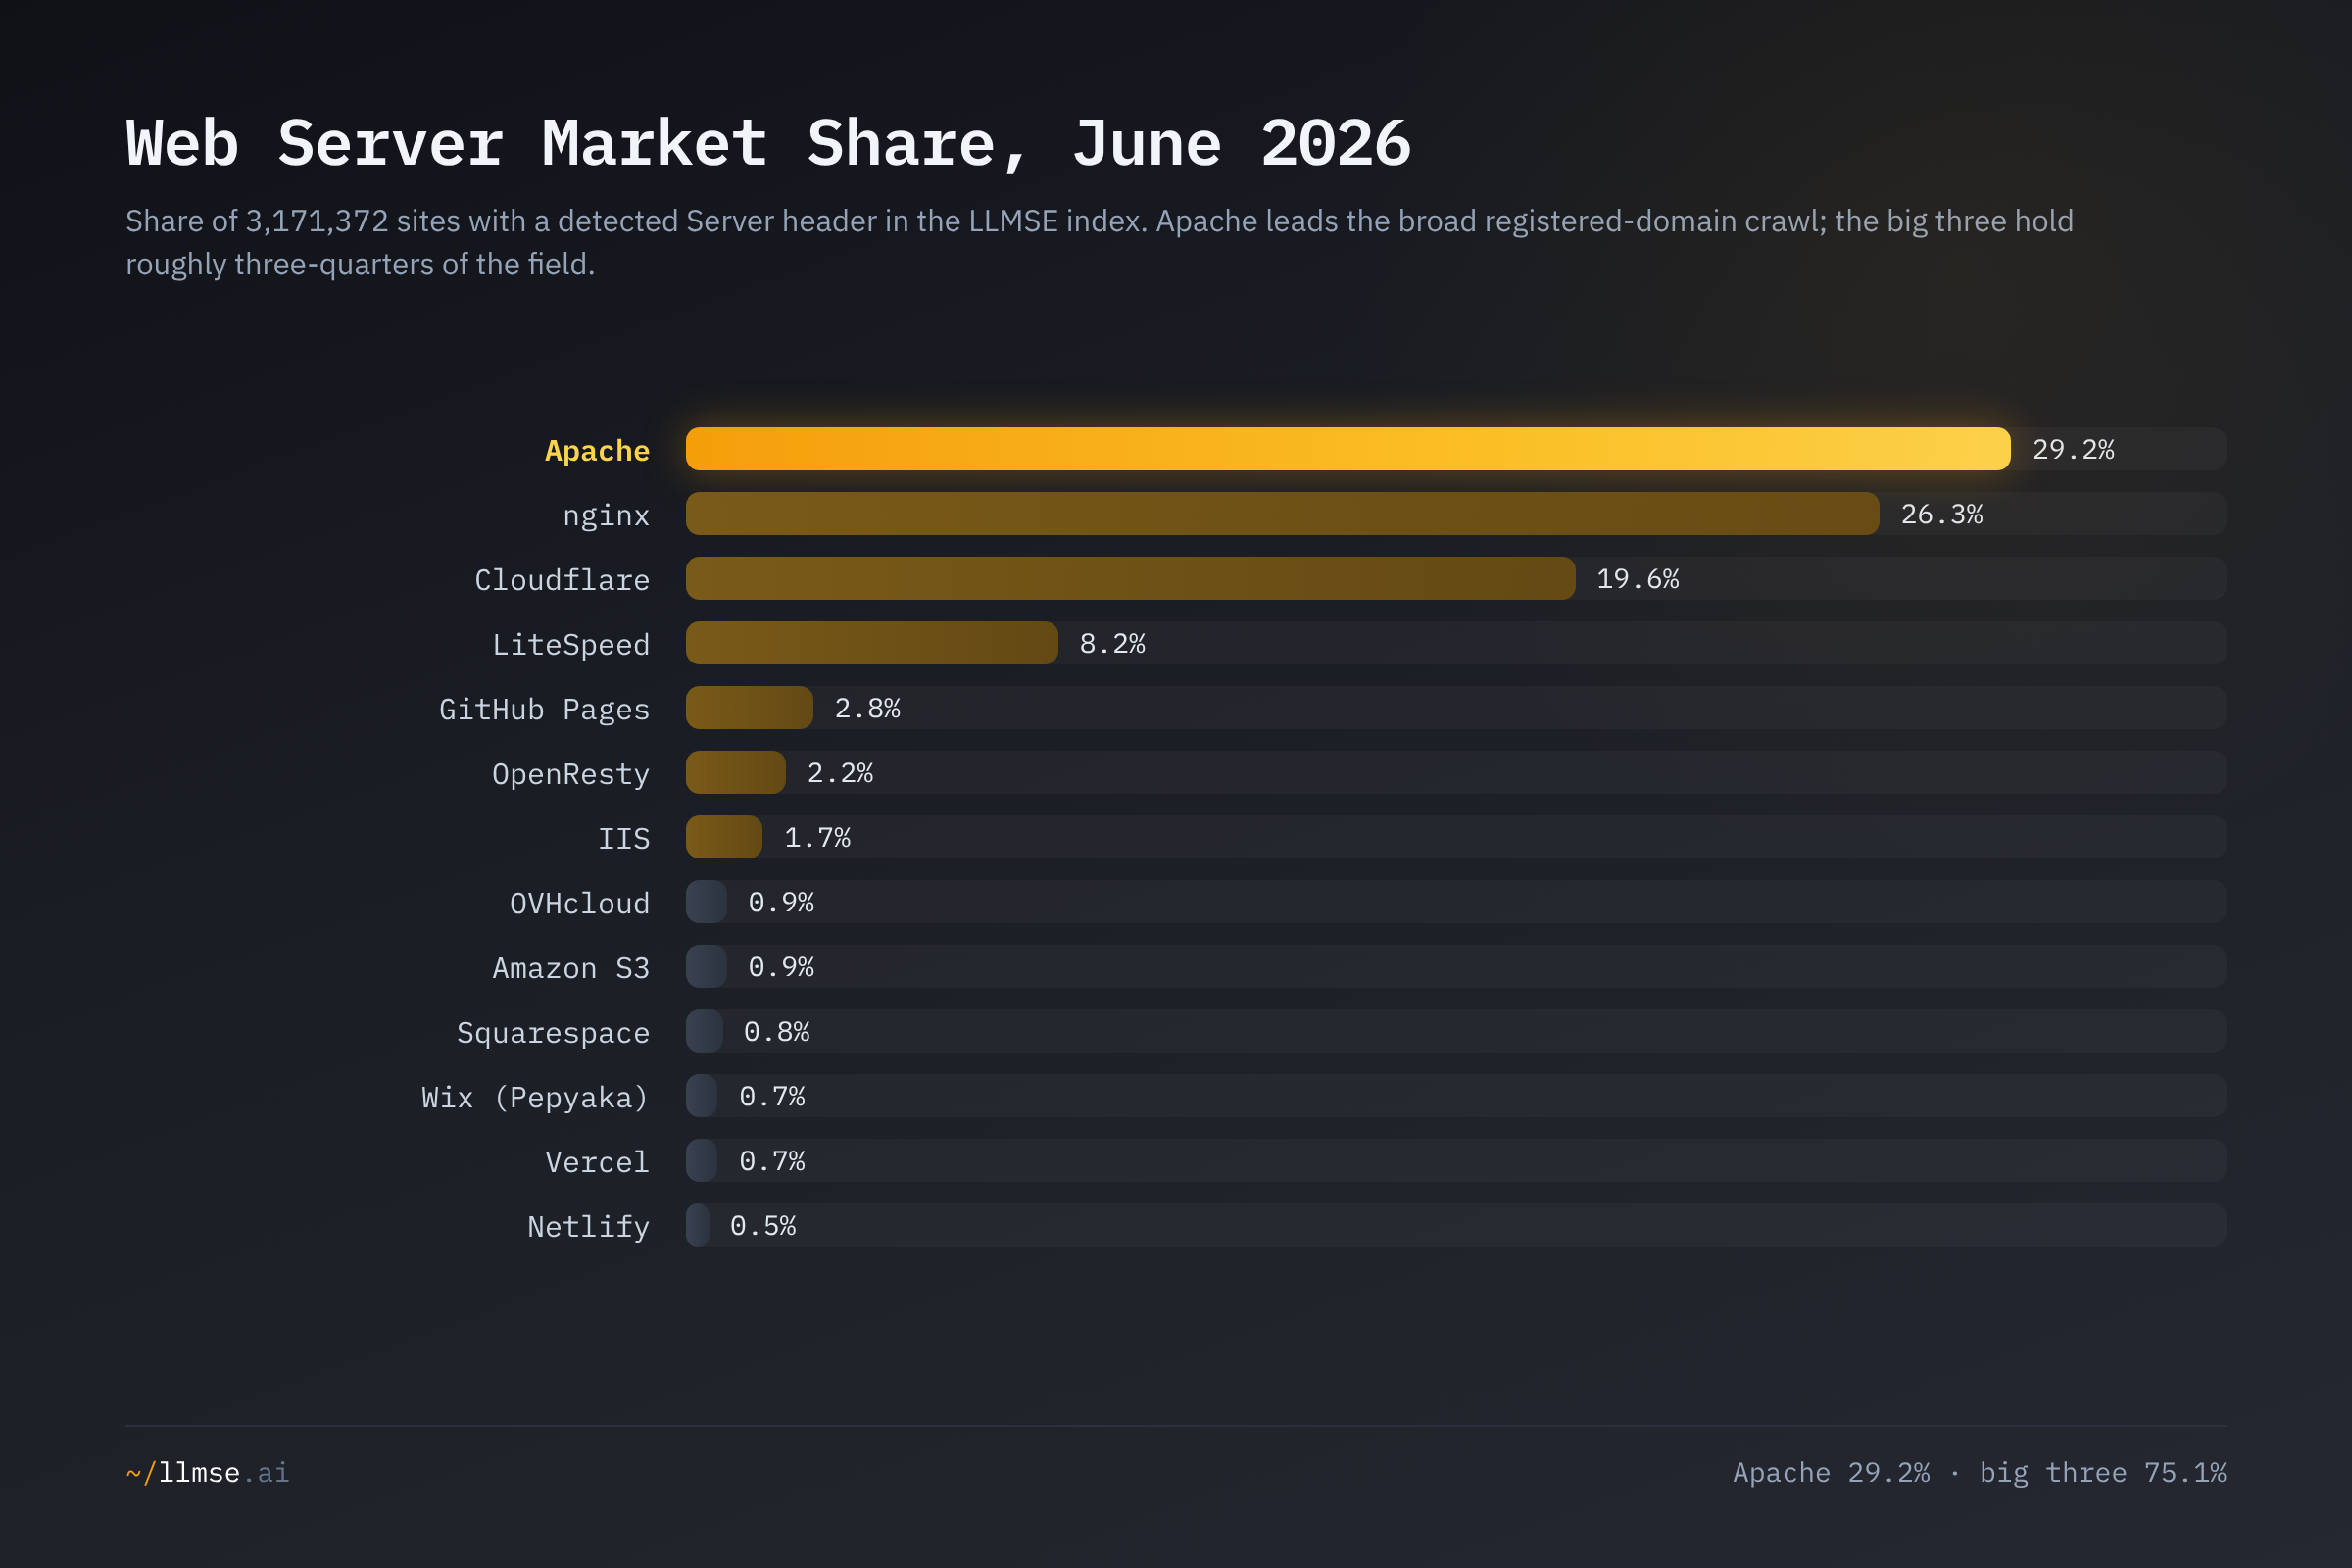
Apache leads at 29.2%, nginx is close behind at 26.3%, and Cloudflare is a clear third at 19.6% — together 75.1% of every site with a detectable server. That big-three concentration is the one headline the original got right, and it holds: three vendors front three-quarters of the registered web, the same infrastructure consolidation the Internet Society has flagged as a resilience risk.
But "who leads" depends entirely on what you count. The external surveys put nginx first because they weight differently:
| Server | LLMSE (registered domains) | W3Techs (top sites) | Netcraft (all hostnames) |
|---|---|---|---|
| Apache | 29.2% | 23.2% | ~12% |
| nginx | 26.3% | 31.8% | 23.1% |
| Cloudflare | 19.6% | 28.5% | ~15.6% |
| LiteSpeed | 8.2% | 15.1% | — |
W3Techs (June 2026) measures sites whose server is known among the most-trafficked, inflating servers popular with high-traffic operators — nginx and Cloudflare. Netcraft's January 2026 survey counted 1,376,952,390 sites across 295 million domains, diluting everything with parked pages and infrastructure hostnames. LLMSE sits between them: a broad crawl of registered domains where Apache's vast shared-hosting and SMB installed base — invisible in traffic-weighted rankings — reasserts itself. No survey is "right"; they answer different questions. Apache leads the web by breadth of registration; nginx leads it by traffic. The rest of this report is about what each server's tenants actually build.
The quality picture across all six dimensions, for the servers large enough to compare (standout cell per column in bold):
| Server | SEO | AEO | EEAT | WCAG | Read. | Privacy |
|---|---|---|---|---|---|---|
| Apache | 1.2% | 0.5% | 35.4% | 40.3% | 31.5% | 36.8% |
| nginx | 1.3% | 0.8% | 40.6% | 44.9% | 37.1% | 30.4% |
| Cloudflare | 4.1% | 4.9% | 62.1% | 39.9% | 37.5% | 44.9% |
| LiteSpeed | 1.4% | 0.8% | 33.7% | 33.7% | 24.4% | 40.3% |
| GitHub Pages | 2.1% | 1.2% | 49.6% | 54.7% | 31.9% | 3.1% |
| IIS | 1.1% | 0.6% | 42.6% | 39.1% | 27.2% | 23.4% |
| Vercel | 6.3% | 2.5% | 57.7% | 61.4% | 27.9% | 39.4% |
| Netlify | 5.4% | 1.3% | 46.1% | 64.4% | 26.4% | 23.4% |
| Squarespace | 1.1% | 0.8% | 32.8% | 53.7% | 42.3% | 20.6% |
| Wix (Pepyaka) | 1.3% | 0.1% | 88.8% | 63.1% | 35.8% | 21.4% |
| Framer | 3.7% | 1.0% | 83.1% | 32.0% | 26.6% | 52.7% |
| Web average | 1.9% | 1.5% | 45.4% | 43.8% | 32.8% | 37.0% |
No server leads more than one or two dimensions, and the leaders are almost never the market-share leaders. Apache and nginx — 55% of the web between them — sit at or below the web average on five of six dimensions. The standouts are the platforms hand-picked by people building modern, branded, or developer-driven sites. The sections below take the dimensions in turn.
SEO: Modern Platforms Lap the Legacy Stack
The original's central finding survives intact and slightly wider. Vercel sites pass technical SEO at 6.3% and Netlify at 5.4% — against 1.3% for nginx and 1.2% for Apache, a gap of roughly 4.8x. Cloudflare (4.1%) and the design tool Framer (3.7%) also clear the web average comfortably; the traditional stack and the enterprise servers (IIS 1.1%, OpenResty 0.7%) sit at or below it.
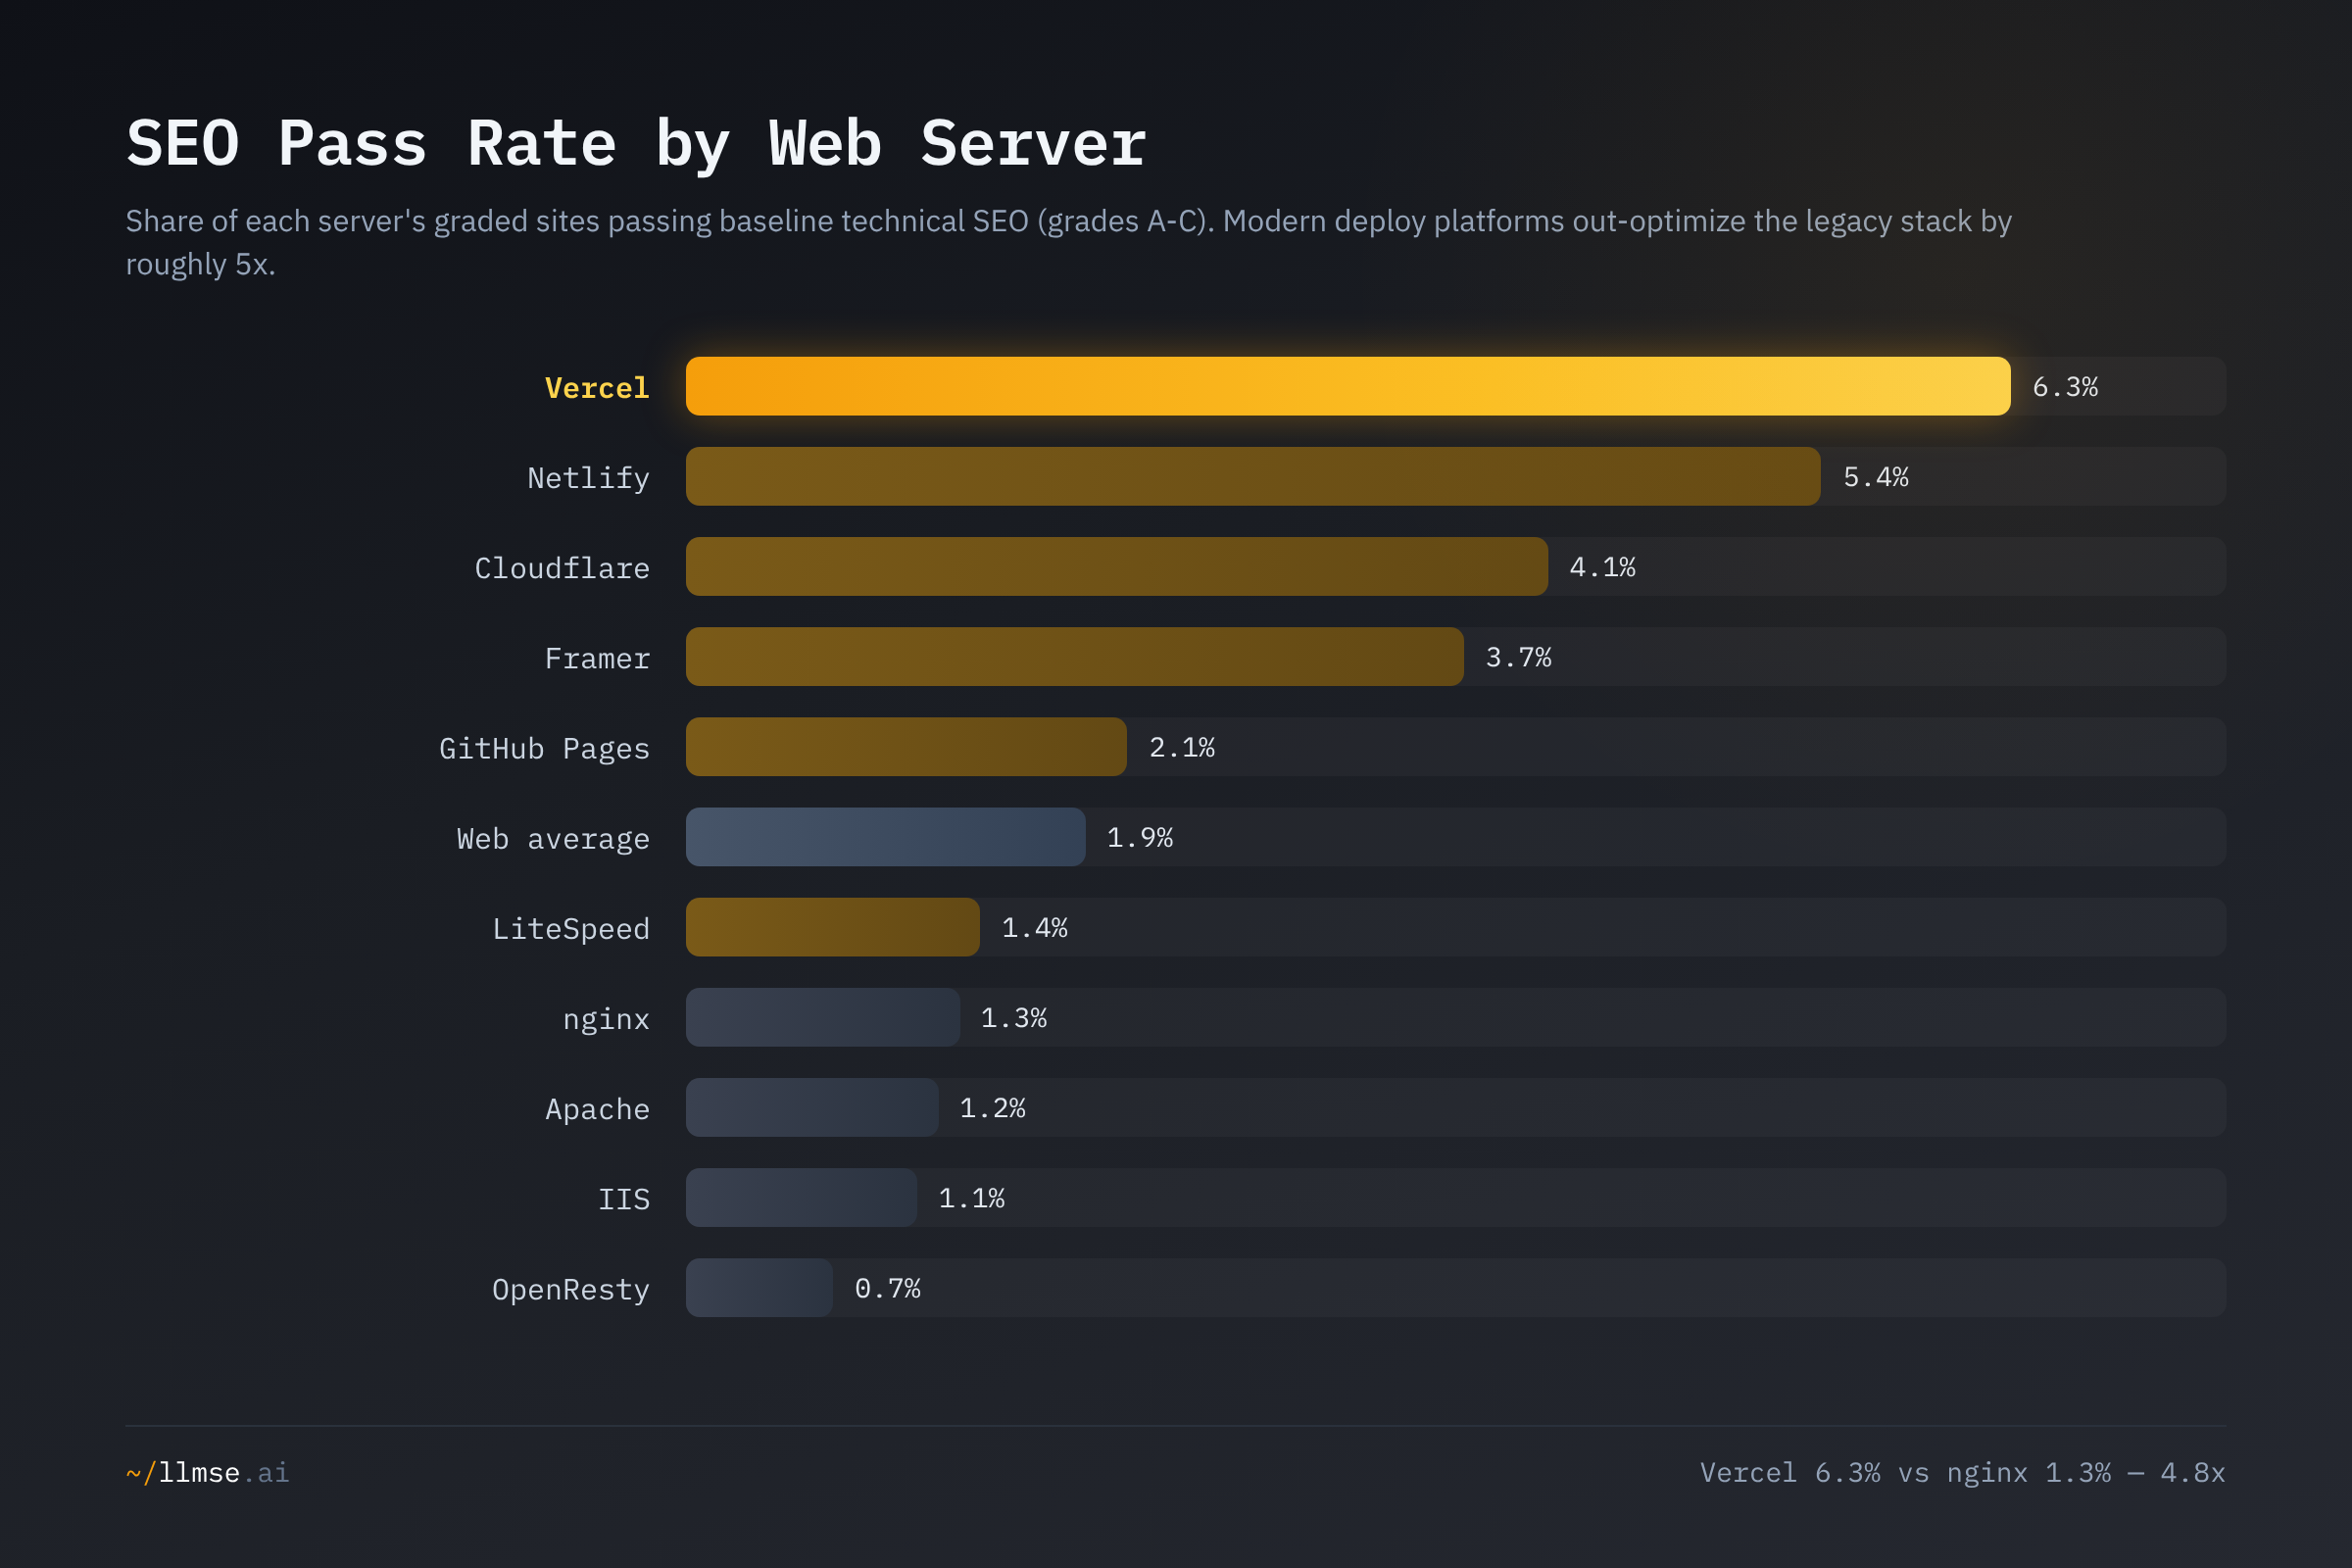
This is correlation, not causation, and the mechanism is selection. Vercel and Netlify are where developers ship Next.js, Astro, and static-generated sites with meta tags, canonical URLs, and structured data baked into the framework defaults. Apache and nginx are where everything else lives — including the long tail of abandoned, parked, and template-default sites that drag the average down. Google's own position reinforces the point: Search Advocate John Mueller has repeatedly said Core Web Vitals "are not giant factors in ranking", and server software has never been a ranking signal at all. The server doesn't rank; the discipline of the team that chose it does.
The elite tier makes the selection effect concrete. Only 1,079 sites in the entire index earn an SEO A-grade, and 594 of them — 55.1% — sit behind Cloudflare, even though Cloudflare is only the third-largest server at 19.6% share. (The original reported 70.6% on the smaller sample; the corrected figure is still a clear majority.) nginx accounts for 152 of the A-grades, Apache 135, LiteSpeed 54. The web's best-optimized sites cluster on a CDN not because the CDN optimizes them, but because the same teams that obsess over SEO also put their sites behind Cloudflare. Elite optimization and infrastructure investment travel together.
AEO: Cloudflare's Gambling Tenants Are Winning the AI-Answer Race
AEO — getting content surfaced and cited by AI answer engines — is the dimension where the market-share leaders fall furthest behind, and where one server breaks the pattern. Cloudflare leads AEO at 4.9%, more than three times the 1.5% web average and six times Apache's 0.5%. Vercel (2.5%) is the only other server clearly above the line; nginx (0.8%), LiteSpeed (0.8%), and Apache (0.5%) trail badly.
Cloudflare's AEO lead is not a property of the CDN — it is a property of who hosts there. Cloudflare carries a disproportionate share of gambling and affiliate content, and gambling is the most AEO-optimized industry on the web, passing AI-answer checks at 14.2%. The comparison tables, direct-answer formatting, and structured data that win gambling its AI-citation lead show up in Cloudflare's aggregate. AEO rewards exactly those patterns; a Princeton-led KDD 2024 study found that adding citations, quotations, and statistics can lift a source's visibility in generative-engine answers by up to 40%. The legacy stack, full of brochureware and abandoned domains, has none of it.
Trust: The Builder Platforms Top EEAT
EEAT — experience, expertise, authoritativeness, trust — inverts the market-share order completely. Wix (Pepyaka) leads at 88.8% and Framer at 83.1%, against a 45.4% web average and Apache's 35.4%. The reason is structural: website builders force the signals EEAT rewards. A Wix or Framer template ships with an "about" section, business contact fields, and consistent organizational markup whether the owner wants them or not, so the floor is high — only 0.4% of graded Wix sites score F on EEAT. Cloudflare (62.1%) and Vercel (57.7%) follow, while the bulk traditional servers and static hosts (Amazon S3 20.9%, the board's worst) trail.
A stricter reading sharpens the story. If "strong trust" means the top two grades only (A+B), Framer leads every server at 47.5% — design-agency and startup sites built on Framer carry the cleanest author and organization signals on the web. The builders don't make their tenants more honest; Google's Search Quality Rater Guidelines reward demonstrable identity and transparency, and template defaults happen to supply them. High EEAT here is compliance with what ranks, manufactured by the platform.
Accessibility: Website Builders Win by Default
WCAG accessibility shows the cleanest builder-versus-legacy divide in the dataset. Netlify (64.4%), Wix (63.1%), Vercel (61.4%), GitHub Pages (54.7%), and Squarespace (53.7%) all clear the bar far more often than nginx (44.9%), Apache (40.3%), Cloudflare (39.9%), or LiteSpeed (33.7%).
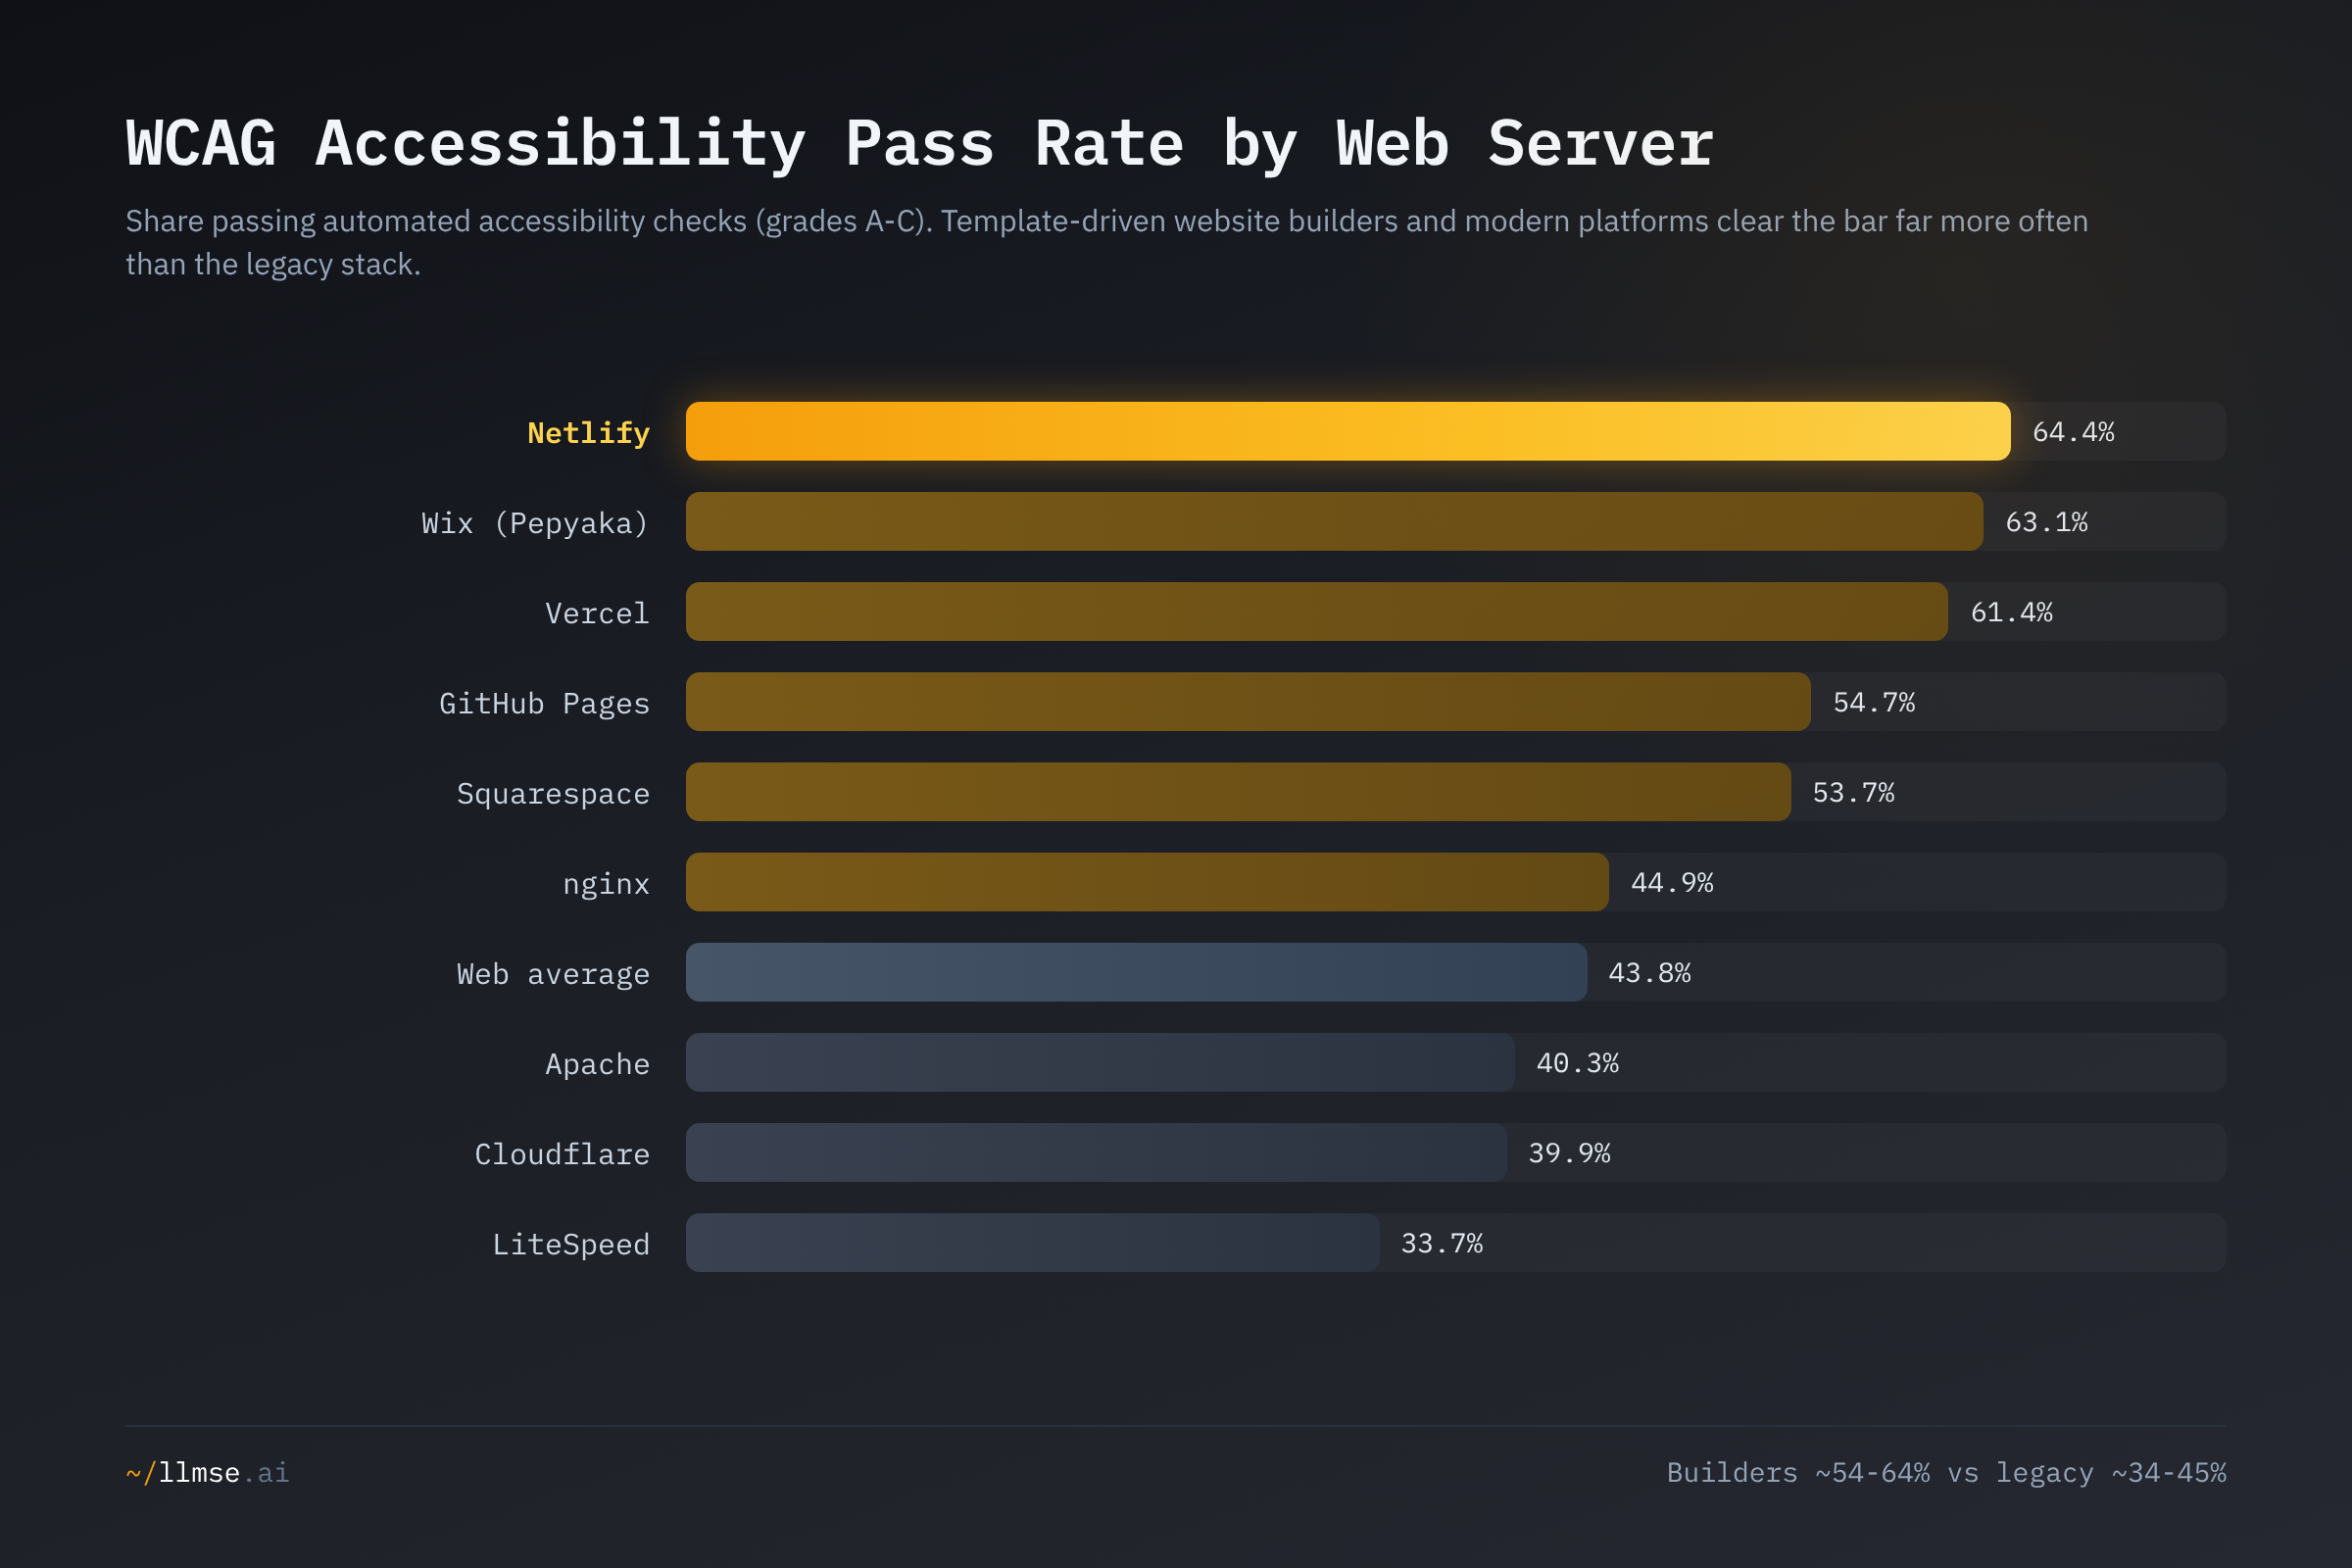
The explanation is template design, not server technology. Builder platforms generate HTML from accessibility-aware templates — semantic headings, alt-text prompts, ARIA landmarks, keyboard-navigable controls — so every site inherits the basics. Hand-coded sites on traditional servers leave accessibility entirely to the developer, and most don't prioritize it. One caveat keeps this honest: the static hosts Amazon S3 (76.7%) and Caddy (73.5%) top the raw list precisely because their pages are minimal, and WebAIM's finding that JavaScript-heavy pages accumulate more detected errors means a complex builder site is not automatically accessible. The bar here is the automated 30-40% of Level A, not full conformance.
The stakes are no longer hypothetical. The European Accessibility Act took effect on 28 June 2025, requiring WCAG 2.1 AA (via EN 301 549) for any business serving EU consumers above the microenterprise threshold, with penalties that can reach €100,000 or 4% of turnover. A site on Apache or LiteSpeed starts that compliance race 20-30 points behind a site on Wix or Netlify, not because the server is less capable, but because nobody built accessibility into its default output.
The WordPress Server: LiteSpeed's One-Industry Bet
WordPress powers the largest single bloc of the indexed web, and its distribution across servers is sharply uneven. Measured as the share of each server's sites running WordPress:
| Server | WordPress sites | WP % of server |
|---|---|---|
| LiteSpeed | 108,778 | 41.9% |
| nginx | 305,559 | 36.6% |
| Cloudflare | 207,609 | 33.4% |
| Apache | 285,640 | 30.8% |
| OpenResty | 6,633 | 9.5% |
| IIS | 2,720 | 5.0% |
| Vercel | 891 | 4.0% |
| Netlify | 490 | 2.9% |
| GitHub Pages | 1,182 | 1.3% |
| Wix (Pepyaka) | 64 | 0.3% |
LiteSpeed is the WordPress server: 41.9% of its sites run WordPress — the highest dependency of any server, and well above nginx (36.6%), Cloudflare (33.4%), and Apache (30.8%). This is by design. The LiteSpeed Cache plugin for WordPress has been downloaded over six million times and ships with server-level caching that PHP-level plugins can't match, so shared-hosting providers bundle LiteSpeed with LSCache enabled to differentiate on speed. LiteSpeed's commercial fate is tied to WordPress more tightly than any competitor's. Modern platforms barely touch it: Vercel (4.0%), Netlify (2.9%), and the builders (Wix 0.3%) host Next.js, Astro, and proprietary site formats instead. If the headless-CMS and static-generator shift that Vercel and Netlify represent keeps growing, LiteSpeed's single-industry concentration becomes a structural exposure.
The Gambling Server: Cloudflare's High-Risk Tenant Base
Server choice correlates with content type, and the sharpest example is gambling. Measured as the share of each server's sites classified as gambling — against an all-server baseline of 2.34%:
| Server | Gambling sites | % of server |
|---|---|---|
| Cloudflare | 47,973 | 7.7% |
| Amazon S3 | 497 | 1.8% |
| LiteSpeed | 4,356 | 1.7% |
| Vercel | 257 | 1.2% |
| nginx | 9,170 | 1.1% |
| IIS | 593 | 1.1% |
| Apache | 7,209 | 0.8% |
| GitHub Pages | 235 | 0.3% |
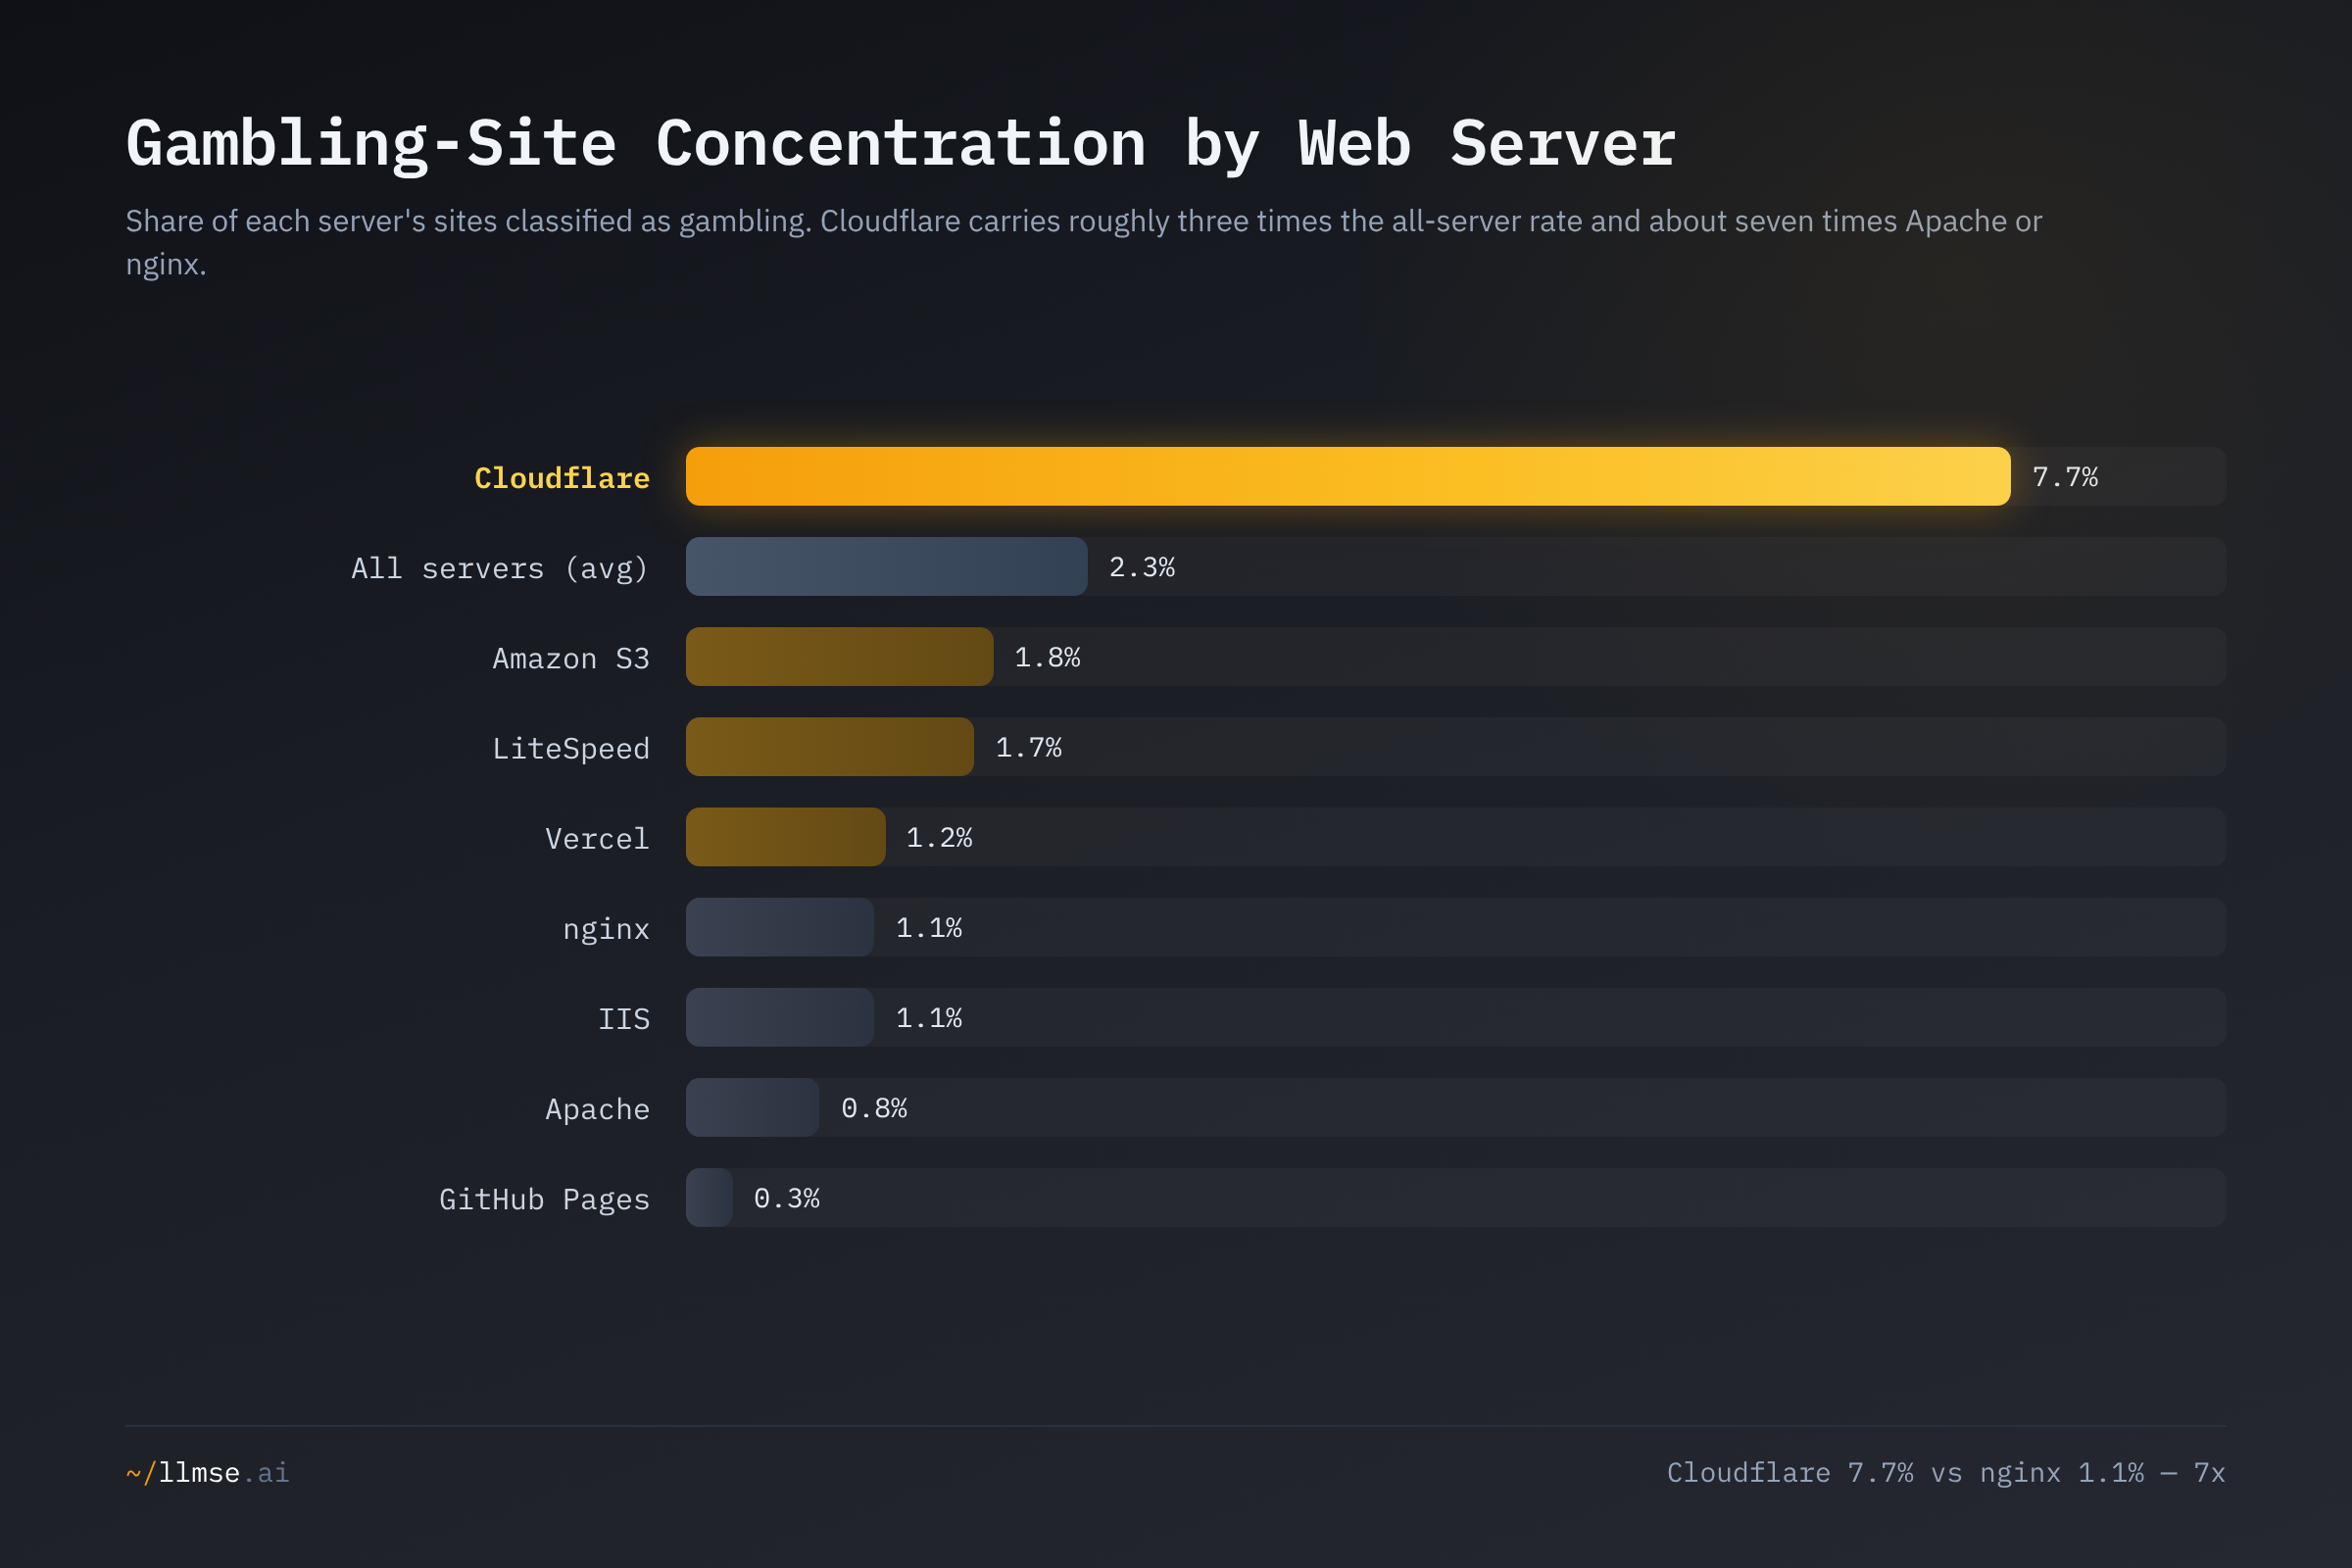
Cloudflare hosts 7.7% gambling content — about three times the all-server rate and seven times the concentration on nginx (1.1%) or Apache (0.8%). The 47,973 gambling sites behind Cloudflare are the majority of all gambling sites with a server header. The pull is specific: gambling operators face constant DDoS pressure and need global edge delivery, and Cloudflare markets directly to them — its iGaming case studies (SOFTSWISS, Playtech, WA.Technology) and a dedicated DDoS-defense-for-gambling whitepaper make it the default infrastructure for an industry locked out of conventional ad channels. This is the same tenant base that drives Cloudflare's AEO lead, and it shows up in brand safety: Cloudflare posts the lowest GARM "safe" (A-grade) rate of the major servers at 86.3%, against a 90.2% web average and Apache's 90.7%. None of this is a quality judgment on the CDN — it is a market reality that advertisers and brand-safety teams should factor into infrastructure-based targeting.
What's at Stake
- Market-share rankings are sampling artifacts — read the frame, not the headline. Apache leads LLMSE's registered-domain crawl, nginx leads W3Techs and Netcraft, and Cloudflare leads neither despite the original's claim. Anyone making a procurement, security, or competitive-intelligence decision off a single "market leader" figure is reading one slice of the web as if it were all of it.
- Server choice signals investment, not capability. The 4.8x SEO gap and the 20-30 point accessibility gap between modern platforms and the legacy stack track the teams, not the technology. A site's server is a useful proxy for how seriously its owner takes the web — and a poor excuse for its quality, in either direction.
- The accessibility gap is now a legal exposure. With the European Accessibility Act in force, the 33.7% of LiteSpeed sites and 40.3% of Apache sites that clear even automated WCAG checks sit on the wrong side of a penalty regime — and automated passing is itself a floor far below full conformance, given 94.8% of top home pages fail.
- Infrastructure concentrates content risk. Cloudflare's 7.7% gambling tenancy and lowest brand-safety rate mean that infrastructure-level decisions (DNS, CDN, ad-network blocklists) inherit the content profile of the platform. The same edge that protects a casino from DDoS makes the casino harder to filter out downstream.
- LiteSpeed's fortunes are bound to one CMS. At 41.9% WordPress dependency, LiteSpeed is the most exposed major server to a single platform's trajectory — secure while WordPress dominates, fragile if the headless/static shift accelerates.
What Would Help
- Site owners: audit the dimension your server is worst at, not the one it leads. If you're on Apache or nginx, your likely weak spots are SEO and accessibility; if you're on a builder, it's privacy and AEO. The server tells you where to look, not whether you're covered. Run a full multi-dimension check at llmse.ai/classify rather than assuming your stack has you handled.
- Developers and agencies: the platform default is doing your accessibility for you — verify it didn't stop there. Builder and modern-platform tenants start 20-30 points ahead on WCAG, but automated passing covers only ~30-40% of Level A. Treat the template baseline as a floor and test keyboard navigation, focus order, and dynamic content manually.
- WordPress hosts and LiteSpeed: diversify the optimization story beyond caching. LiteSpeed's WordPress lead is built on LSCache speed, but its tenants trail on SEO (1.4%), readability (24.4%), and accessibility (33.7%). Bundling accessibility-aware themes and SEO defaults would lift the sites that define the platform's reputation.
- Advertisers and brand-safety teams: map content risk to infrastructure, carefully. Cloudflare's gambling concentration and lower GARM-safe rate are real signals, but the CDN also fronts the majority of the high-quality web — infrastructure is a coarse filter, not a verdict. Use it to prioritize review, not to blocklist a vendor.
- AI platforms: discount the server, weight the provenance. Cloudflare's AEO lead is partly its gambling and affiliate tenancy, not a quality signal. Retrieval that over-weights well-structured pages will over-surface the optimized fringe; prefer authoritative sources within YMYL topics regardless of how the page is hosted or how cleanly it is marked up.
Explore the Data
Browse server-filtered results on LLMSE — search for s:Apache, s:nginx, s:Cloudflare, or any server name with the advanced search, and cross-reference against quality grades, CMS platforms, and content categories. The REST API exposes server detection alongside every classification dimension, and any single URL's server and grades are available through the comprehensive audit.
This analysis was conducted using LLMSE, which has classified over 3.4 million websites across SEO, EEAT, AEO, WCAG accessibility, readability, GARM brand safety, and privacy dimensions. Server figures reflect 3,171,372 sites with a detected Server header in the index as of June 2026; pass rates reflect the population graded on each dimension. To analyze your own site across every dimension in this post, visit llmse.ai/classify.