The Cross-Industry Quality Report Card: 16 Sectors Ranked Across Six Quality Dimensions and 3.4 Million Websites
Update — 2026-06-29: This report card has been refreshed against LLMSE's current index of 3.4 million classified URLs (up from 1.5M at first publication) and expanded from four quality dimensions to six, adding AEO (AI-answer optimization) and Privacy. The larger graded population reshuffled the leaderboard: Finance now leads discovery (it was Sports on SEO), Shopping is the runaway trust leader and tops the newly added privacy ranking, and Entertainment builds the most accessible sites (it was Computer & Electronics). The defunct "Marketing & Advertising" category was dropped from the taxonomy. The thesis the original argued — every sector has a blind spot — survives intact, and the two new dimensions sharpen it.
Every published quality benchmark uses the same shortcut: pick 20-30 famous websites, score them, and generalize. Our own early EEAT by Industry post scored 30 sites; our Readability by Industry post covered 27. Curated samples reveal how individual flagship sites perform, but they cannot answer the aggregate question: across an entire industry's web presence — tens of thousands of sites — which sectors actually produce the highest-quality websites, and where does each one fall down?
The conventional intuition is that the sectors with the most money and the most regulatory pressure — finance, health, law — should produce the best websites across the board, and that "quality" is a single axis a site is either good or bad on. Neither holds up. Quality is not one axis; it is at least six, and they are only loosely correlated. A sector can earn the web's highest trust scores while being among its least findable, or build the most accessible pages while writing the least comprehensible prose.
We ranked 16 mainstream industries across six quality dimensions — SEO, AEO, EEAT, WCAG accessibility, readability, and privacy — using aggregate data from LLMSE's index of 3.4 million classified URLs. The sectors range from 18,486 sites (Finance) to over a million (Business & Industry). Every grade comes from LLMSE's automated analysis pipeline applied uniformly across the index, not a hand-picked sample.
The result is a report card with no straight-A student. Every sector that leads one dimension trails on another. Shopping earns the highest trust, readability, and privacy scores on the board — and the worst accessibility. Computer & Electronics, the industry that builds the web, lands dead last on trust, privacy, and AI-answer optimization. The sectors Google scrutinizes most (the "Your Money or Your Life" verticals) do measurably better on discovery, trust, and privacy — and remain the hardest to read.
The Data
The 16 sectors below are LLMSE's mainstream consumer and industry categories, each with at least ~18,000 indexed sites. Pass rates are computed over the population actually graded on each dimension — not every URL carries every grade — so the per-dimension denominators differ.
| Dimension | URLs graded (web-wide) | Web-average pass rate |
|---|---|---|
| SEO | 3,362,226 | 1.9% |
| AEO (AI answers) | 3,337,211 | 1.5% |
| EEAT (trust) | 3,358,095 | 45.4% |
| WCAG (accessibility) | 3,341,134 | 43.8% |
| Readability | 3,341,285 | 32.8% |
| Privacy | 3,335,398 | 37.0% |
Categories are assigned by LLM classification. The 16 featured sectors are a deliberately mainstream slice; a handful of large but structurally atypical buckets (reference/dictionary pages, "sensitive topics," raw internet-infrastructure listings) are excluded because their thin, templated pages distort an industry-quality narrative. Two outliers worth naming sit outside this set: Gambling and Adult lead the entire web on SEO (12.1% and 5.4%), and gambling also leads AEO at 14.2% — covered in depth in The House Always Optimizes. Among the 16 mainstream sectors here, the discovery leader is Finance.
Methodology
This post makes quantitative comparisons across sectors, so the definitions and limits matter.
- Grades and "pass." Each site is graded A-F by a dedicated automated analyzer (there is no E grade). "Pass" means A+B+C for SEO, AEO, EEAT, WCAG, and Privacy, and A+B for Readability (a Flesch Reading Ease score of roughly 50+, ≈ 8th-grade level or below). SEO grades technical fundamentals; AEO grades answer-extractability and AI-citation signals; EEAT grades experience/expertise/authoritativeness/trust signals; WCAG covers automated accessibility checks (~30-40% of WCAG 2.1 Level A — manual testing is required for full conformance); Privacy grades consent gating, policy presence, and tracker behavior.
- Classification basis. Sector membership is by LLM classification; each grade is an independent automated analyzer. Where a check is heuristic (notably WCAG, which is static-HTML only), the coverage caveat above applies.
- Cross-references are computed as set intersections (Redis
ZINTERCARD) between a sector index and each grade index. All counts are aggregate; no individual site is identified. - Known limits. Pass rates are over graded populations, which are smaller than raw sector size. The Readability grade uses Flesch scoring, which is calibrated for English, so it understates readability for sectors with heavy non-English content — treat cross-sector readability as indicative, not exact. Counts are a live snapshot and drift as classification continues. Russian-language sites are excluded from all breakdowns.
- Why these numbers differ from the 2026-03 original. The graded population grew from ~1.5M to ~3.4M URLs. Early grades were biased toward higher-quality, more-visible sites, so most absolute pass rates have fallen a few points as coverage broadened (web EEAT 48.4%→45.4%, WCAG 52.6%→43.8%, readability 35.3%→32.8%). Rankings built on small early samples (some sectors had only a few hundred graded sites) moved the most.
The Scorecard
Pass rates by sector, ordered by indexed site count. The standout (best) cell in each column is bolded.
| Sector | Sites | SEO | AEO | EEAT | WCAG | Read. | Privacy |
|---|---|---|---|---|---|---|---|
| Business & Industry | 1,027,422 | 2.0% | 1.4% | 49.8% | 40.4% | 29.6% | 45.6% |
| Computer & Electronics | 403,424 | 1.0% | 0.6% | 20.3% | 48.9% | 21.5% | 22.8% |
| Entertainment | 228,033 | 1.1% | 1.2% | 51.5% | 57.7% | 31.1% | 43.1% |
| Education | 123,417 | 1.8% | 2.1% | 59.5% | 42.3% | 23.3% | 40.9% |
| Health | 77,354 | 2.8% | 2.2% | 54.7% | 43.1% | 25.5% | 52.7% |
| News & Media | 71,703 | 1.7% | 1.8% | 56.4% | 34.7% | 31.4% | 40.1% |
| Automotive | 67,218 | 2.1% | 1.2% | 63.3% | 36.4% | 38.2% | 41.7% |
| Beauty & Fitness | 47,821 | 2.1% | 2.0% | 66.1% | 35.1% | 47.2% | 50.3% |
| Home & Garden | 44,269 | 1.8% | 1.5% | 49.6% | 38.8% | 37.4% | 47.1% |
| Food & Drink | 43,286 | 2.8% | 1.0% | 65.3% | 39.0% | 45.7% | 48.4% |
| Shopping | 42,113 | 1.0% | 2.8% | 75.4% | 30.6% | 51.6% | 60.6% |
| Sports | 37,391 | 2.5% | 1.9% | 61.4% | 36.6% | 44.1% | 44.2% |
| Travel | 31,869 | 2.4% | 1.5% | 63.2% | 35.6% | 38.5% | 45.3% |
| Real Estate | 20,363 | 1.5% | 1.3% | 61.9% | 36.7% | 33.6% | 37.5% |
| Law & Government | 19,551 | 3.0% | 2.9% | 65.0% | 43.9% | 17.3% | 48.0% |
| Finance | 18,486 | 3.9% | 4.5% | 61.1% | 41.6% | 39.2% | 49.1% |
| Web average | 3.4M | 1.9% | 1.5% | 45.4% | 43.8% | 32.8% | 37.0% |
The Superlatives
| Dimension | Best sector | Rate | Worst sector | Rate |
|---|---|---|---|---|
| SEO | Finance | 3.9% | Computer & Electronics / Shopping | 1.0% |
| AEO | Finance | 4.5% | Computer & Electronics | 0.6% |
| EEAT | Shopping | 75.4% | Computer & Electronics | 20.3% |
| WCAG | Entertainment | 57.7% | Shopping | 30.6% |
| Readability | Shopping | 51.6% | Law & Government | 17.3% |
| Privacy | Shopping | 60.6% | Computer & Electronics | 22.8% |
Two names dominate the extremes: Shopping wins three of six dimensions, and Computer & Electronics loses three. Shopping leads trust, readability, and privacy; Computer & Electronics trails on trust, AI-answer optimization, and privacy. No sector leads more than three dimensions, and the discovery axes (SEO and AEO) belong to Finance among the mainstream set. The rest of this report card is the story of those gaps.
Discovery: Finance Leads, the Builders Lag
Among the 16 mainstream sectors, Finance leads both discovery dimensions — SEO at 3.9% and AEO at 4.5% — roughly double the web average on each. Financial content competes for some of the most valuable queries on the web (rates, loans, investing, banking), where ranking and being cited convert directly to revenue, so the incentive to invest in crawlable, well-structured, citation-rich pages is unusually strong. Law & Government (3.0% SEO, 2.9% AEO) follows, consistent with the same logic: search visibility there translates into public access rather than revenue, but the pressure to be found is real.
Computer & Electronics is worst on both — 1.0% SEO and just 0.6% AEO, a third of the web's AEO rate. The pattern is consistent across the discovery and trust axes for this sector: developer blogs, project pages, forums, and documentation are written for humans who arrive via links and search-by-error-message, not optimized for answer engines or marked up with the schema that AEO rewards. The sector that builds the web's plumbing is the worst at making its own content findable by the next generation of search. (The AEO disconnect is explored across all sectors in The AI Citation Readiness Gap.)
It is worth restating the scale here: even Finance's category-leading 4.5% AEO is dwarfed by gambling's 14.2%. Discovery optimization on the mainstream web is, in absolute terms, rare everywhere.
Trust: Shopping Leads, Technology Trails
Shopping has the highest EEAT pass rate at 75.4% — well clear of second-place Beauty & Fitness (66.1%) and 1.7x the web average. E-commerce has spent two decades building the exact signals EEAT measures: business identity, contact and returns information, reviews, shipping and payment transparency. Trust is a conversion lever, and it shows.
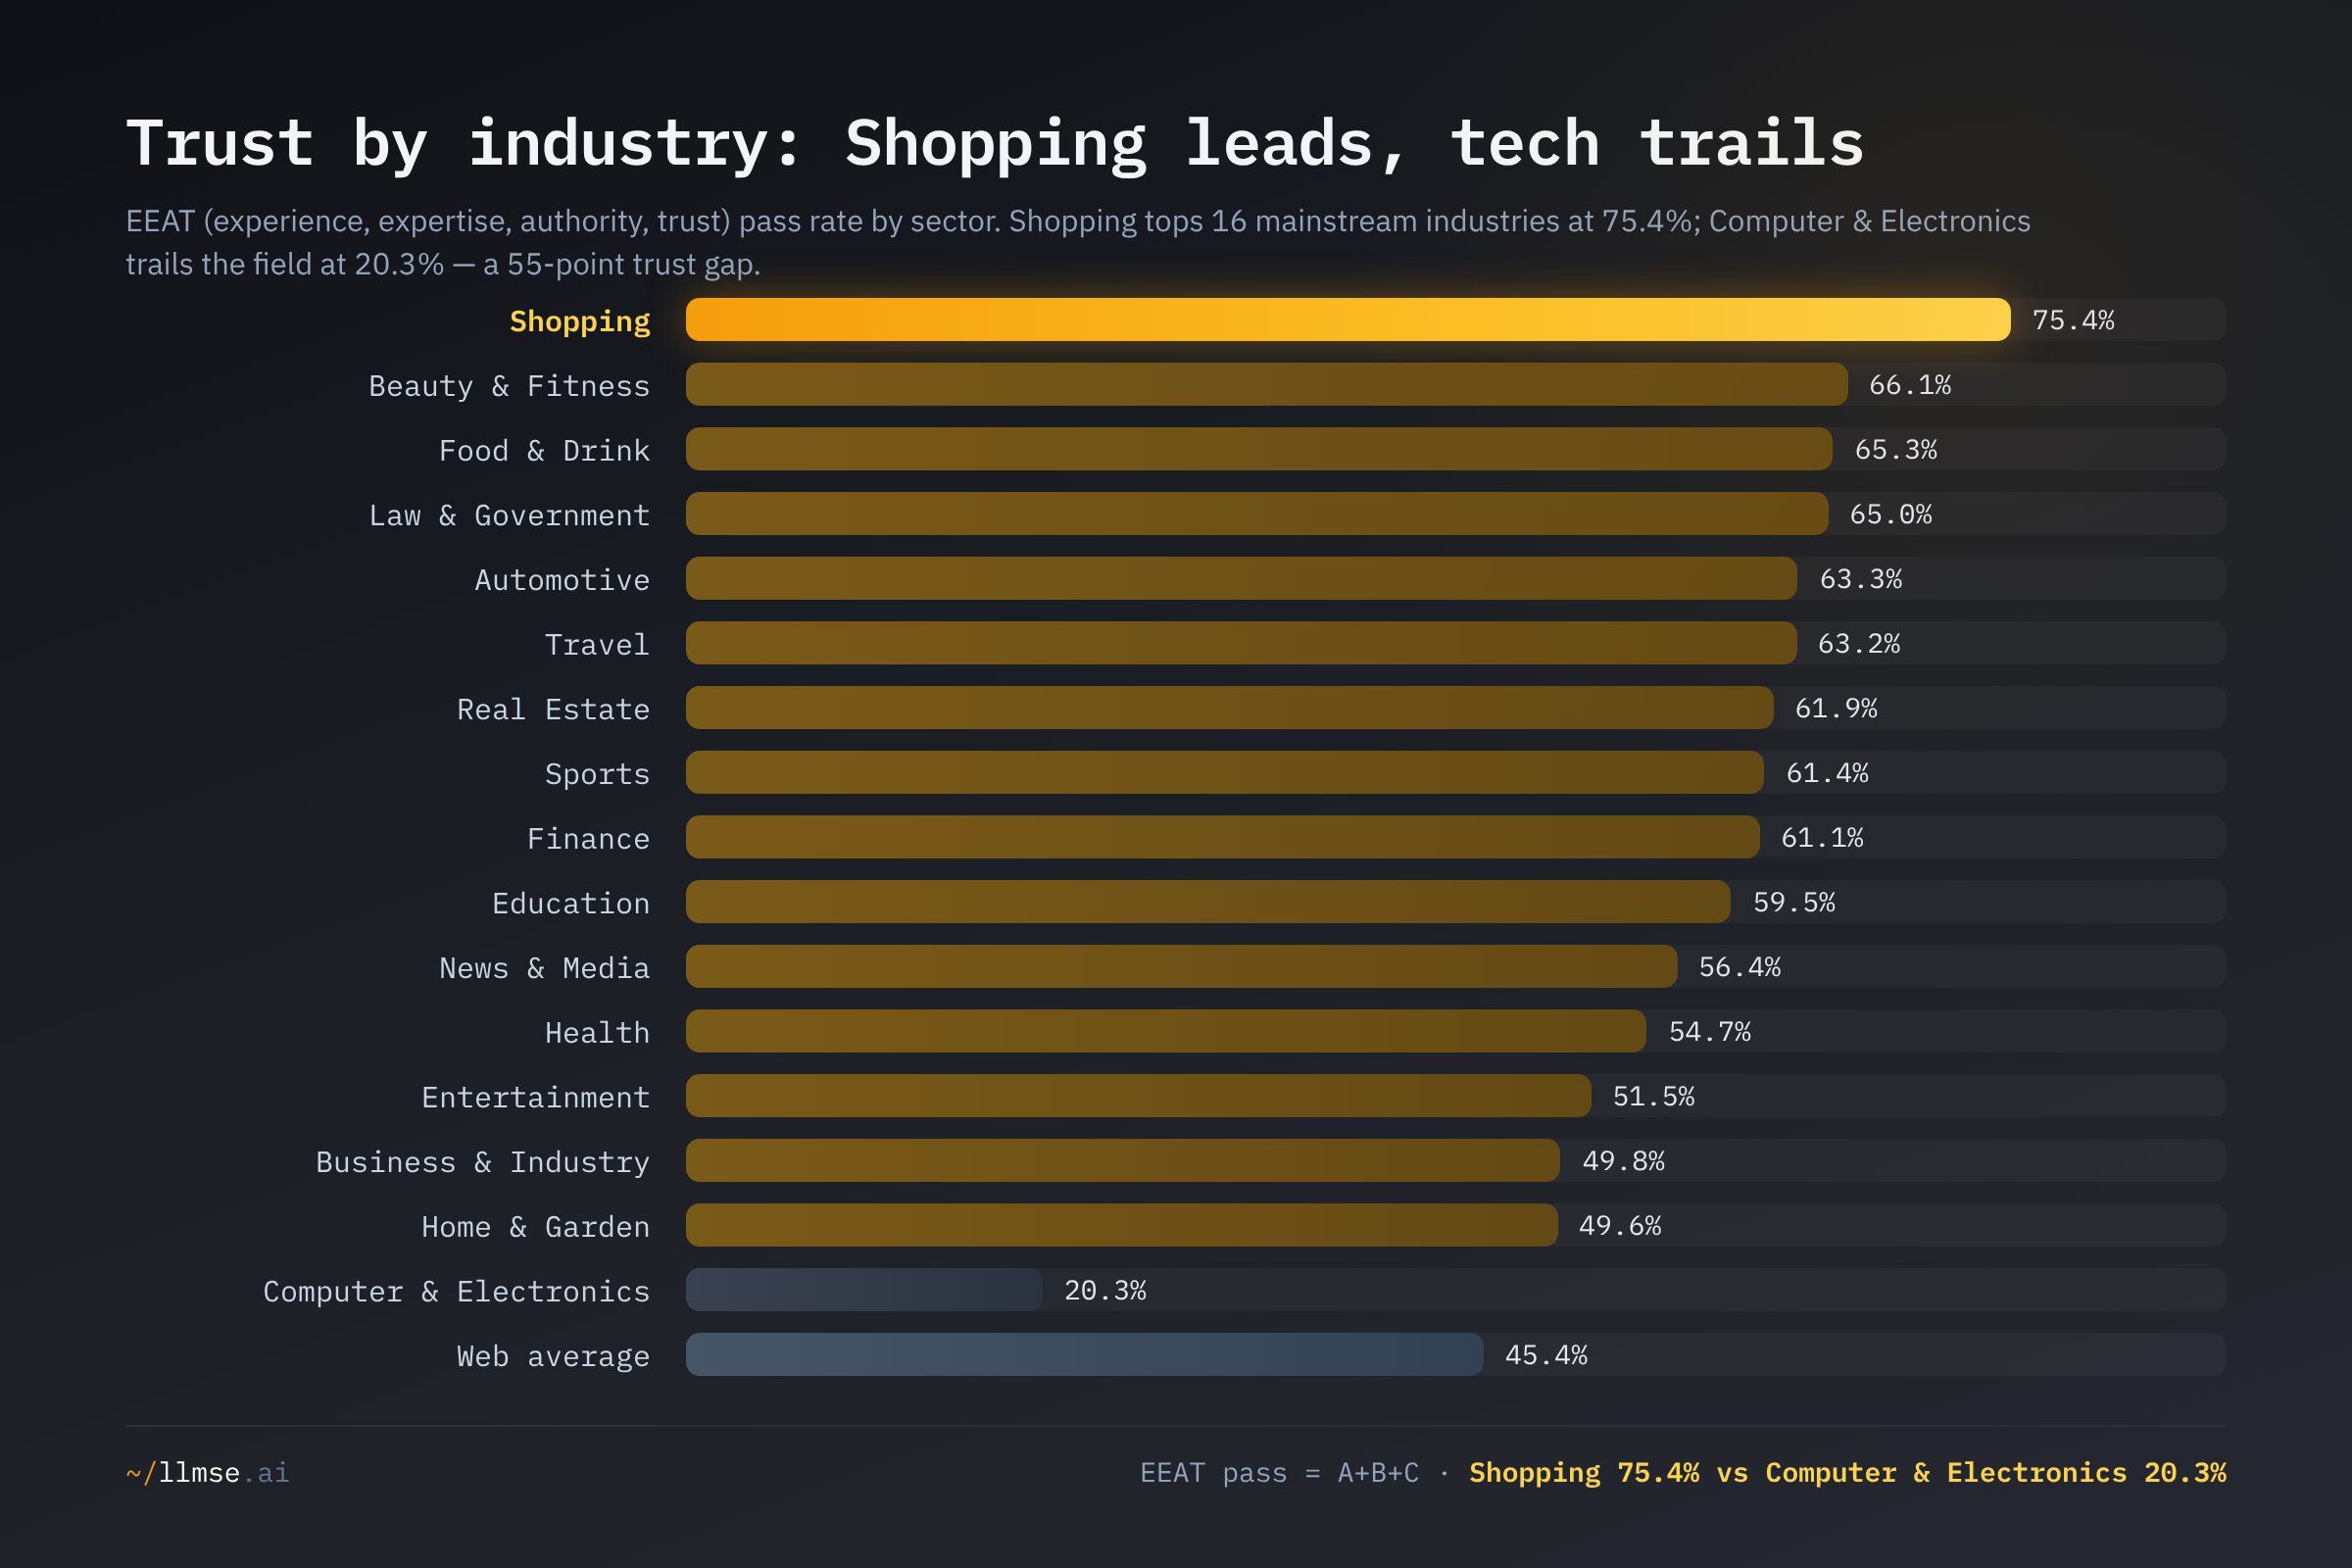
Computer & Electronics has the worst EEAT at 20.3% — less than half the web average and a 55-point gap behind Shopping. This is the same paradox the original report card flagged, now wider: the people building the web are worst at demonstrating who they are and why they should be trusted. Anonymous authorship, missing organizational schema, and minimal editorial transparency depress the score. Technical competence and credibility are independent skills, and this sector has invested in only one.
Accessibility: Entertainment Builds Accessible Pages, Shopping Doesn't
Entertainment now leads WCAG accessibility at 57.7% — the new top of the board, displacing Computer & Electronics (which fell to 48.9% as its graded sample expanded). Large streaming, media, and gaming platforms are built by teams with mature front-end practices: semantic structure, alt text, and ARIA usage that clear LLMSE's static checks. Computer & Electronics remains above the web average (48.9% vs 43.8%), so the "builders make accessible sites" finding survives — it is just no longer the leader.
Shopping is worst on accessibility at 30.6% — the only featured sector below a third, and a sharp reversal from its dominance elsewhere. Image-heavy product grids, carousels, custom add-to-cart widgets, and interactive filters are exactly the patterns that fail automated accessibility checks. The sector that earns the most trust and writes the most clearly builds some of the least navigable pages for assistive technology.
Readability: Shopping Writes Plainly, Government Doesn't
Shopping leads readability at 51.6% — the only sector where a majority of content reads at roughly an 8th-grade level or below. Product copy, pricing, and checkout flows reward clarity; dense prose loses sales.
Law & Government is worst at 17.3% — barely a third of Shopping's rate, and the same finding the original reported (19.2% then). Legal, regulatory, and bureaucratic prose makes government the hardest-to-read corner of the web, despite Law & Government posting one of the better WCAG rates (43.9%). The page is technically navigable; the sentences are not comprehensible. The U.S. Plain Writing Act of 2010 exists precisely to close this gap, and 16 years on, the aggregate data shows it has not. Health (25.5%) shares the affliction: clinical terminology and risk language produce content patients struggle to parse.
Privacy: A New Axis, the Same Winner and Loser
Privacy is one of the two dimensions added since the original. It tracks consent gating, the presence of privacy and cookie policies, and tracker discipline.
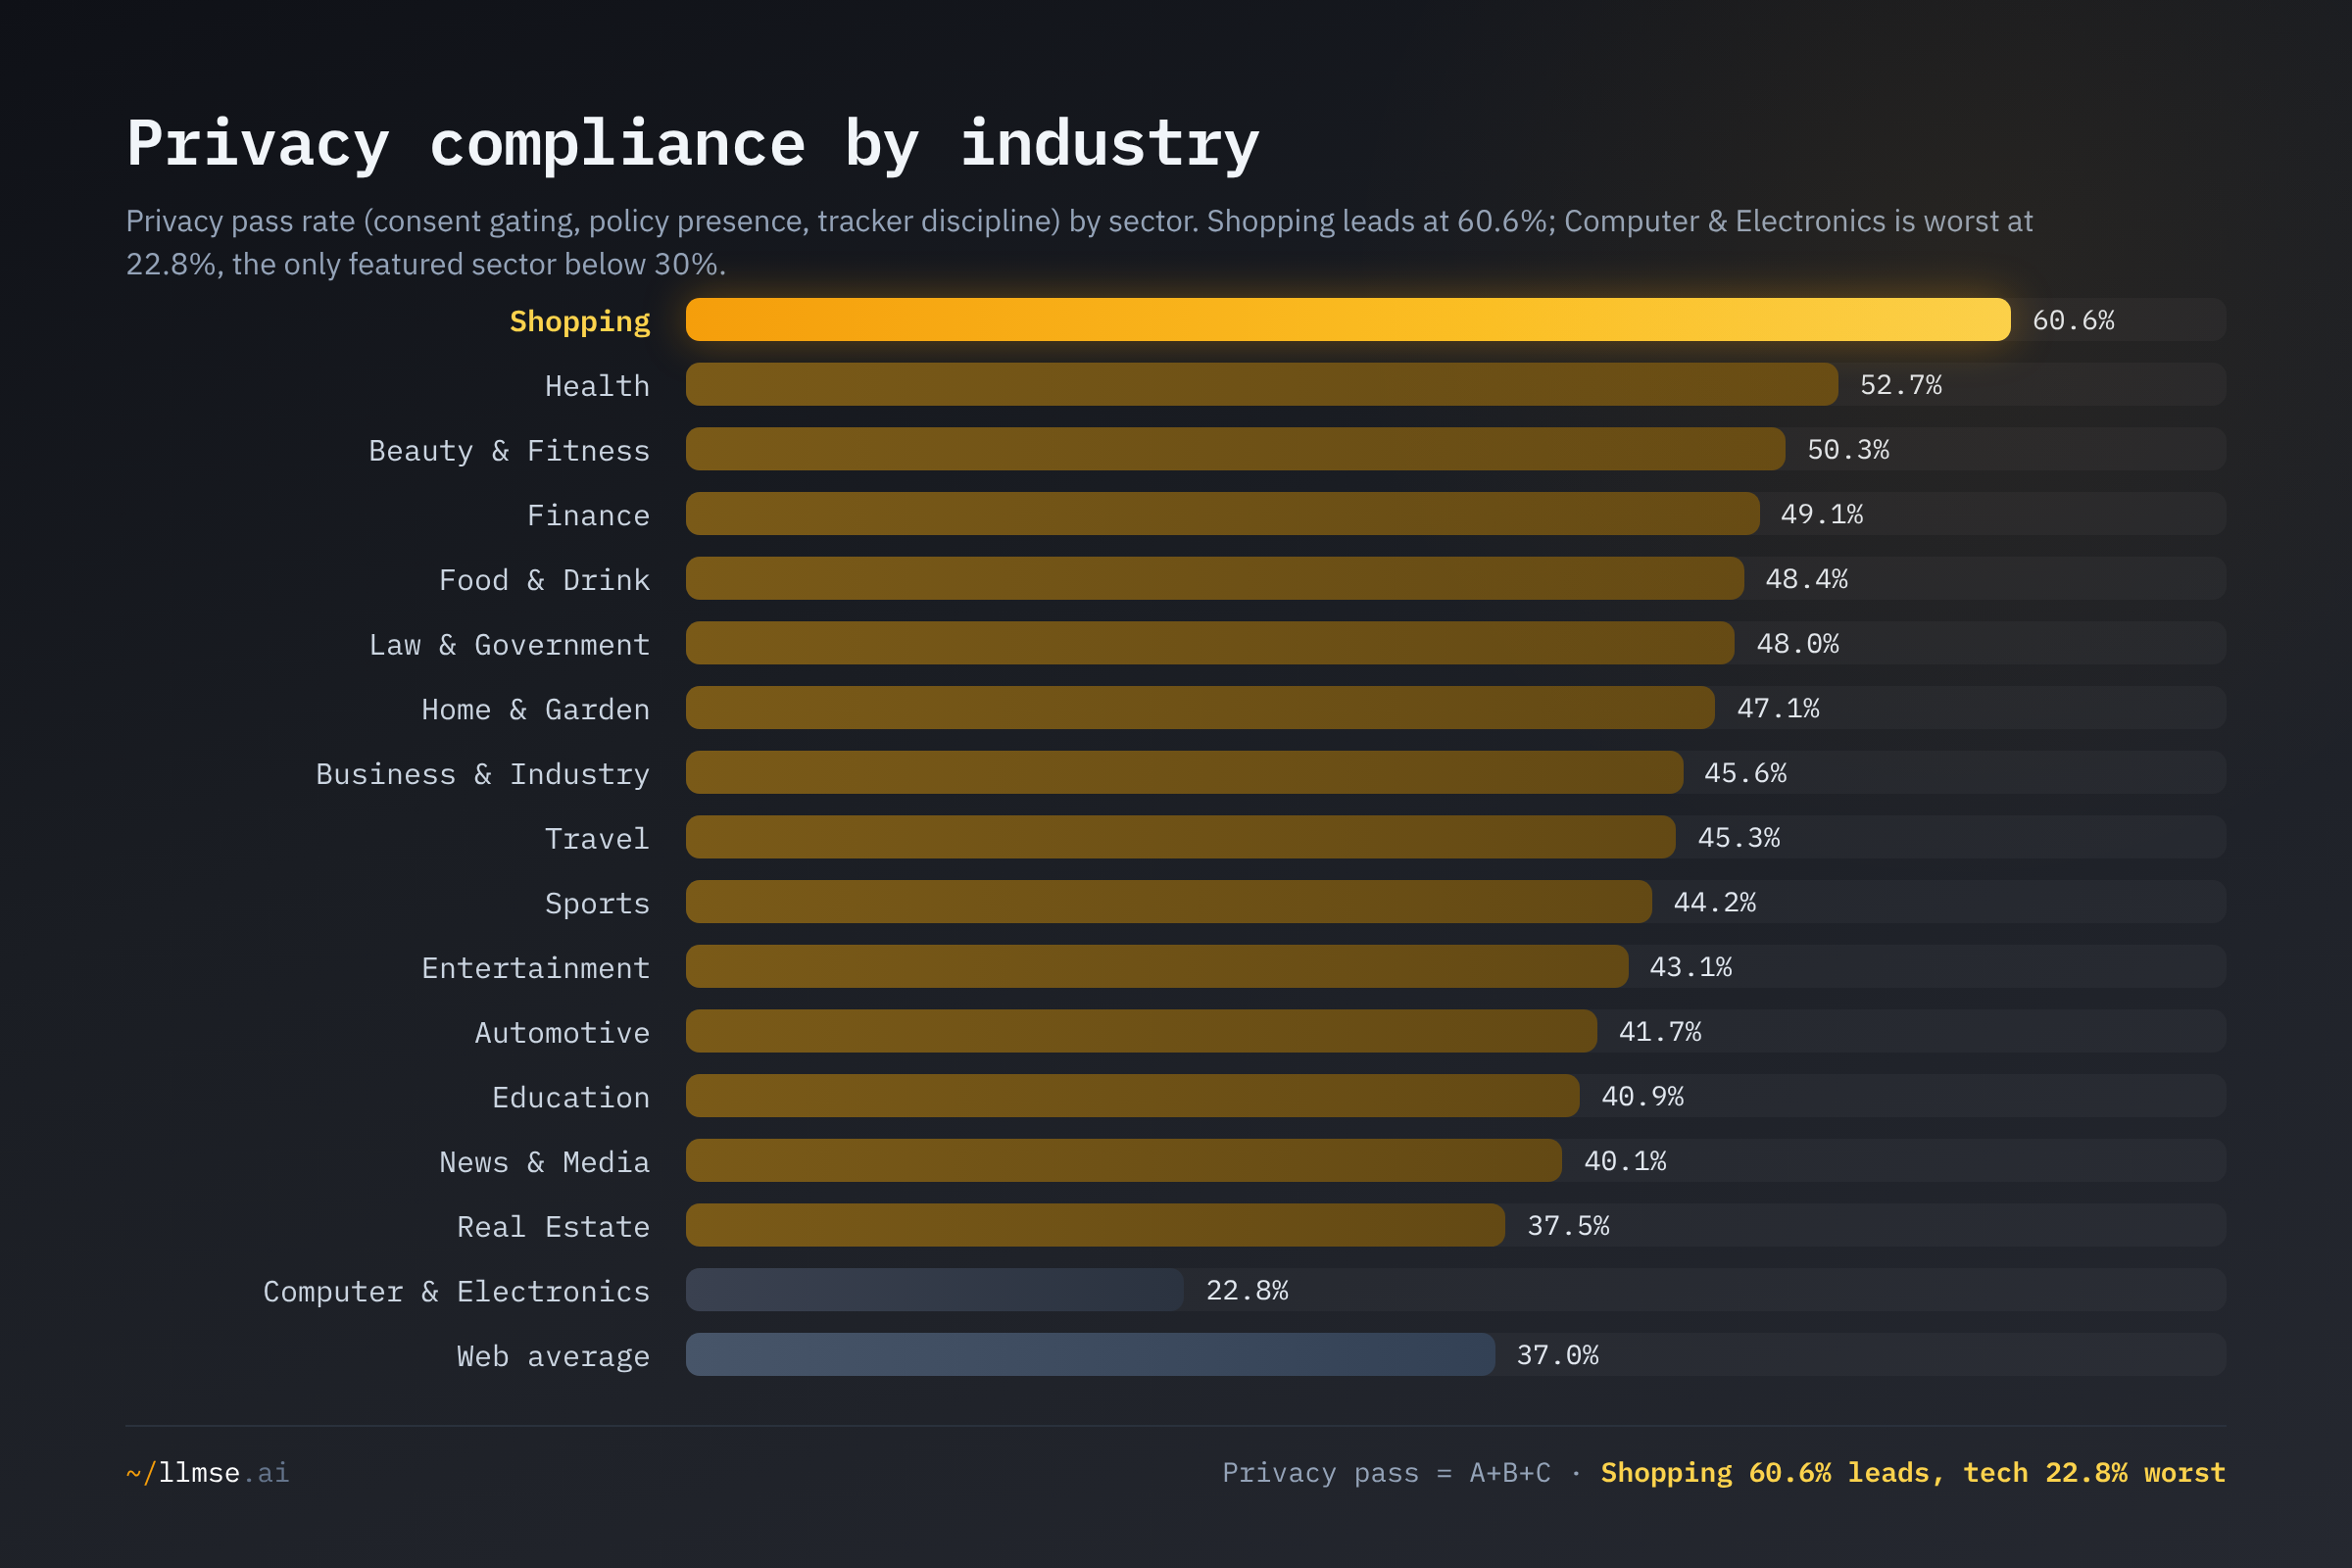
Shopping leads privacy at 60.6% and Computer & Electronics is worst at 22.8% — the same pair that bracket the EEAT ranking. Sectors that handle payments and customer accounts (Shopping, Health 52.7%, Finance 49.1%, Beauty & Fitness 50.3%) cluster at the top: consent banners and policies are table stakes when you process personal and payment data. Computer & Electronics, full of documentation and project pages that collect little and disclose less, sits 14 points below the web average. Where a sector handles sensitive user data, it tends to invest in the visible privacy signals; where it doesn't, it doesn't bother — which is a plausible explanation, not a proven mechanism.
The Paradoxes
The most revealing patterns are the gaps between dimensions inside a single sector. Three stand out.
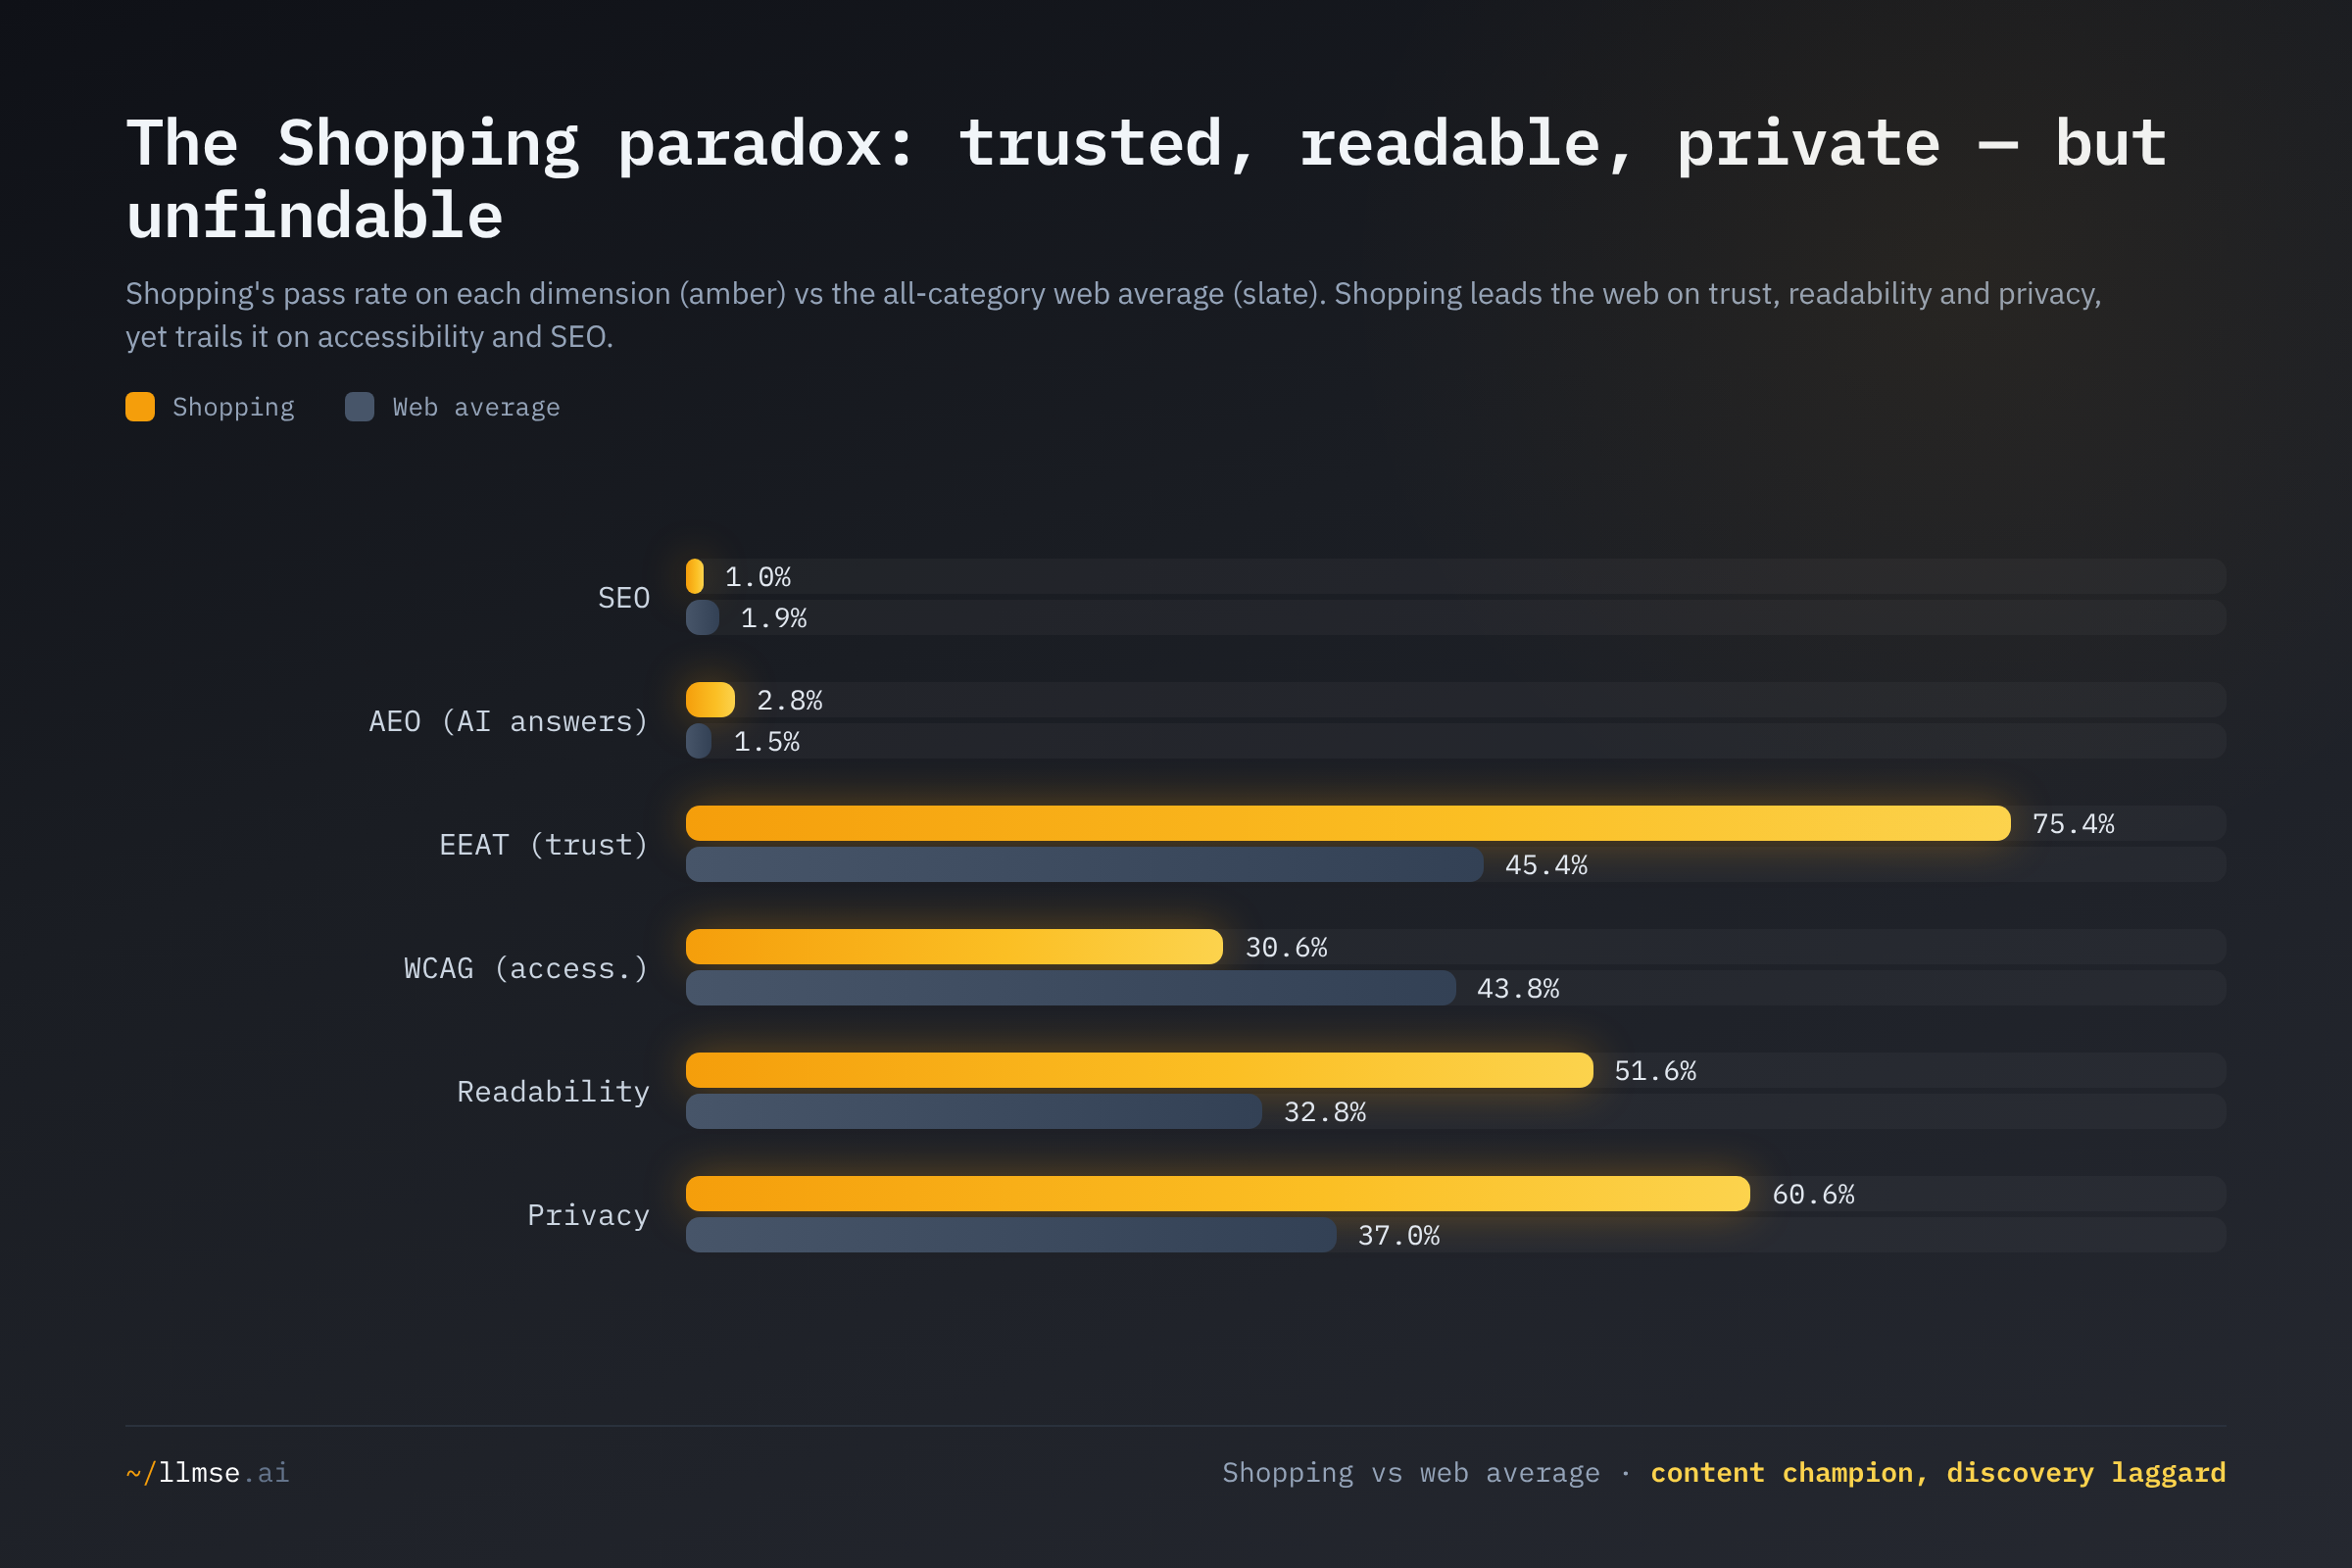
Shopping: the content champion that can't be found or navigated. Shopping tops trust (75.4%), readability (51.6%), and privacy (60.6%) — yet sits below the web average on both accessibility (30.6% vs 43.8%) and SEO (1.0% vs 1.9%). E-commerce has perfected the signals that close a sale to a sighted human arriving with intent, and neglected the ones that help a screen-reader user or a search crawler. The 45-point gap between its best dimension (EEAT) and its worst (WCAG) is the widest single-sector spread on the board.
Computer & Electronics: accessible but untrustworthy and private to a fault. Above the web average on accessibility (48.9%), worst or near-worst on EEAT (20.3%), AEO (0.6%), and privacy (22.8%). The builders make navigable pages and then strip out everything that signals identity, credibility, or data stewardship.
Law & Government: navigable and authoritative, but incomprehensible. High EEAT (65.0%) and decent WCAG (43.9%), bottom-of-the-board readability (17.3%). A citizen can load and navigate the page; neither they nor anyone else can easily understand it.
These gaps are the core finding: quality is multi-dimensional, and the dimensions trade off. No sector in the data is uniformly good.
The YMYL Question
Google's Quality Rater Guidelines single out YMYL — "Your Money or Your Life" content (health, finance, legal) for heightened scrutiny. Do those sectors actually clear a higher bar? Pooling Health, Finance, and Law & Government against the other 13 featured sectors:
| Group | Sites graded (EEAT) | SEO | AEO | EEAT | WCAG | Read. | Privacy |
|---|---|---|---|---|---|---|---|
| YMYL (Health + Finance + Law) | 114,035 | 3.0% | 2.7% | 57.4% | 43.0% | 26.3% | 51.3% |
| Non-YMYL (other 13) | 2,169,423 | 1.7% | 1.3% | 47.3% | 43.0% | 29.9% | 41.0% |
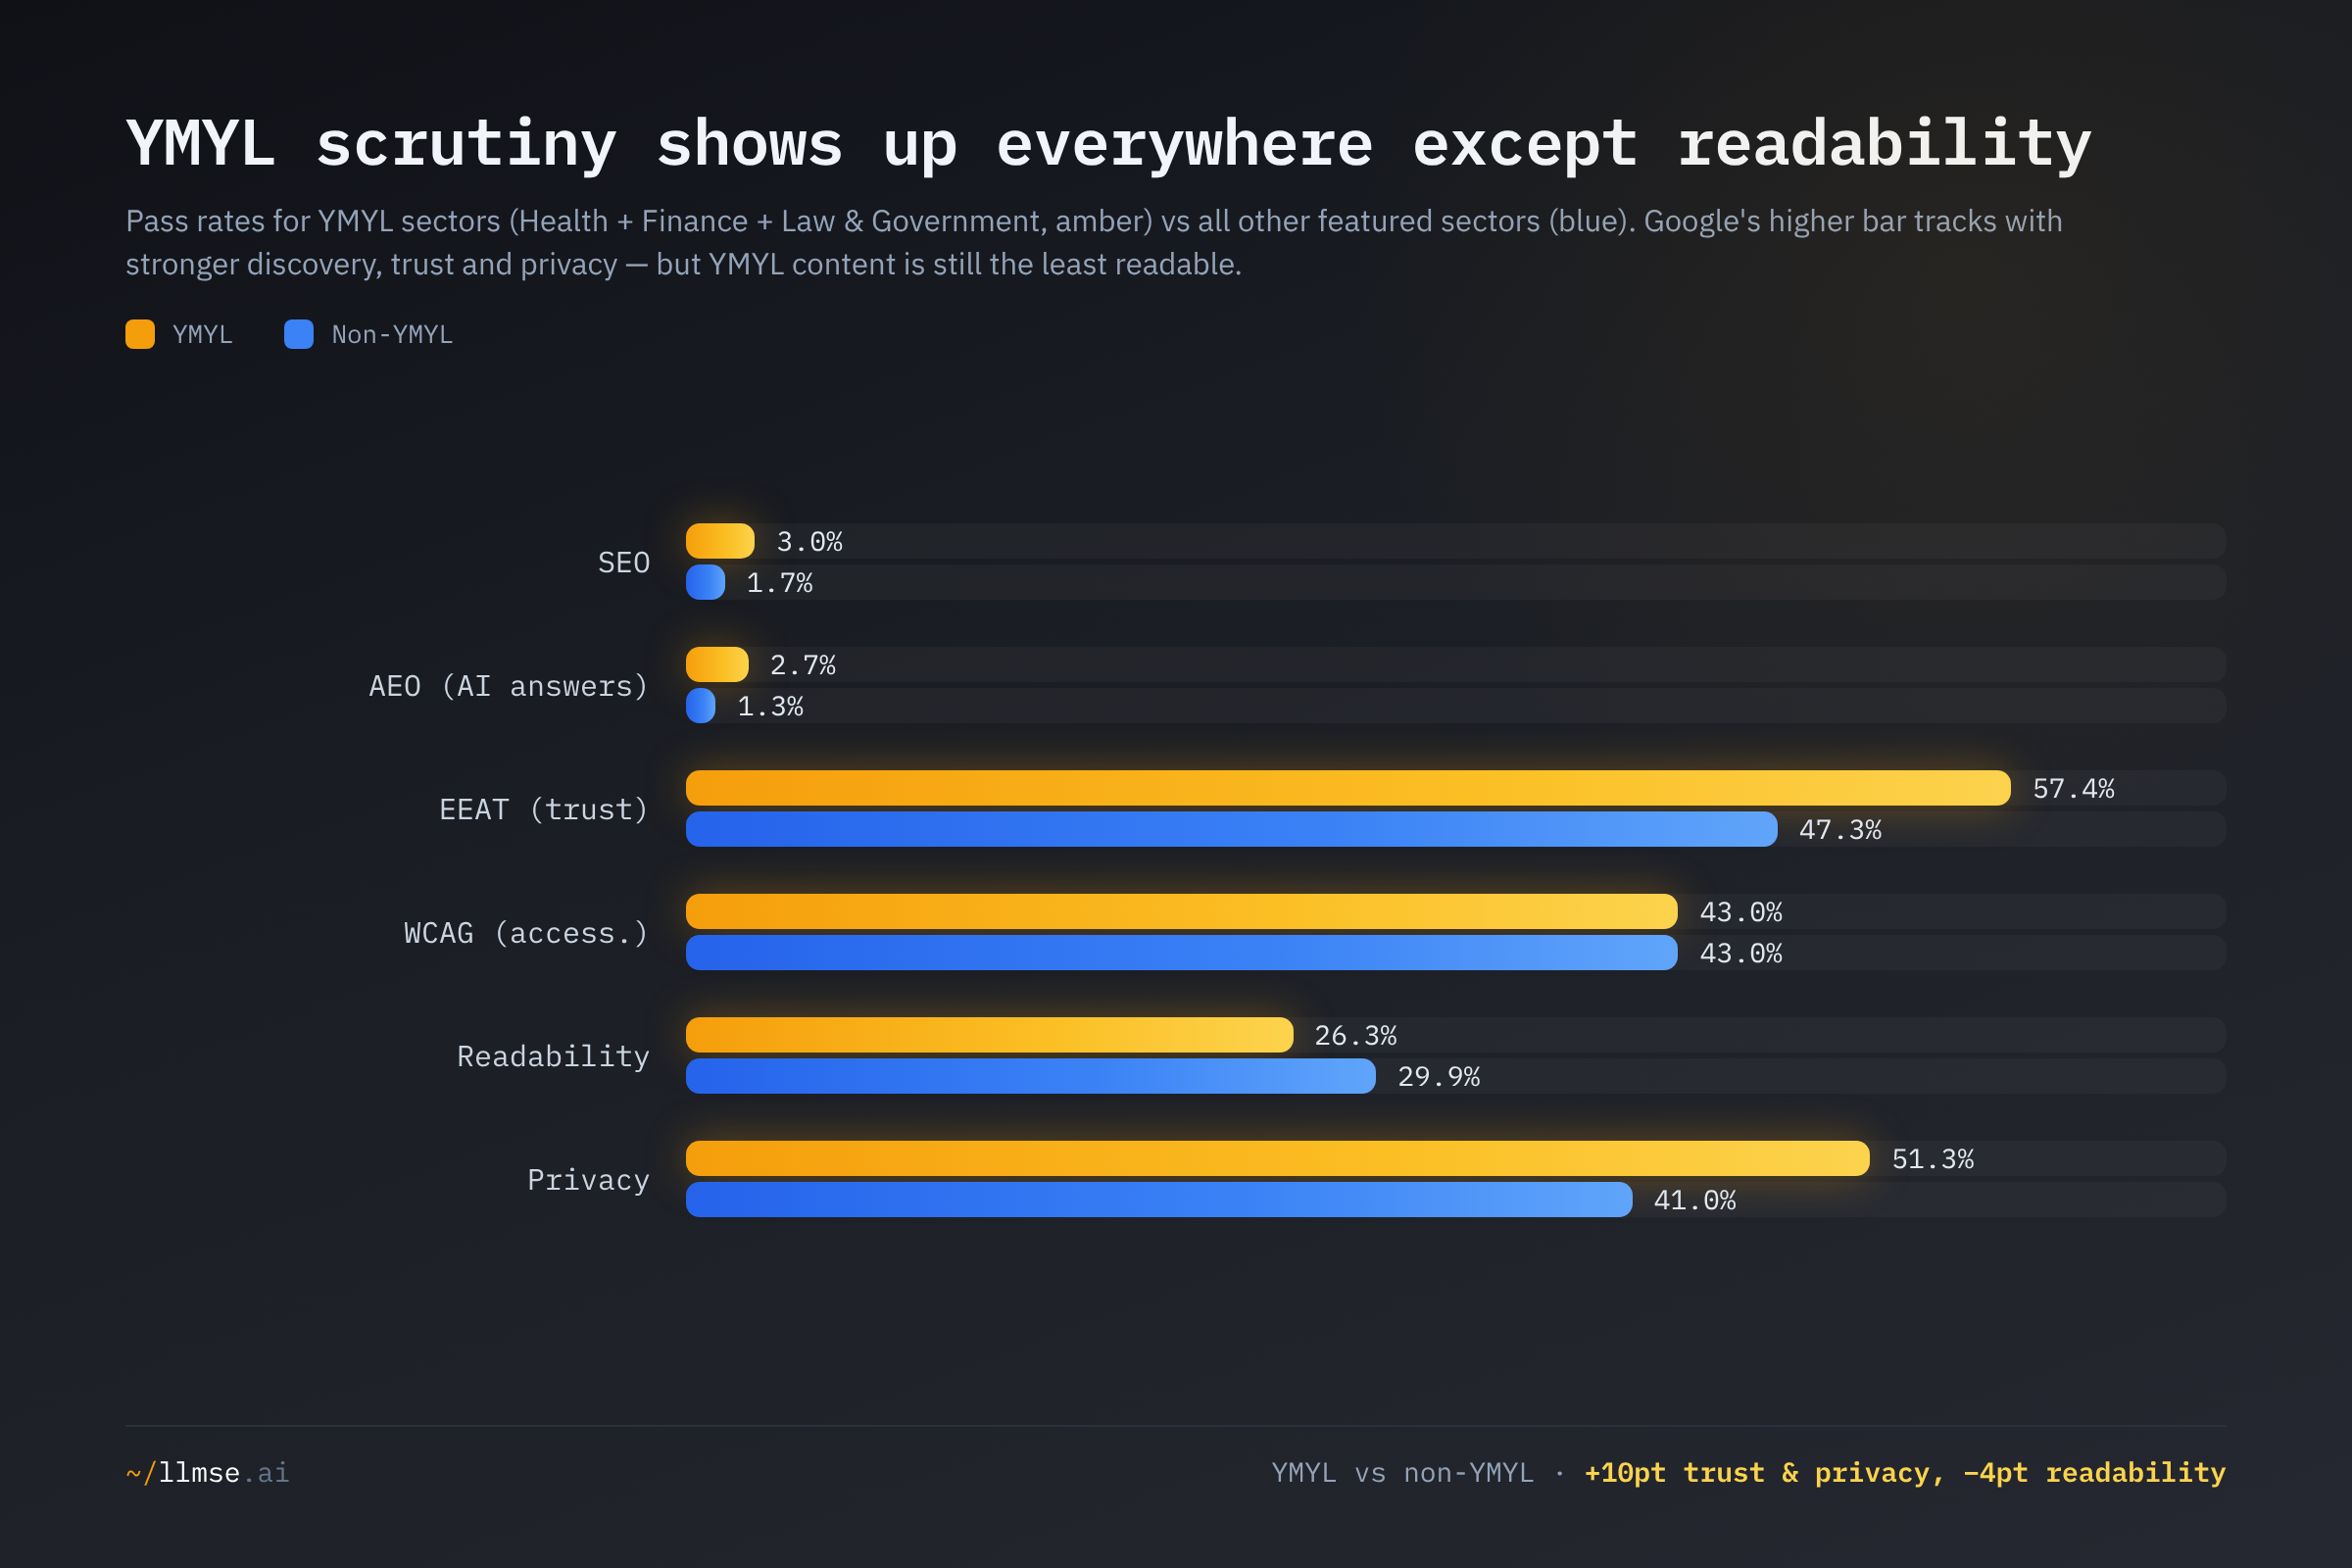
YMYL sectors outperform on discovery, trust, and privacy — and on nothing else. They beat the non-YMYL field on SEO (+1.3pp), AEO (+1.4pp), EEAT (+10.1pp), and privacy (+10.3pp), tie exactly on accessibility (43.0% vs 43.0%), and — the durable exception — score worse on readability (26.3% vs 29.9%). Google's higher bar correlates with the signals search and trust reward; it does nothing for plain language, because no engine rewards plain language directly. This is consistent with the original's finding, now extended: the pattern holds on the two new axes (YMYL leads AEO and privacy too), and the readability deficit persists.
What's at Stake
- Discoverability is a near-universal failure, and AI answers will inherit it. Across mainstream sectors, AEO pass rates top out at Finance's 4.5%. As AI answer engines replace blue links for more queries, sectors that haven't built extractable, citation-rich content will lose visibility they cannot easily buy back — and the vacuum will be filled by the verticals (gambling, affiliate content) that have optimized.
- Trust and accessibility are decoupled. Shopping and Computer & Electronics prove a site can be highly trusted and barely accessible, or accessible and barely trustworthy. Users who rely on assistive technology are systematically underserved by the sectors they most need (commerce), and users seeking credibility are underserved by the sector that runs the internet.
- Privacy maps to data sensitivity, not to capability. The sectors handling the most personal and payment data score highest on privacy signals; the ones handling little score lowest. That is reassuring at the top and a latent compliance gap at the bottom — low-privacy sectors that quietly add forms or analytics inherit obligations their sites aren't built to meet.
- The readability gap is a public-interest problem. The sectors where comprehension matters most — health, law, finance — are the least readable. With 54% of U.S. adults reading below a 6th-grade level — well below the level YMYL content is typically written at — the highest-stakes information on the web reaches the fewest people who need it.
What Would Help
- Site owners: audit the dimension you're blind to, not the one you lead. This report card's lesson is that strength on one axis predicts nothing about the others. A trusted commerce site is probably failing accessibility; an accessible tech site is probably failing trust and privacy. Run a full multi-dimension check at llmse.ai/classify rather than assuming a strong sector reputation covers you.
- E-commerce and content teams: fix accessibility before it becomes liability. Shopping's 30.6% WCAG pass rate is the board's worst, and accessibility is increasingly a legal exposure, not just a courtesy. Semantic structure, alt text, and keyboard-navigable controls are the cheapest wins relative to the risk.
- Developers and technology publishers: add the credibility layer. Computer & Electronics fails trust (20.3%), AI-answer optimization (0.6%), and privacy (22.8%) together. Author attribution, organizational schema, and basic consent/policy hygiene would move all three at once — and would make technical content far more likely to be cited by AI answer engines.
- YMYL publishers: treat readability as a ranking-independent obligation. Health, finance, and legal content is found and trusted but not understood. Plain-language editing is the one quality investment search won't reward for you — and the one your users need most.
- AI platforms: weight provenance, not just extractability. Because mainstream-sector AEO is uniformly low while gambling and affiliate verticals are high, naive retrieval will over-surface the optimized fringe. Prefer authoritative, AEO-ready sources within YMYL topics rather than whatever is best formatted.
This analysis was conducted using LLMSE, which has classified over 3.4 million websites across SEO, EEAT, AEO, WCAG accessibility, readability, GARM brand safety, and privacy dimensions. Sector pass rates reflect the populations graded on each dimension as of June 2026. To analyze your own site across every dimension in this report card, visit llmse.ai/classify.