E-E-A-T Scores by Industry: Why 47% of the Web Is Stuck at a D
Update — 2026-06-29: Rebuilt against LLMSE's current index of 3,358,196 EEAT-graded URLs (up from ~584K at first publication) and converted from a hand-picked 30-site sample to a full-index aggregate. The original's curated leaderboard (Coursera, Amazon, Booking.com and the rest), its four-pillar averages (Experience / Expertise / Authoritativeness / Trust), and its per-site trust-signal frequency tables are dropped — none are reproducible from the aggregate grade index, which stores a single composite EEAT grade per URL rather than pillar-level scores. The refreshed picture: under the project's standard pass definition (A+B+C) 45.4% of the web passes EEAT, but the stricter A+B share has slipped from 25.1% to 21.5% as coverage broadened, and grade D is now the single largest band at 47.3%. The thesis is reframed accordingly: the story is no longer "trust is the weak pillar" (not measurable from this data) but "the web piles up at a mediocre D, and which industry a site belongs to moves its odds more than anything else."**
The conventional read of E-E-A-T is that the web is full of failing, untrustworthy content. The aggregate data says something more mundane and more damning: the web doesn't fail trust, it half-passes it. Across 3.36 million graded sites, only 7.3% earn an F. The dominant outcome — nearly half of everything — is a D.
E-E-A-T — Experience, Expertise, Authoritativeness, and Trust — is the lens Google's Search Quality Rater Guidelines use to judge page quality, and Google is explicit that within it, "trust is most important. The others contribute to trust, but content doesn't necessarily have to demonstrate all of them." It is also increasingly how AI answer engines decide which sources to cite. The usual way to measure it is to pick 20-30 famous websites and generalize — our own first version of this post scored exactly 30. Flagship brands clear the bar comfortably, which tells you almost nothing about the aggregate. Famous sites are not the web.
So instead of a curated sample, we cross-referenced LLMSE's EEAT grade index — a single composite A-F grade per URL, produced by the same automated analyzer applied across the index — against its content-category index for 3,358,196 graded URLs, using set intersections. The question is not how the New York Times scores; it is which industries produce sites that demonstrate trust, and where the web quietly piles up.
Grade D is the single largest band at 47.3%, and only 45.4% of the web clears a passing A-B-C. Shopping leads every consumer industry with a 75.4% EEAT pass rate, while Computer & Electronics — the sector that literally builds the web — trails them all at 20.3%, with 77% of its sites stuck at exactly one grade: D. That 55-point spread between the best and worst mainstream sector is the real E-E-A-T story, and it is invisible to any 30-site benchmark.
The Data
E-E-A-T grade distribution across every URL graded on the dimension:
| EEAT grade | Sites | Share |
|---|---|---|
| A (90-100) | 184,601 | 5.5% |
| B (80-89) | 537,840 | 16.0% |
| C (70-79) | 801,327 | 23.9% |
| D (60-69) | 1,589,332 | 47.3% |
| F (0-59) | 245,096 | 7.3% |
| Total graded | 3,358,196 | 100% |
Pass rates are computed over the population actually graded on EEAT — not every URL in the index carries every grade. Under the project's standard definition, pass = A+B+C = 45.4%. The stricter "good" tier, A+B, is 21.5%, and the elite A band — sites that demonstrate trust comprehensively — is just 5.5%. The distribution is the headline: failure (F) is rare, excellence (A) is rarer, and the overwhelming center of gravity is a weak-but-present D. Russian-language sites are excluded from every figure in this post.
Methodology
This post makes quantitative claims, so the definitions and limits matter.
- Grades and "pass." Each site is graded A-F by a dedicated automated analyzer (there is no E grade). For EEAT, pass = A+B+C; the stricter A+B "good" tier and the A-only "elite" share are reported separately where relevant. The EEAT grade scores experience, expertise, authoritativeness, and trust signals — author and organizational identity, editorial transparency, contact and policy presence, and citation behavior — and folds them into a single composite grade.
- Composite, not pillar-level. The index retains one EEAT grade per URL, not the four underlying pillar scores. The original post's pillar averages (Experience 97.1, Trust 74.4, and so on) came from a 30-site live analysis and cannot be reproduced from the aggregate index, so they are dropped; we report grade-band distributions instead.
- Classification basis. Category membership is assigned by LLM classification; the EEAT grade is an independent automated analyzer. Both are heuristic and carry error.
- Cross-references are computed as set intersections (Redis
ZINTERCARD) between the EEAT grade indices (eeat-A…eeat-F) and a category or subcategory index. Subcategory keys areCategory_Subcategory. All counts are aggregate; no individual site is identified. - Known limits. Pass rates are over graded populations, which are smaller than raw category size. Grading favors representative/homepage content, so sites that render primarily via client-side JavaScript may be under-credited. Segments below ~10,000 graded sites are flagged. Counts are a live snapshot and drift as classification continues.
- Why these numbers differ from the 2026-02 original (and the methodology change). The graded population grew from ~584,000 URLs to ~3.36M, and the analysis converted from a curated 30-site sample to a full-index aggregate. Early grades skewed toward higher-quality, more-visible sites, so the strict A+B share fell from 25.1% to 21.5% as coverage broadened (the A band actually rose, 3.6%→5.5%, while B compressed, 21.5%→16.0%). The D band held its place as the largest single band (46.9%→47.3%). Curated artifacts — the 30-site leaderboard, pillar averages, and signal-frequency tables — are not carried forward because they are not reproducible from aggregate data.
The Scorecard
EEAT pass rate (A+B+C) by content category, for the categories with at least 10,000 graded sites. The leaders, the web baseline, and the laggards:
| Category | Sites graded | EEAT pass (A+B+C) |
|---|---|---|
| Shopping | 41,256 | 75.4% |
| Productivity | 10,426 | 69.2% |
| Beauty & Fitness | 47,251 | 66.1% |
| Food & Drink | 42,881 | 65.3% |
| Law & Government | 19,272 | 65.0% |
| Automotive | 66,442 | 63.3% |
| Travel | 31,527 | 63.2% |
| Real Estate | 20,157 | 61.9% |
| Finance | 18,152 | 61.1% |
| Education | 121,775 | 59.5% |
| News & Media | 70,778 | 56.4% |
| Health | 76,616 | 54.7% |
| Entertainment | 225,145 | 51.5% |
| Business & Industry | 1,022,041 | 49.8% |
| Web average | 3,358,196 | 45.4% |
| Internet & Telecom | 71,700 | 32.9% |
| Computer & Electronics | 399,585 | 20.3% |
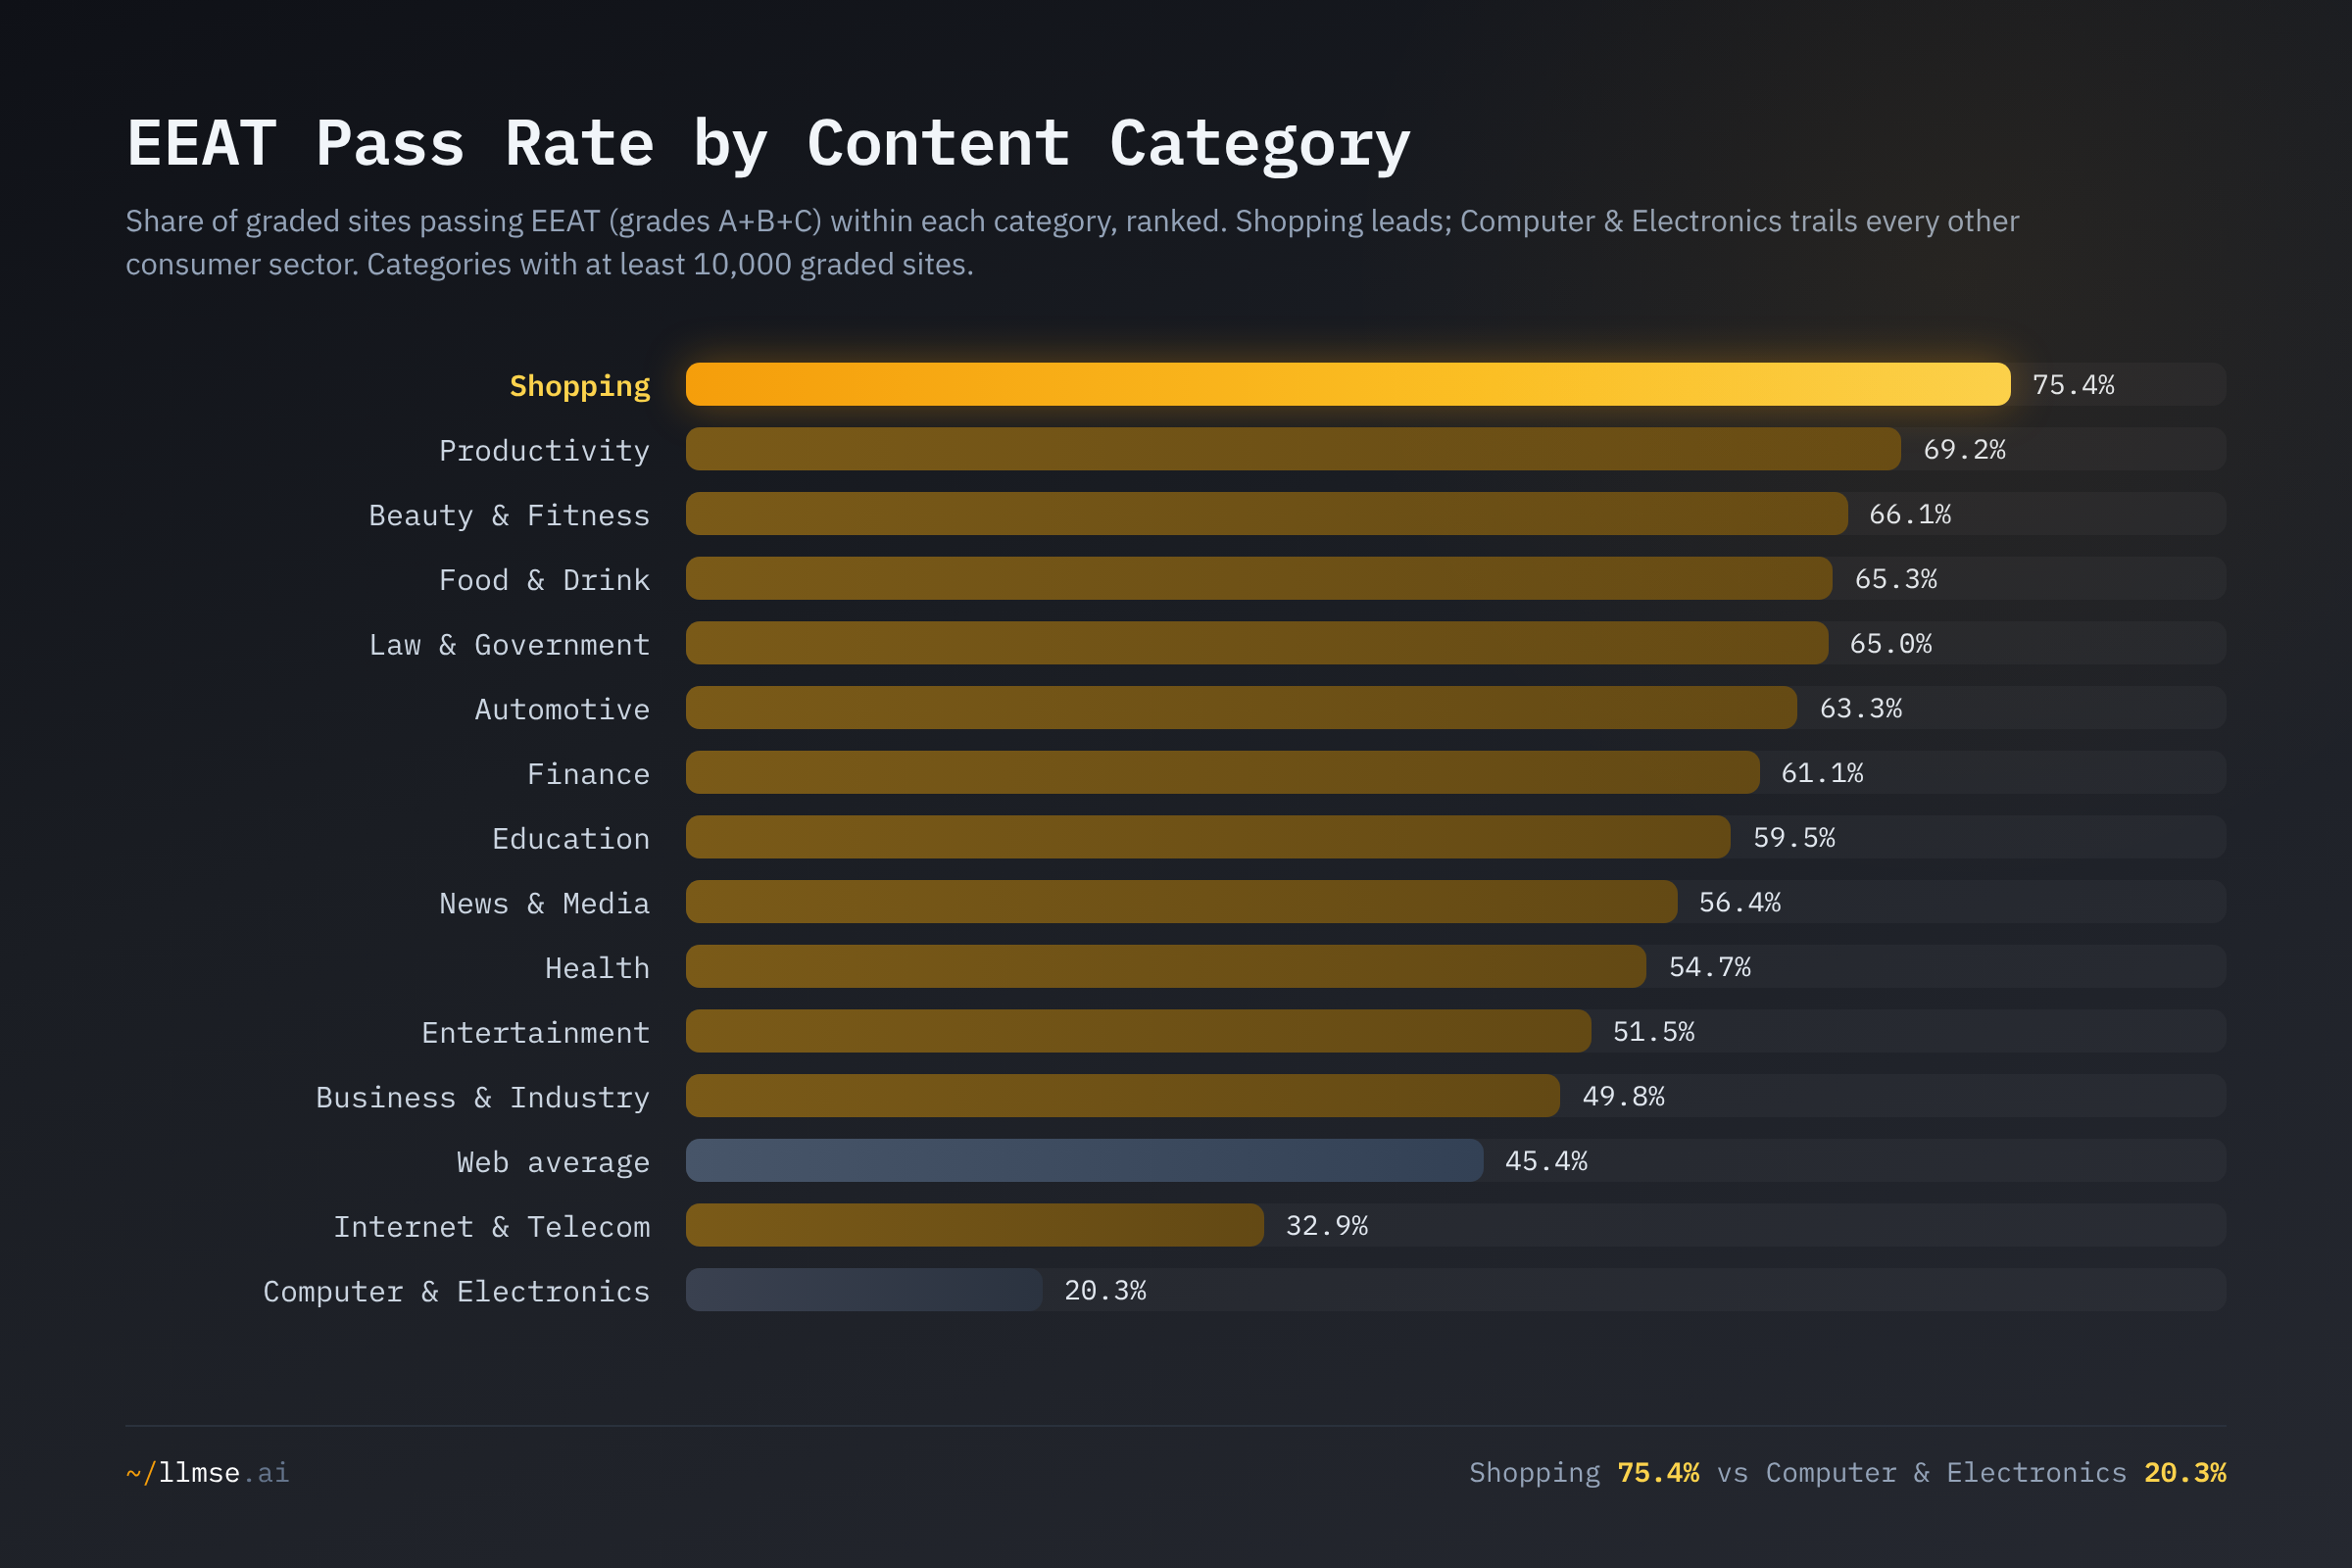
Shopping tops the board at 75.4%, and Computer & Electronics is the worst mainstream sector at 20.3% — a 55-point gap. Two categories score even lower — Sensitive Topics (4.9%) and Reference (3.8%) — but these are thin, templated dictionary, listing, and flagged-topic pages, set aside from the industry narrative for the same reason the cross-industry quality report card excludes them. Among real consumer industries, the pattern that does emerge is consistent with Google's framework: the "Your Money or Your Life" sectors it scrutinizes most heavily — Law & Government (65.0%), Finance (61.1%), Health (54.7%) — all clear the web average, which is what you would expect if heightened YMYL scrutiny pushes sites to demonstrate trust. That report card ranks 16 sectors across all six quality dimensions; this post goes deeper on EEAT alone — the grade-band distribution, more categories, and the subcategory cuts below.
The D-Band: The Web Is Mediocre, Not Failing
The grade distribution is the finding the pass rate hides. Plotting all 3.36M graded sites by band shows where the web actually lives:
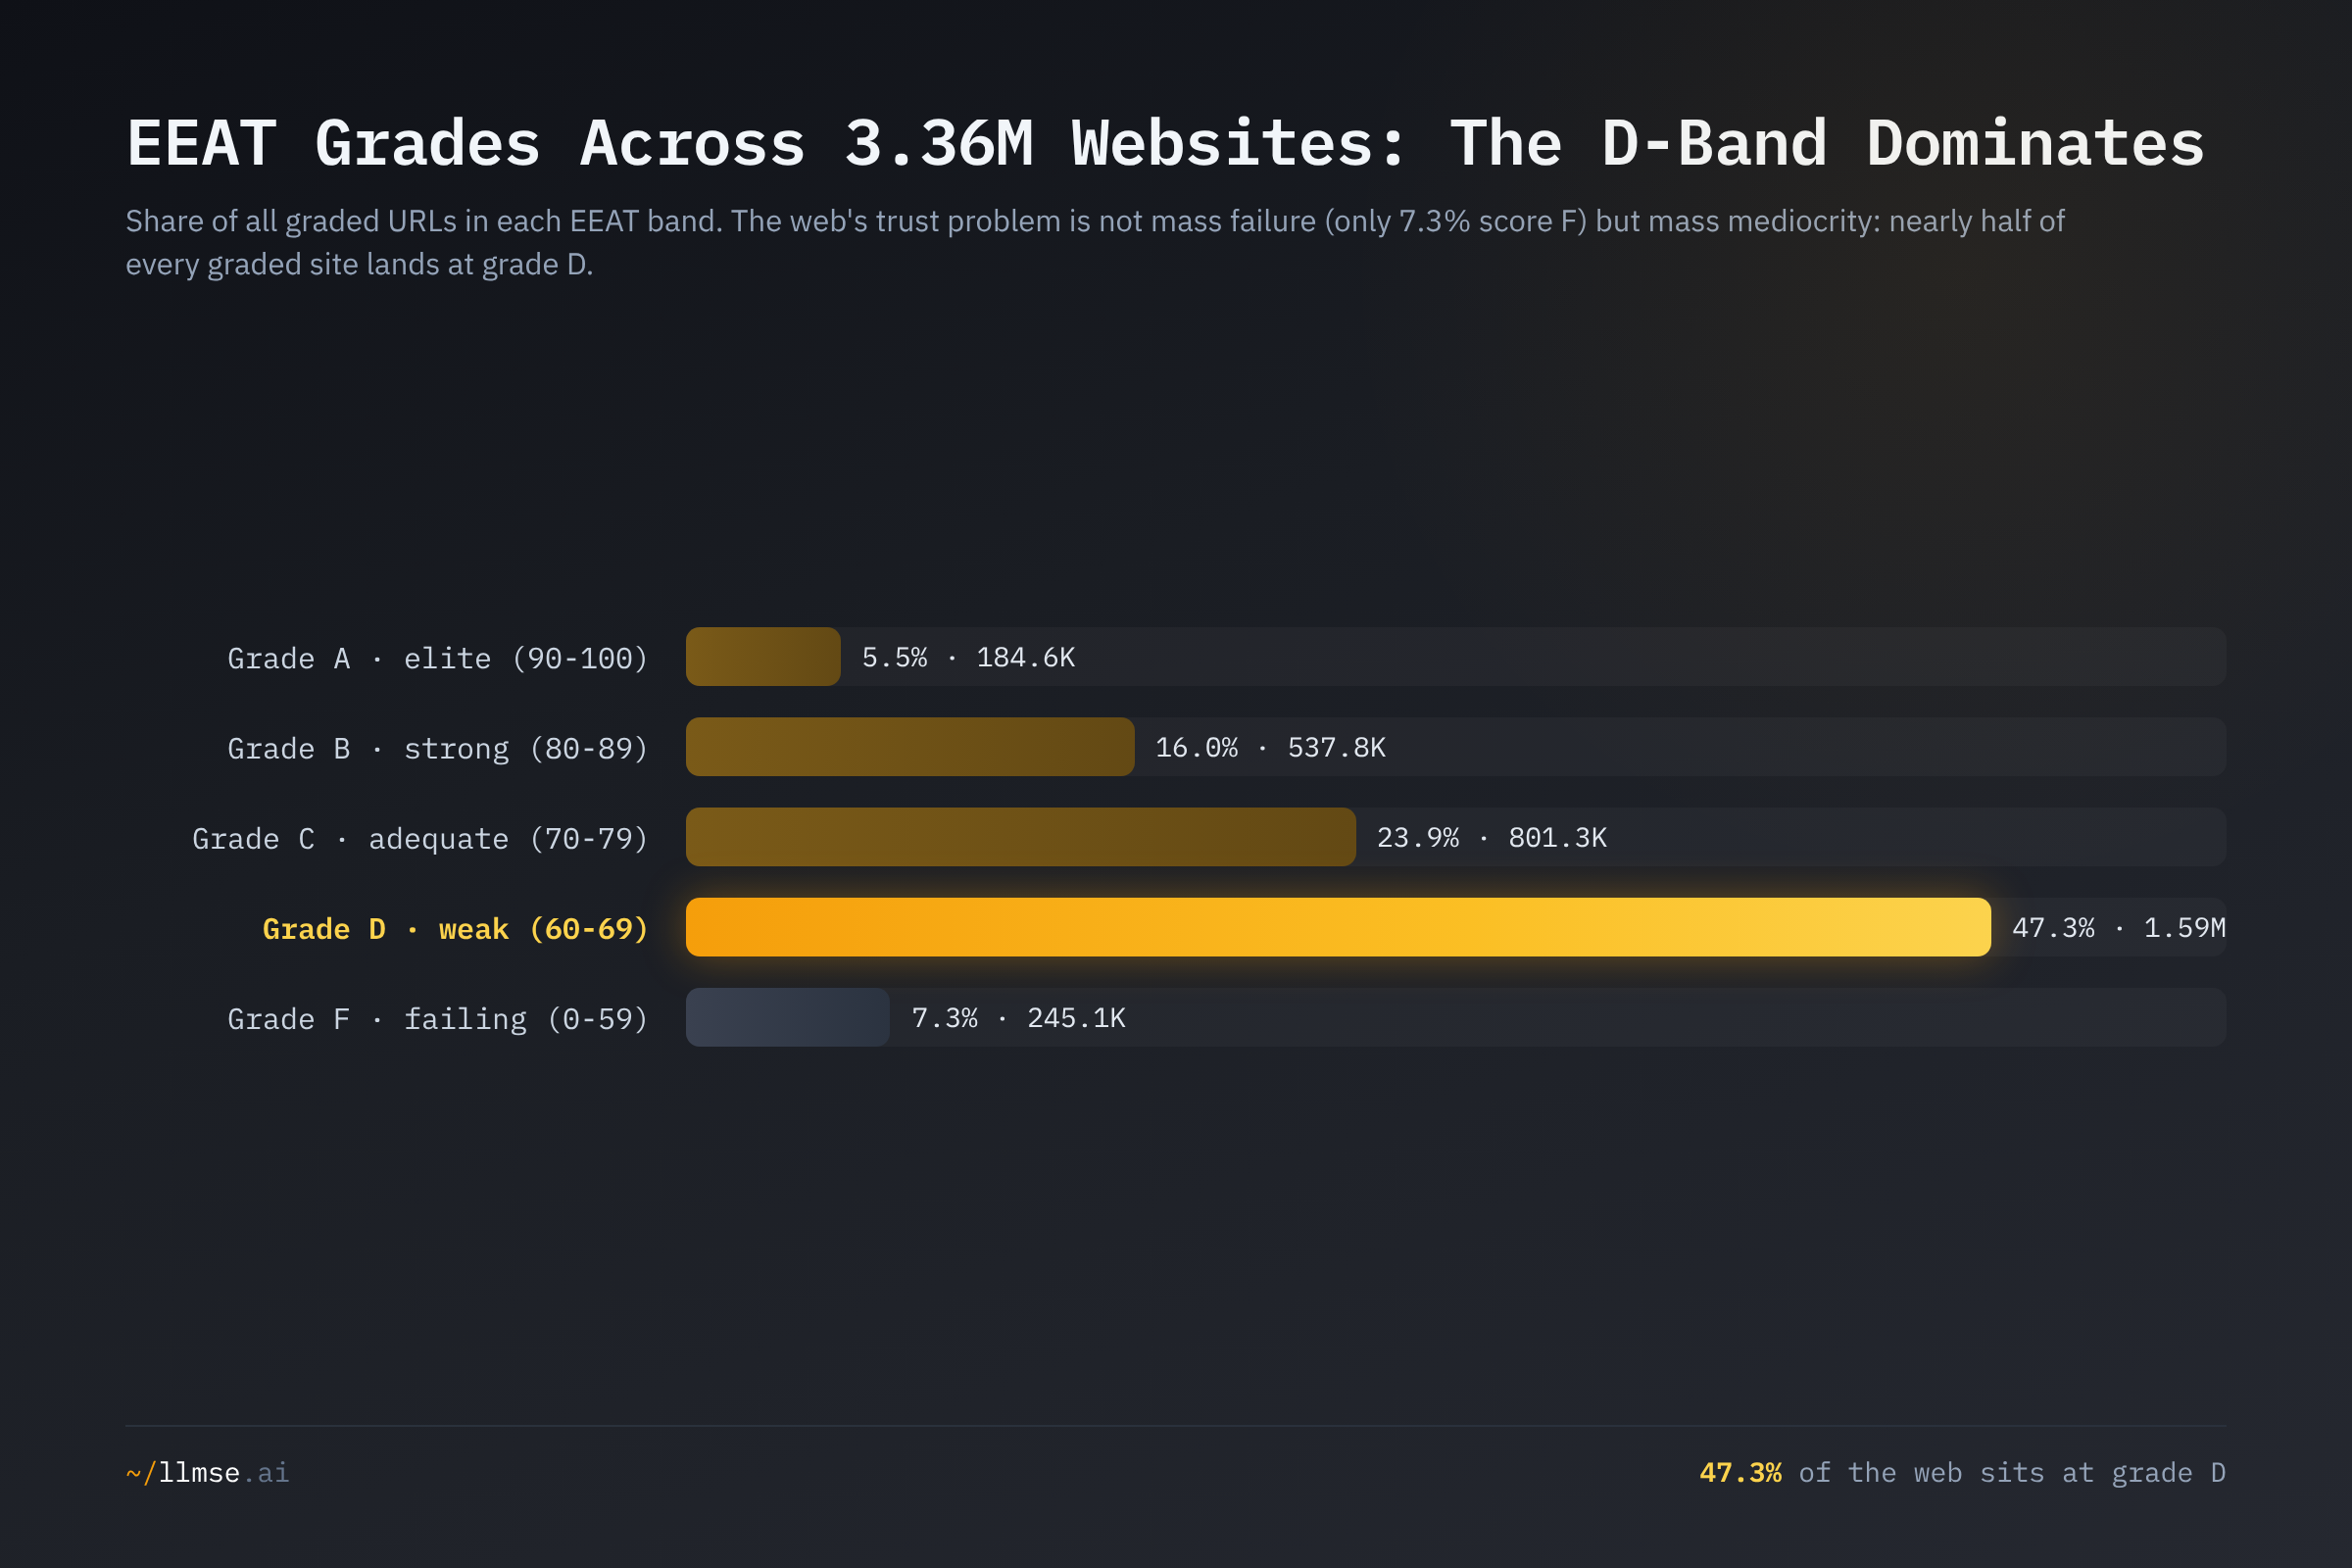
Nearly half the web — 47.3% — sits at grade D, while only 7.3% fail outright with an F. The web's trust problem is not a population of scams; it is a population of anonymous sites. A D-grade page typically has the basics — it loads over HTTPS, it has content — but lacks the depth signals that lift a page into C and above: a named author or organization, an about and contact page, editorial transparency, a privacy policy, citations to anything. It is present but unaccountable. This matters because, per Google, trust is the most important member of the E-E-A-T family — and a page that cannot demonstrate who stands behind it cannot earn trust even when its content is perfectly accurate. The elite A band, where a site signals trust comprehensively, is just 5.5% of the web. Excellence is roughly as rare as outright failure; mediocrity is the norm.
Shopping and the Commerce Trust Premium
Shopping is the trust leader at 75.4%, and the shape of its distribution explains why. It is the only major category that is genuinely front-loaded into the top grades: 28.4% of Shopping sites earn an A — more than five times the web's 5.5% — and 55.2% land in A or B combined. Contrast that with Computer & Electronics, which collapses into a single D spike.
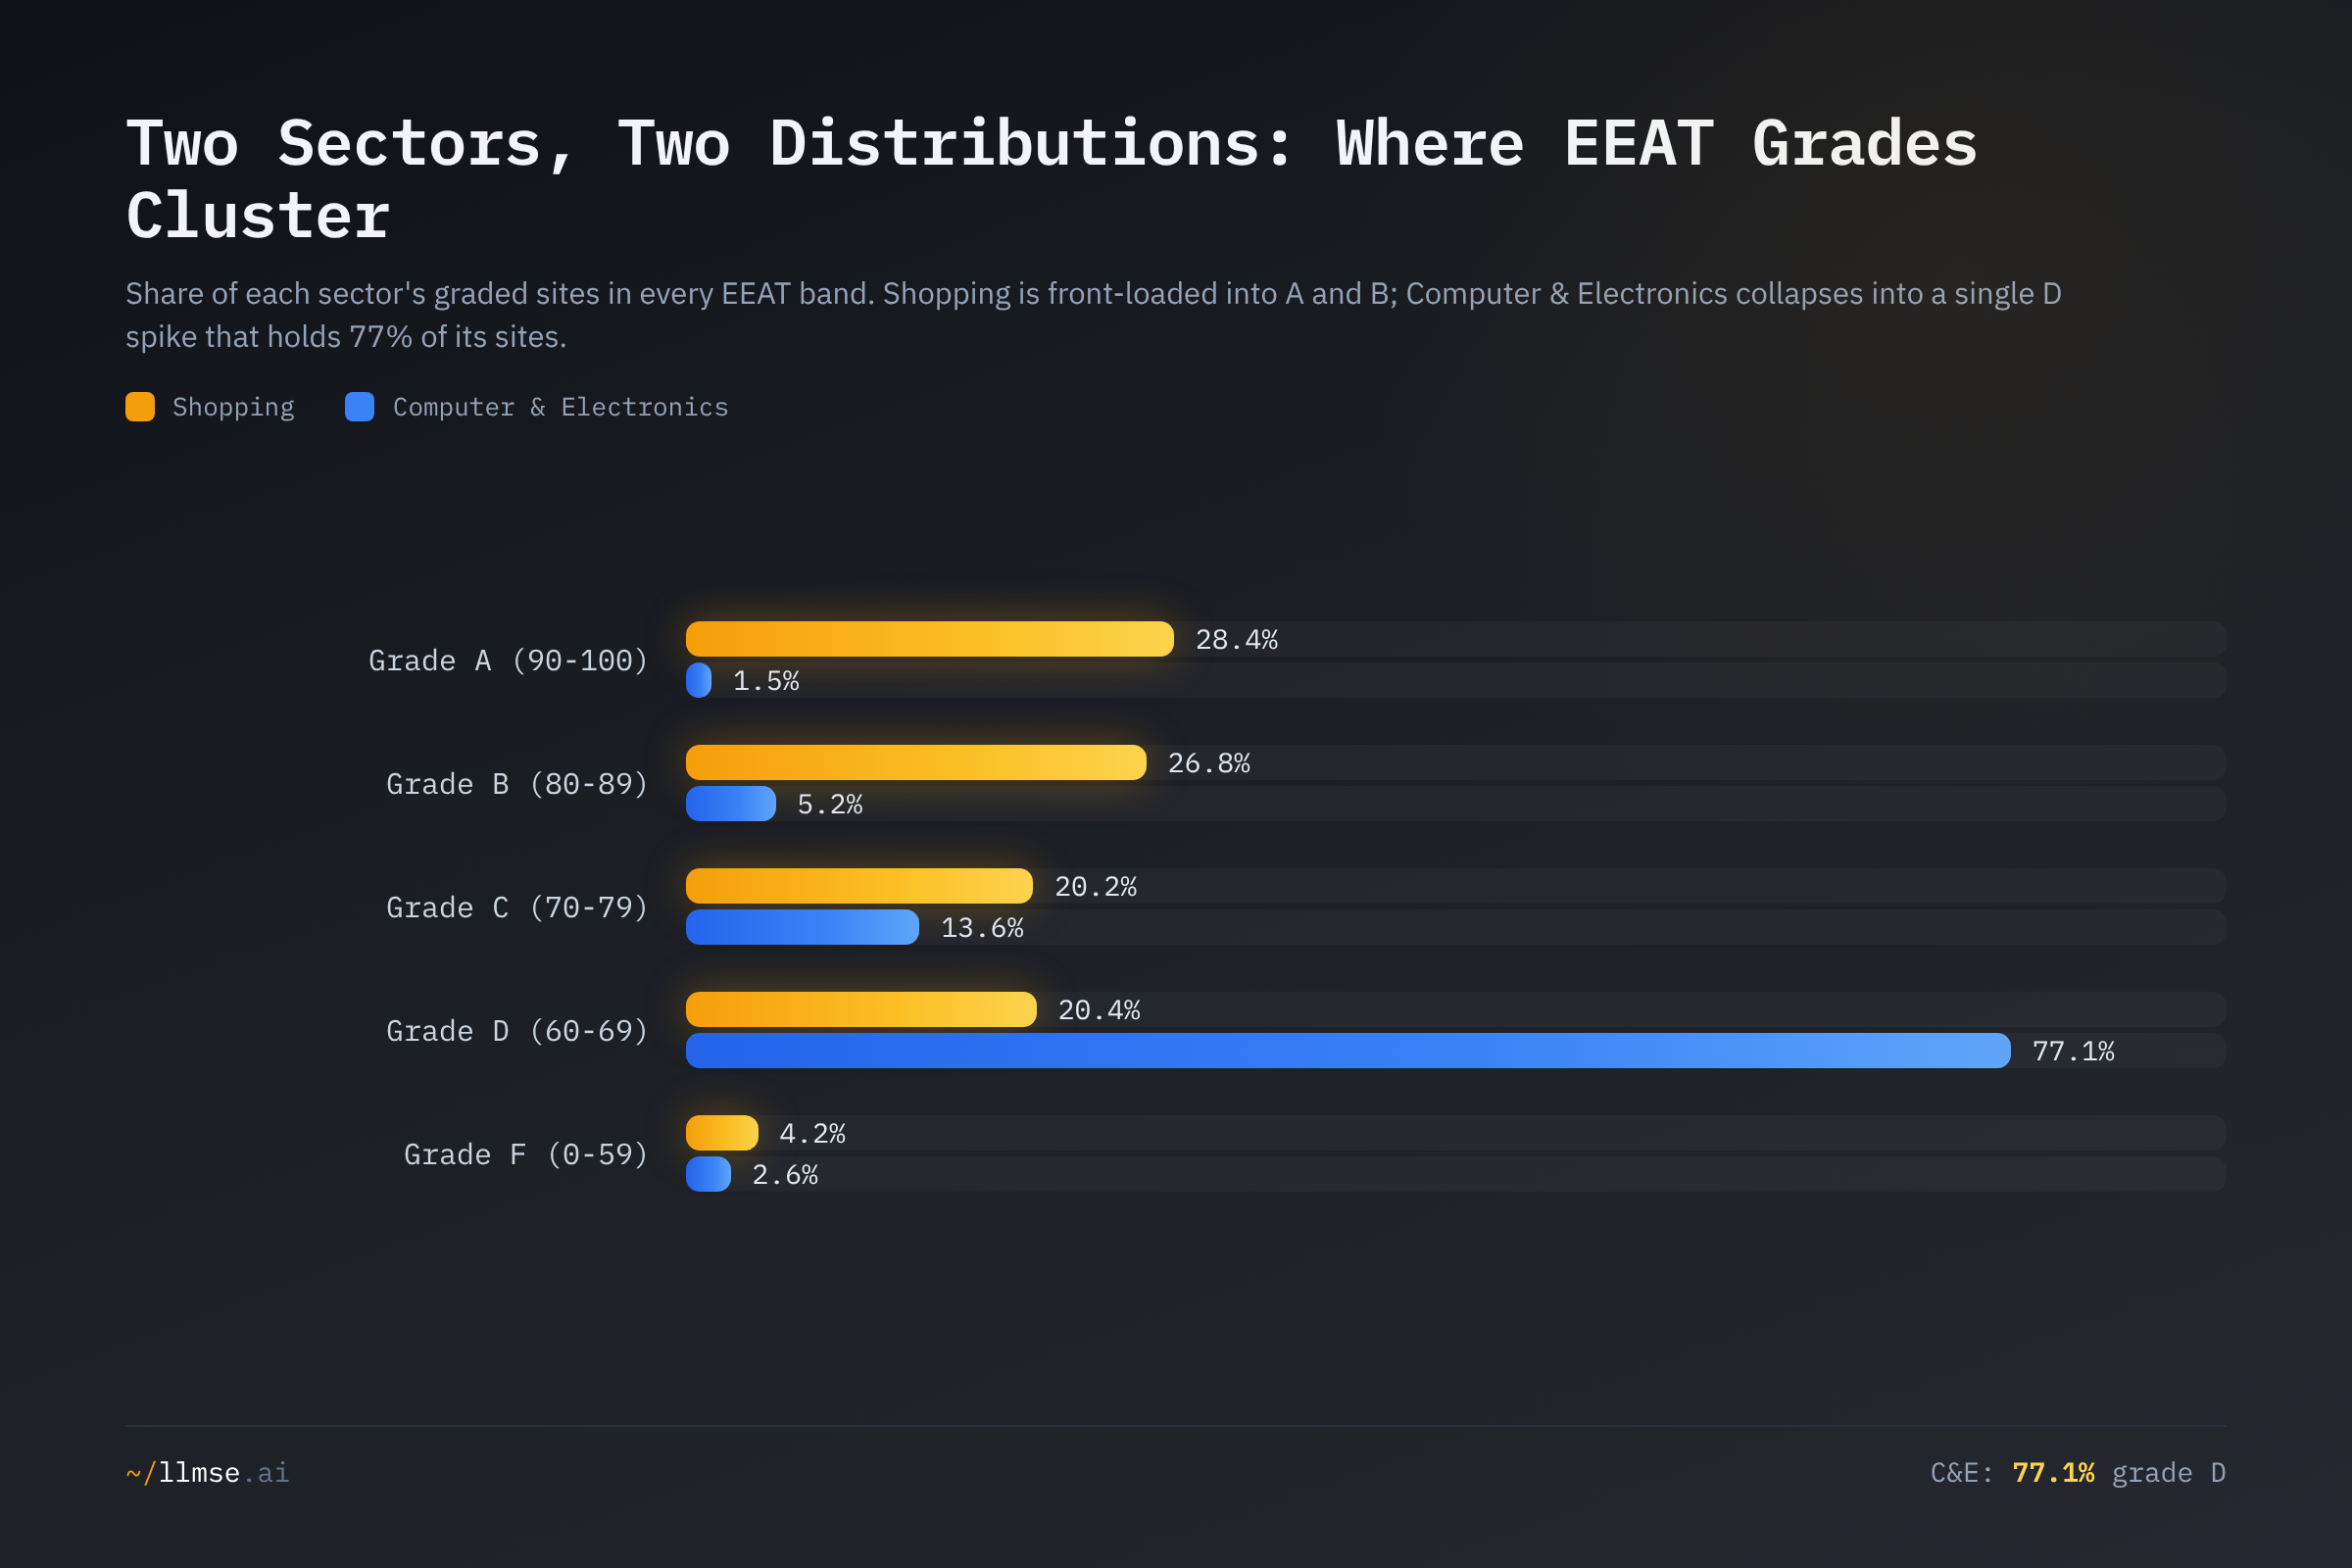
The two sectors are mirror images: Shopping's mass sits in A and B, Computer & Electronics' sits in a 77% D spike. E-commerce has spent two decades building the exact signals EEAT measures — business identity, contact and returns information, reviews, shipping and payment transparency — because for a store, trust is a conversion lever, not a courtesy. The pattern intensifies in its most commercial subcategories: Clothing passes at 84.8% and Jewelry at 85.1%, both with more than a third of their sites at an outright A. This is a plausible mechanism rather than a proven cause, but it is consistent across the data: where displaying trust directly affects revenue, sites display it.
The Builders' Blind Spot: Computer & Electronics
The sector that builds the web is the worst on the web at demonstrating trust — 20.3%, with 77.1% of its sites at grade D and just 1.5% at A. This is the central paradox, and it is not a fluke of one subcategory. Splitting Computer & Electronics into its largest subcategories, every one trails the web average:
| Subcategory | Sites graded | EEAT pass (A+B+C) | Share at grade D |
|---|---|---|---|
| Computer Hardware | 27,088 | 35.8% | 62.2% |
| Programming | 47,949 | 32.8% | 63.3% |
| Information & Network Security | 29,134 | 20.6% | 76.2% |
| Web Hosting | 24,428 | 19.1% | 80.2% |
| Programming Languages | 47,740 | 17.8% | 79.0% |
| Software | 50,761 | 17.1% | 80.4% |
| Web Development | 53,323 | 14.8% | 82.7% |
| Web Design & HTML | 16,398 | 14.2% | 83.5% |
| Networking | 10,017 | 11.8% | 86.7% |
| Operating Systems | 44,631 | 4.0% | 95.7% |
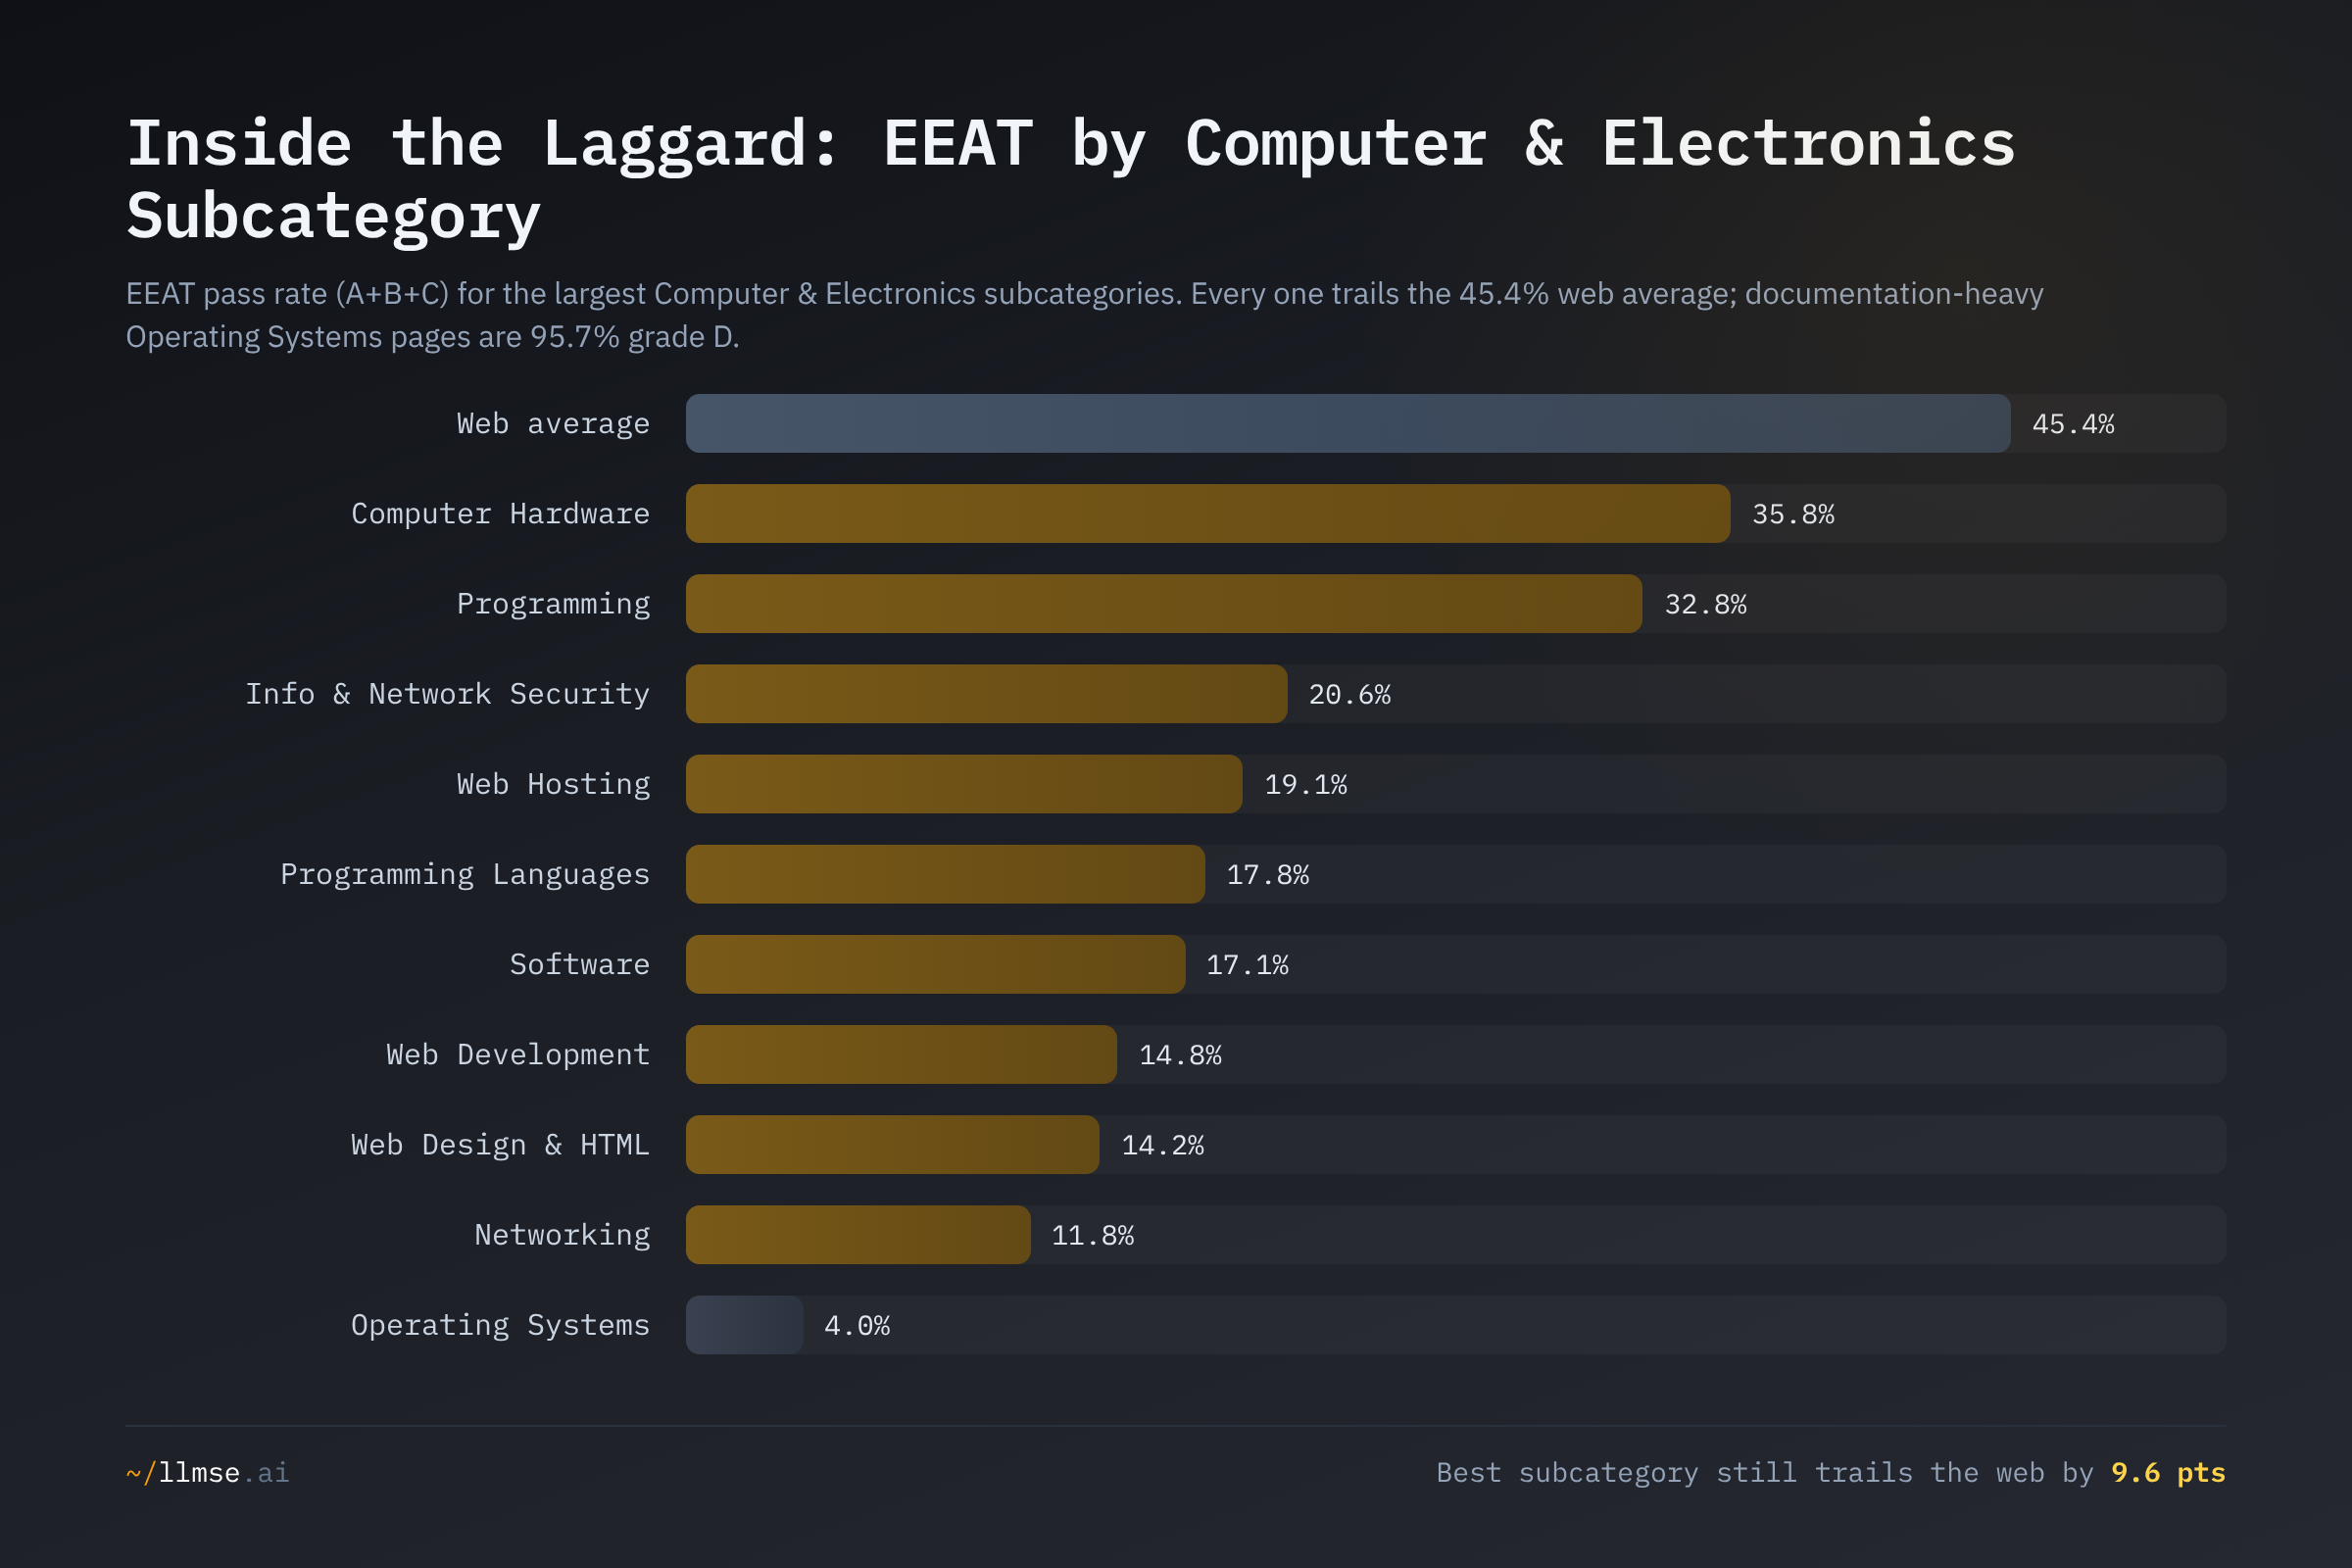
Even the best subcategory — Computer Hardware at 35.8% — trails the web average by nearly 10 points, and documentation-heavy Operating Systems pages pass at 4.0%, with 95.7% sitting at D. The explanation is structural and plausible rather than proven: developer documentation, package and project pages, OS distribution sites, and how-to references are written for humans who arrive via a link or an error-message search, not for raters or answer engines. They tend toward anonymous authorship, no Organization schema, and no editorial-transparency layer — precisely the signals EEAT rewards. The gap looks like a choice, not a capability ceiling: the teams that can build anything on the web decline to mark up who built it. The cross-industry report card flags the same paradox across other dimensions — the builders ship accessible pages and then strip out everything that signals identity.
YMYL and the Limits of "More Scrutiny, More Trust"
Google reserves its strictest standards of trustworthiness for "Your Money or Your Life" topics — content that could affect a person's health, financial stability, or safety. The aggregate data is broadly consistent with that pressure working: Law & Government (65.0%), Finance (61.1%), and Health (54.7%) all clear the 45.4% web average on EEAT, as a curated benchmark of famous YMYL brands would also suggest. But scrutiny lifts the floor, not the tail. Health still sends 14.2% of its sites to an F — the highest failure share of any leading category — because the long tail of clinics, supplement sellers, and unattributed health blogs is exactly where trust signals go missing. Higher stakes correlate with better aggregate trust signals; they do not make those signals universal. (The framework's evolution — Google added the second "E," Experience, to E-A-T in December 2022 — reflects the same direction of travel: more emphasis on demonstrable, first-hand credibility.)
What's at Stake
- 47.3% of the web sits at a D — the median site is not a scam, it is anonymous: present but unable to show who stands behind it. As AI answer engines lean on E-E-A-T-style signals to choose citations, that mediocre middle does not get blocked — it simply never gets selected, and the visibility loss is invisible to the sites losing it.
- The sector that builds the web under-signals its own credibility — Computer & Electronics at 20.3% (77% grade D) means the documentation, libraries, and project pages AI assistants depend on are the least likely to carry the identity and authority markup those same assistants reward. The web's plumbing is its least trustworthy-looking content.
- Trust tracks commercial incentive, not capability — Shopping reaches 75.4% because trust signals convert sales; technical publishers could add the same markup in an afternoon and do not, because nothing in a docs page's job depends on it. The 55-point gap is a difference of motive, not skill.
- YMYL scrutiny raises the average but not the floor — Finance, Law, and Health beat the web average, yet Health alone fails 14.2% of its sites outright. For money-and-health content, an unaccountable page is a user-safety risk, not just a ranking liability.
What Would Help
- Site owners: add an identity layer before chasing a number. Most sites that miss EEAT are not failing, they are anonymous — stuck at D for want of a named author or organization, an about and contact page, and a privacy policy. Those basics move a D toward a C faster than any other change. Check yours with the free E-E-A-T analyzer.
- Developers and technical publishers: ship the credibility markup you withhold. Computer & Electronics trails every consumer sector (20.3%) largely because docs and project pages omit author attribution and Organization schema — a JSON-LD block naming the entity, its logo, and its profiles. You build the web; signal who built it, and your content becomes far likelier to be cited by AI answer engines.
- E-commerce teams: keep treating trust as the conversion asset it already is. Shopping's lead comes from business identity, reviews, returns, and payment transparency surfaced on the page. The same signals that close a sale are the ones EEAT graders and answer engines read — the work is already paid for by conversion.
- YMYL publishers (health, finance, legal): close the F tail. Above-average aggregate scores hide a long tail — 14.2% of Health sites score F. For content that affects money and health, Google applies its strictest trust standard; a single un-attributed, policy-less page is a liability the sector average will not cover for you.
- AI platforms: do not mistake a D for an absence of trust. Nearly half the web is present but unsignaled. Retrieval that hard-filters on trust markup over-selects the optimized commercial fringe (Shopping) and under-selects the documentation and reference content (Computer & Electronics) users actually need. Weight provenance, and read the cross-industry report card for how trust trades off against the other five quality dimensions.
This analysis was conducted using LLMSE, which has classified over 3.4 million websites across SEO, EEAT, AEO, WCAG accessibility, readability, GARM brand safety, and privacy dimensions. EEAT figures reflect the 3,358,196 URLs graded for E-E-A-T in the index as of June 2026. To analyze your own site across every dimension in this post, visit llmse.ai/classify.