The JavaScript Framework Effect: Rendering Strategy and Era Predict Website Quality, Not Brand
Update — 2026-06-29: Refreshed against LLMSE's current index of 3.4 million classified URLs (up from ~1.5M at first publication) and expanded from four quality dimensions to six, adding AEO (AI-answer optimization) and Privacy to the original SEO, EEAT, WCAG and readability. The headline correction: the original "React paradox" — worst SEO, worst trust, best accessibility — was a small-sample artifact. React's per-dimension graded sample has grown from a few dozen sites to about 10,000, and the profile reversed on every axis: React now passes SEO at 2.1% (mid-pack, was 0.5%/worst), EEAT at 66.3% (above average, was 16.1%/worst), and WCAG at just 32.4% (below average, was 76.5%/best). That claim is retracted. The post is re-angled around what the full-scale data still supports — rendering strategy and platform era predict quality: static-site generators and Ghost lead discovery, pre-rendered output beats client-only SPAs roughly 2x on SEO, and the jQuery-era web trails. Curated per-platform infrastructure and demographic sub-tables from the original were dropped as non-reproducible; every framework-by-dimension cell was recomputed and four charts were added.
"Should I use React or Next.js?" "Is Angular dying?" "Does client-side rendering hurt SEO?" Developers ask these constantly, and the answers are almost always theoretical — framework maintainers claiming their tool is best, blog posts citing Google's "we can render JavaScript" position, Stack Overflow threads full of anecdotes. Nobody measures what actually happens when hundreds of thousands of real websites are built each way.
When we first ran this analysis in March 2026, the graded samples for the newer JavaScript frameworks were tiny — React's accessibility grade rested on 68 sites, its SEO grade on 560 — and they produced a tidy, counterintuitive story: React had the worst SEO and trust scores but the best accessibility. That story spread well precisely because it was surprising. It was also wrong. As classification expanded the graded population from roughly 1.5 million to 3.4 million URLs, React's samples grew into the thousands and the "paradox" dissolved. The lesson is the one every benchmark eventually learns: a few dozen hand-caught sites are not a population.
We re-ran the whole comparison against the current index — 15-plus JavaScript frameworks, static-site generators, and CMS platforms, cross-referenced against six automated quality grades (SEO, AEO, EEAT trust signals, WCAG accessibility, readability, and privacy) applied uniformly across every site in the database, not a hand-picked list of flagship apps. The point was to find which of the original findings survive a full-scale sample and which were noise.
The durable finding is that framework brand barely predicts quality — but rendering strategy and platform era do. On discovery, the spread is monotonic by how a site assembles its HTML: static-site generators and the opinionated Ghost CMS lead, modern server-rendered output beats client-only single-page apps roughly two to one, and the vast jQuery-era web trails almost everything. On trust, accessibility, and privacy the ladder breaks down entirely — those track content type and the platform's generation, not React versus Vue. The "uniquely good or bad framework" story was always a small-sample mirage; what is real is older and simpler.
The Data
Every grade below comes from LLMSE's automated analysis pipeline applied uniformly across the index — not a curated sample of famous sites. Pass rates are computed over the population actually graded on each dimension, so the per-dimension denominators differ; not every URL carries every grade.
| Dimension | URLs graded (web-wide) | Web-average pass rate |
|---|---|---|
| SEO | 3,362,585 | 1.9% |
| AEO (AI answers) | 3,337,571 | 1.5% |
| EEAT (trust) | 3,358,455 | 45.4% |
| WCAG (accessibility) | 3,341,494 | 43.8% |
| Readability | 3,341,645 | 32.8% |
| Privacy | 3,335,758 | 37.0% |
Frameworks, build tools, and CMS platforms are detected from HTML signatures — CDN imports, framework-specific attributes and class names, meta generator tags, and build-tool artifacts. A single site can carry several detections (a WordPress site that also loads jQuery; a Next.js site that is also React). The platforms studied here span four orders of magnitude in footprint:
| Type | Platform | Detected sites |
|---|---|---|
| Server CMS | WordPress | 1,060,974 |
| Legacy library | jQuery | 299,324 |
| Server CMS | Drupal | 35,626 |
| Server CMS | Joomla | 28,238 |
| Builder | Squarespace | 26,544 |
| Static SSG | Astro | 23,797 |
| Meta-framework (SSR) | Next.js | 21,305 |
| Static SSG | Jekyll | 17,666 |
| Commerce | Shopify | 15,422 |
| Builder | Webflow | 13,488 |
| Static SSG | Hugo | 12,077 |
| Client SPA | Angular | 10,353 |
| Client SPA | React | 10,310 |
| Client SPA | Vue.js | 7,251 |
| Meta-framework (SSR) | Nuxt.js | 7,006 |
| Static SSG | Gatsby | 3,604 |
| Blog CMS | Ghost | 1,243 |
Smaller modern frameworks — SvelteKit (1,384), Remix (711), Svelte (322), Preact (320), Eleventy (322), Alpine.js (3,547), Stimulus (1,259) — are reported only where their graded samples are large enough to be meaningful, and flagged as small where used.
Methodology
This post makes quantitative comparisons, so the definitions and limits matter.
- Grades and "pass." Each site is graded A-F by a dedicated automated analyzer (there is no E grade). "Pass" means A+B+C for SEO, AEO, EEAT, WCAG, and Privacy, and A+B for Readability (a Flesch Reading Ease score of roughly 50+, ≈ 8th-grade level or below). SEO grades technical fundamentals (titles, meta, crawlable structure, canonicals); AEO grades answer-extractability and AI-citation signals; EEAT grades experience/expertise/authority/trust signals; WCAG covers automated accessibility checks; Privacy grades consent gating, policy presence, and tracker behavior.
- Classification basis. Platform membership is by HTML-signature detection; each grade is an independent automated analyzer. WCAG is the most heuristic check: automated static-HTML testing reliably covers only part of the standard — independent analyses put automated coverage at roughly 30-57% of WCAG issues, with the remainder (alt-text quality, focus order, keyboard interaction) requiring human judgment per WCAG 2.1. Treat WCAG pass rates as a floor on conformance, not a verdict.
- Cross-references are computed as set intersections (Redis
ZINTERCARD) between a platform index (app-{Platform}) and each grade index (e.g.seo-A). The rendering-class rows pool the per-platform graded counts and passes for the named members; because a site can carry multiple detections, pooled denominators may slightly double-count, but the alternative build tools within a class rarely co-occur on the same page, so the effect is small. All counts are aggregate; no individual site is identified. - Known limits. Pass rates are over graded populations, which are smaller than raw detection counts. Detection counts sites, not developers, and undercounts frameworks that leave few client-side fingerprints (much server-rendered React is detected as Next.js, not React). The Readability grade uses Flesch scoring, calibrated for English, so cross-platform readability is indicative, not exact. Counts are a live snapshot and drift as classification continues. Russian-language sites are excluded from all aggregates.
- Why these numbers differ from the 2026-03 original. The graded population grew from ~1.5M to ~3.4M URLs, and early grades skewed toward higher-quality, more-visible sites, so most absolute pass rates fell a few points as coverage broadened (web EEAT 48.3%→45.4%, WCAG 52.7%→43.8%). The largest single change is React, whose per-dimension graded sample went from a few dozen sites to about 10,000 — large enough to overturn the original's headline ranking (see The React Paradox That Wasn't). Curated infrastructure (
app×server) and demographic sub-tables in the original are not the focus here and were dropped; the analysis is rebuilt entirely on reproducible aggregate cross-references.
The Scorecard
Pass rates by platform across all six dimensions, grouped by type. The best (standout) cell in each column is bolded.
| Platform | Type | SEO | AEO | EEAT | WCAG | Read. | Privacy | Sites |
|---|---|---|---|---|---|---|---|---|
| Ghost | Blog CMS | 9.9% | 1.7% | 33.6% | 74.5% | 45.9% | 23.0% | 1,243 |
| Astro | SSG | 4.9% | 1.9% | 61.4% | 37.0% | 28.4% | 30.7% | 23,797 |
| Jekyll | SSG | 4.8% | 1.0% | 57.6% | 66.1% | 38.0% | 4.4% | 17,666 |
| Hugo | SSG | 4.1% | 1.4% | 59.8% | 55.1% | 34.7% | 19.9% | 12,077 |
| Gatsby | SSG | 4.9% | 1.0% | 62.9% | 60.1% | 30.9% | 39.0% | 3,604 |
| Next.js | SSR | 4.3% | 1.3% | 47.8% | 54.3% | 26.8% | 31.8% | 21,305 |
| Nuxt.js | SSR | 2.5% | 1.2% | 33.1% | 63.8% | 18.4% | 23.4% | 7,006 |
| WordPress | CMS | 2.8% | 2.3% | 59.8% | 45.1% | 33.0% | 47.2% | 1,060,974 |
| Drupal | CMS | 2.6% | 2.4% | 65.6% | 49.2% | 19.6% | 56.7% | 35,626 |
| React | SPA | 2.1% | 3.0% | 66.3% | 32.4% | 16.6% | 61.1% | 10,310 |
| Angular | SPA | 2.2% | 1.4% | 42.9% | 41.5% | 27.4% | 30.1% | 10,353 |
| Vue.js | SPA | 1.7% | 0.7% | 50.6% | 37.9% | 34.0% | 27.2% | 7,251 |
| Shopify | Commerce | 1.3% | 6.0% | 91.8% | 26.4% | 52.5% | 76.9% | 15,422 |
| Squarespace | Builder | 1.9% | 1.0% | 33.8% | 53.3% | 41.8% | 20.8% | 26,544 |
| Webflow | Builder | 1.4% | 2.5% | 86.6% | 31.3% | 27.4% | 69.2% | 13,488 |
| jQuery | Legacy | 0.7% | 0.1% | 42.6% | 31.1% | 43.5% | 19.2% | 299,324 |
| Joomla | Legacy CMS | 0.4% | 0.4% | 62.4% | 35.4% | 37.0% | 38.1% | 28,238 |
| Web average | 1.9% | 1.5% | 45.4% | 43.8% | 32.8% | 37.0% | 3.4M |
No platform brand sweeps the board, and the ones that lead each column do so for reasons of rendering model and content type, not brand identity. Discovery (SEO) belongs to Ghost and the static-site generators. Trust (EEAT), privacy, and readability belong to commerce platforms — Shopify and Webflow — that are built around business identity and product copy. Accessibility (WCAG) belongs to platforms that emit clean semantic HTML by default: Ghost, Jekyll, Nuxt.js, Next.js. React, the framework the original singled out, is now unremarkable on most axes — above average on trust and privacy, mid-pack on SEO, below average on accessibility.
By Rendering Strategy
Pool the JavaScript-era platforms by how they build their HTML and the discovery pattern becomes clean and monotonic.
| Rendering class | Members | SEO | AEO | EEAT | WCAG | Read. | Privacy |
|---|---|---|---|---|---|---|---|
| Static SSG | Astro, Jekyll, Hugo, Gatsby | 4.7% | 1.5% | 60.0% | 51.2% | 32.9% | 20.8% |
| Modern SSR | Next.js, Nuxt.js, Remix, SvelteKit | 3.8% | 1.2% | 43.3% | 57.7% | 25.4% | 28.6% |
| Server CMS | WordPress, Drupal | 2.8% | 2.3% | 60.0% | 45.2% | 32.6% | 47.5% |
| Client SPA | React, Angular, Vue | 2.0% | 1.8% | 53.6% | 37.2% | 25.1% | 40.9% |
| Legacy | jQuery | 0.7% | 0.1% | 42.6% | 31.1% | 43.5% | 19.2% |
| Web average | — | 1.9% | 1.5% | 45.4% | 43.8% | 32.8% | 37.0% |
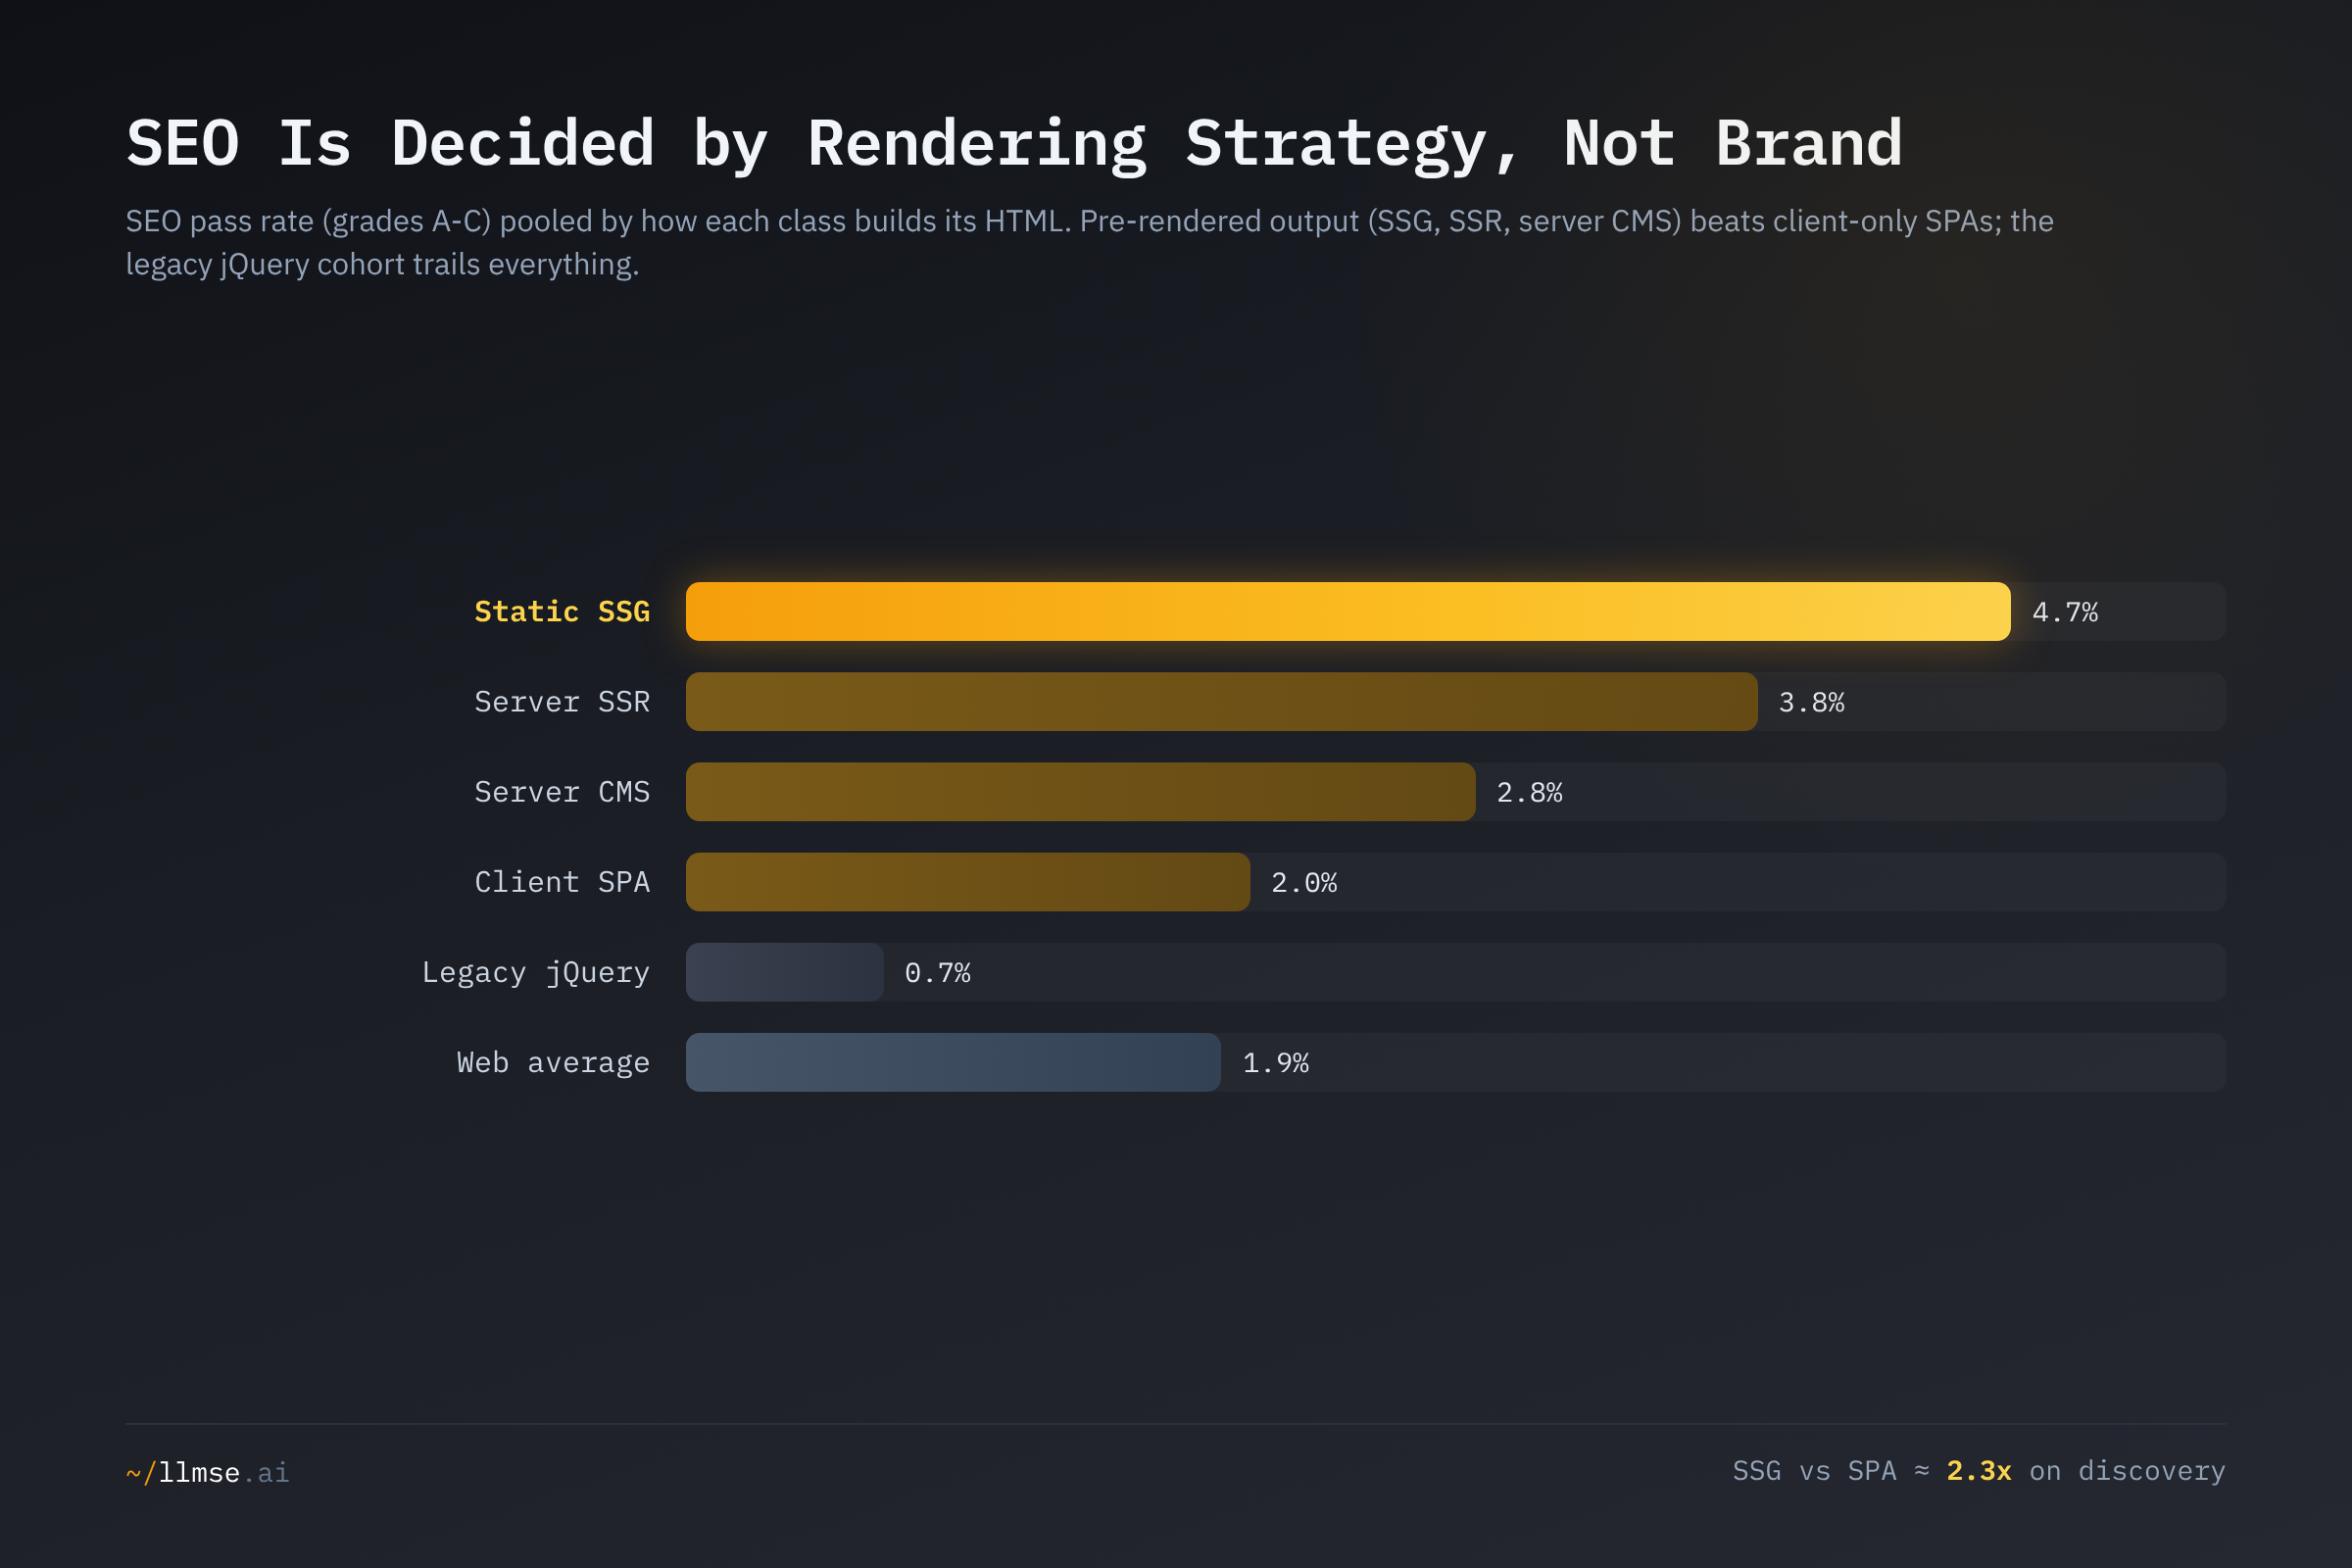
On SEO the ladder is strictly ordered by how much HTML reaches the crawler without running JavaScript: SSG 4.7% > SSR 3.8% > server CMS 2.8% > client SPA 2.0% > legacy jQuery 0.7%. Pre-rendered static output, where every page exists as a complete HTML file before a request arrives, passes SEO at more than double the rate of client-only single-page apps and nearly seven times the legacy rate. On the other four dimensions the ordering collapses: the static-generator tier that leads SEO falls near the bottom on privacy (20.8%), modern SSR — not SSG — leads accessibility (57.7%), and the legacy jQuery cohort out-reads every modern class (43.5% readability). Rendering strategy governs discovery; the rest tracks content type and platform era, explored below.
SEO: Rendering Strategy Decides Discoverability
The clearest survivor of the original analysis is that server-rendered and statically generated HTML wins search, and client-only rendering loses it. Ghost leads every platform at a 9.9% SEO pass rate — five times the 1.9% web average — followed by a tight band of static-site generators: Astro and Gatsby (4.9%), Jekyll (4.8%), Hugo (4.1%), with the React-based meta-framework Next.js right alongside them at 4.3%.
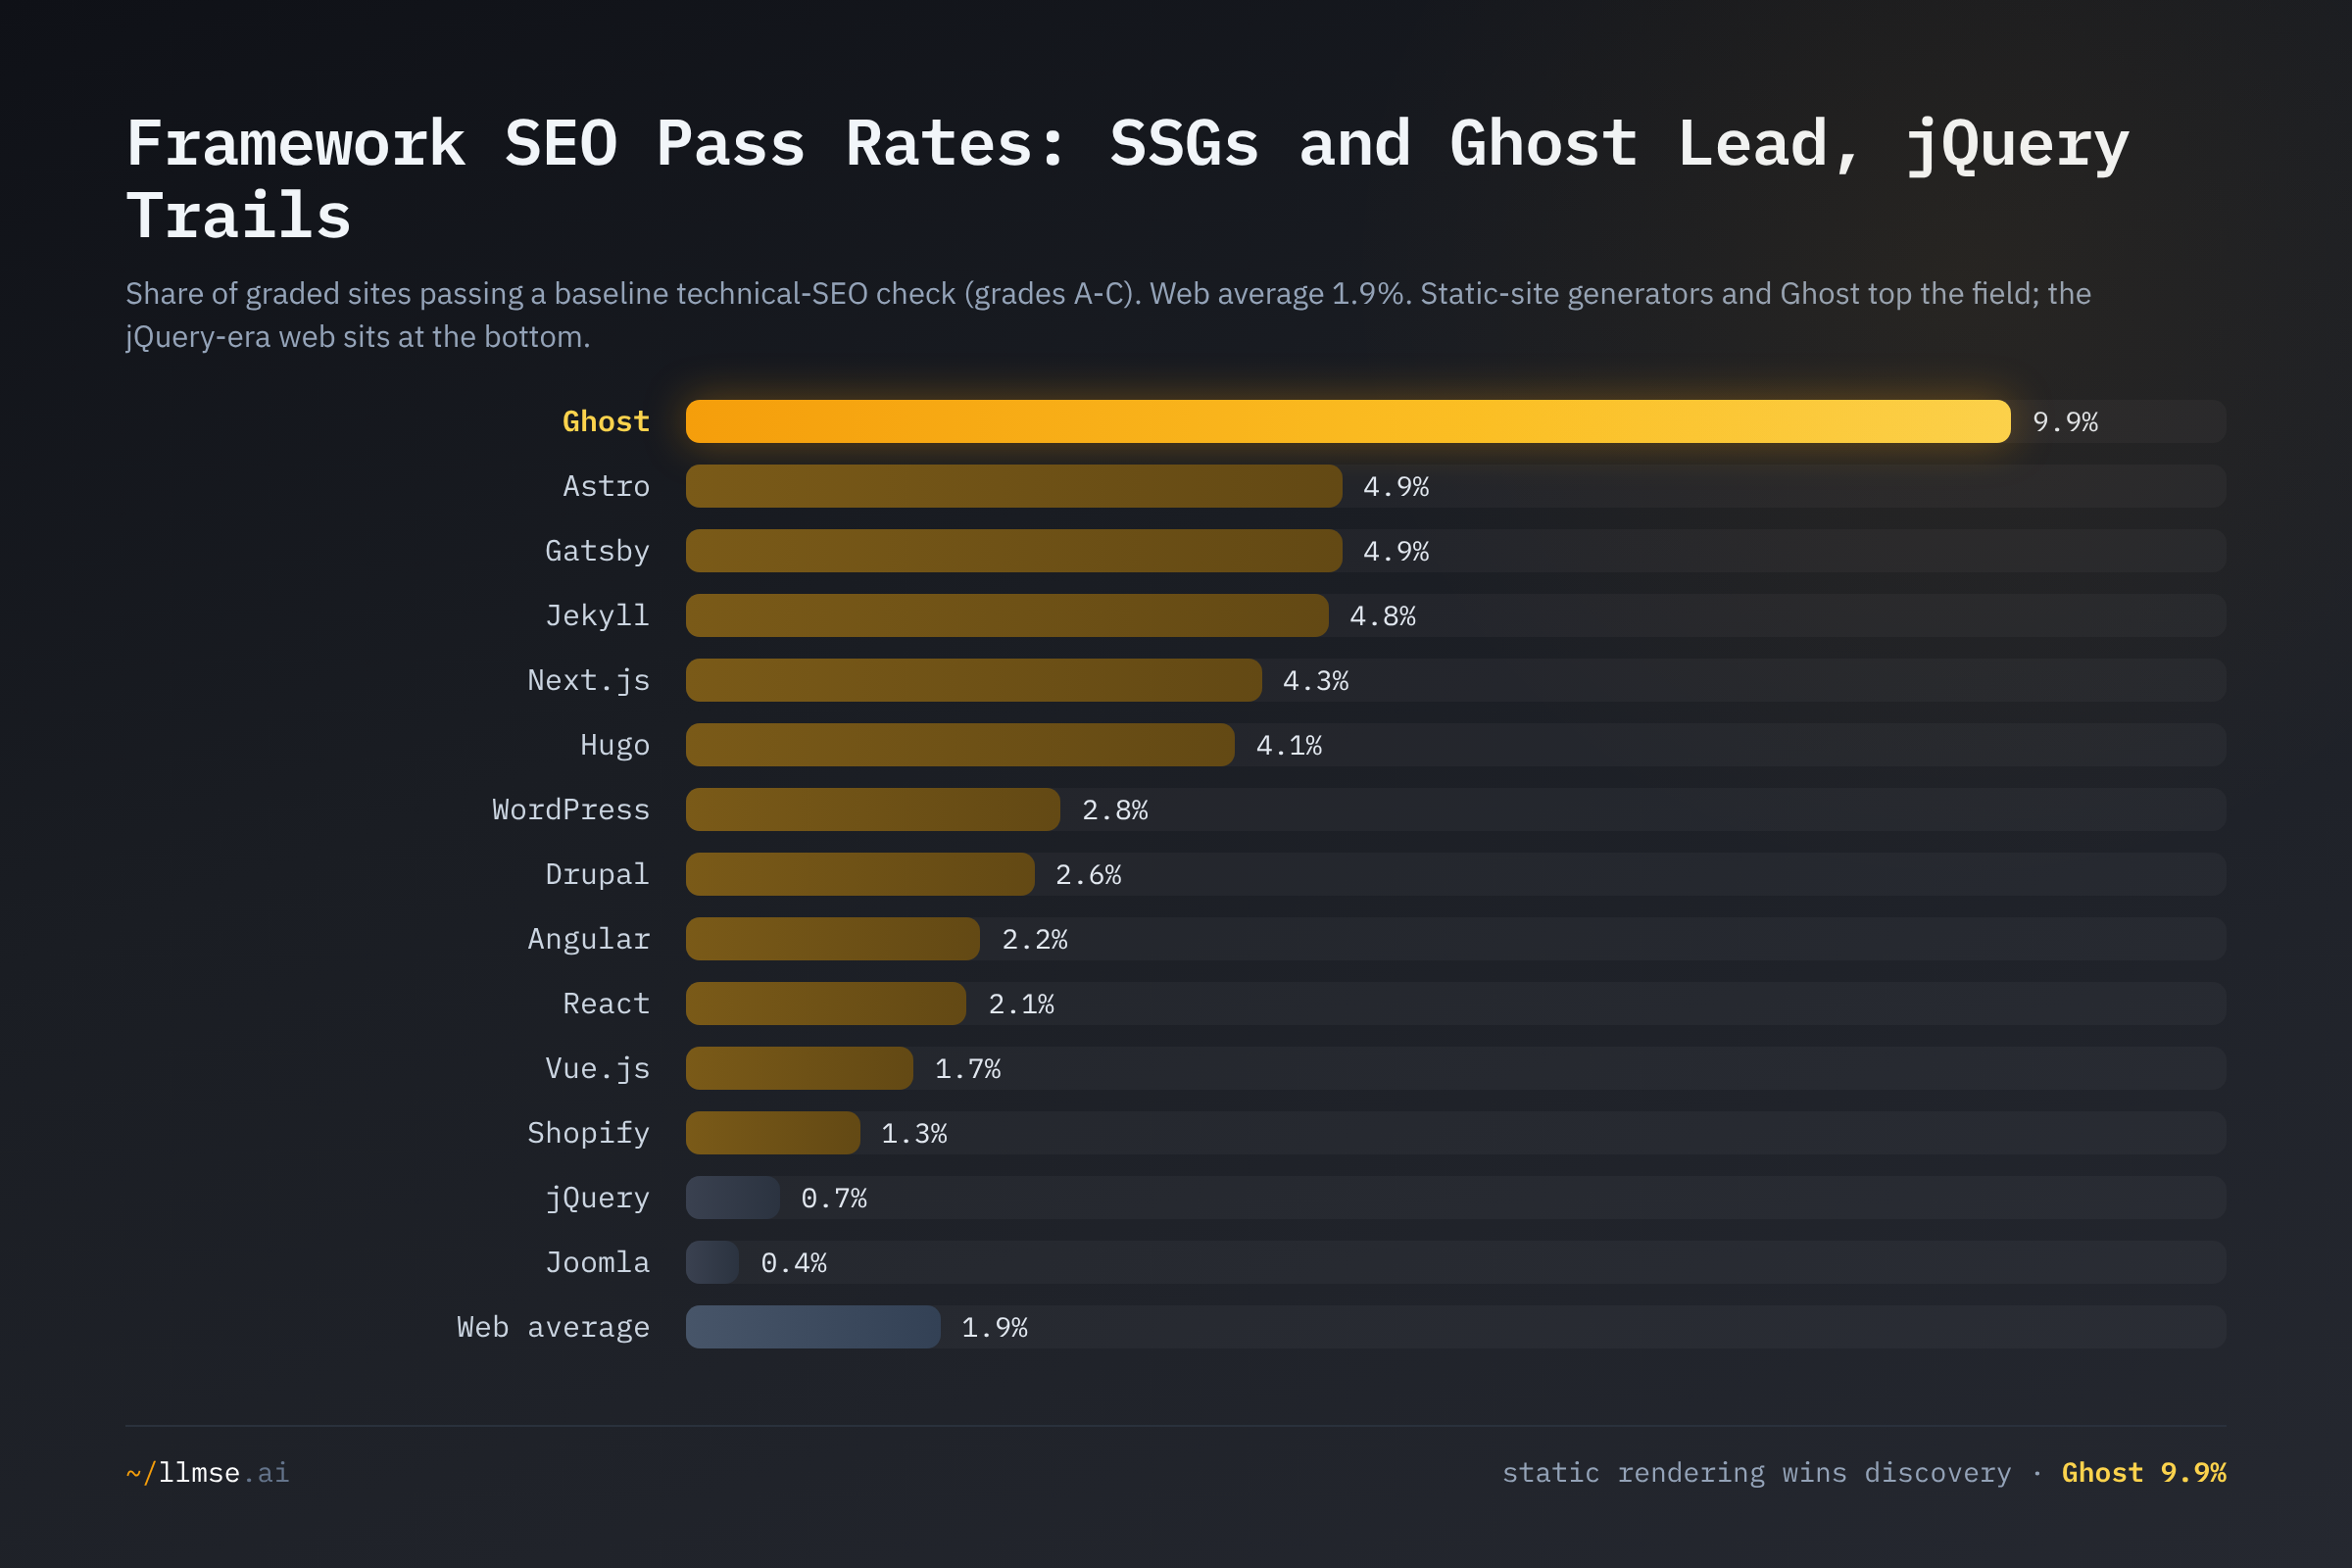
Ghost's lead is structural, not incidental. It is an opinionated, server-rendered publishing platform: clean semantic HTML, built-in meta tags, automatic structured data, and XML sitemaps ship by default, so good technical SEO is the platform's standard output rather than an add-on. (Ghost's 1,243 detected sites and 1,228 graded make it the smallest platform featured here, so read the exact figure as indicative; the direction is consistent with its architecture.)
The mechanism is well-documented by the search engines themselves. Google processes JavaScript in three phases — crawling, rendering, and indexing — and the rendering phase is explicitly deferred: per Google's JavaScript SEO guidance, a page "may stay on this queue for a few seconds, but it can take longer," and Google still recommends that "server-side or pre-rendering is still a great idea because it makes your website faster for users and crawlers, and not all bots can run JavaScript." Google's own web.dev guidance reaches the same conclusion, encouraging server-side or static rendering over full client-side rehydration for crawlable, "complete-looking" pages. Pre-rendered HTML is what the SSG and SSR tiers ship and what client-only SPAs do not — which is exactly the gradient the data shows.
React (2.1%) and Vue.js (1.7%) sit mid-pack, not at the bottom — above Shopify, Webflow and Wix, below the CMS and SSG tiers, and roughly at the web average. The bottom of the table belongs to the legacy web: jQuery passes SEO at 0.7% and Joomla at 0.4%, both far below average. This is the inverse of the original post's claim that React anchored the bottom; with a real sample, the laggards are the older platforms, and client-side rendering is a moderate penalty, not a catastrophe.
The React Paradox That Wasn't
The original version of this post built its most-shared finding on samples that were, in hindsight, far too small: React's accessibility grade came from 68 sites, its EEAT grade from 378, its SEO grade from 560. From those it reported React as worst on SEO (0.5%), worst on trust (16.1%), and best on accessibility (76.5%) — a clean, counterintuitive "paradox." At full scale, with roughly 10,000 sites graded on each dimension, every leg of it reverses.
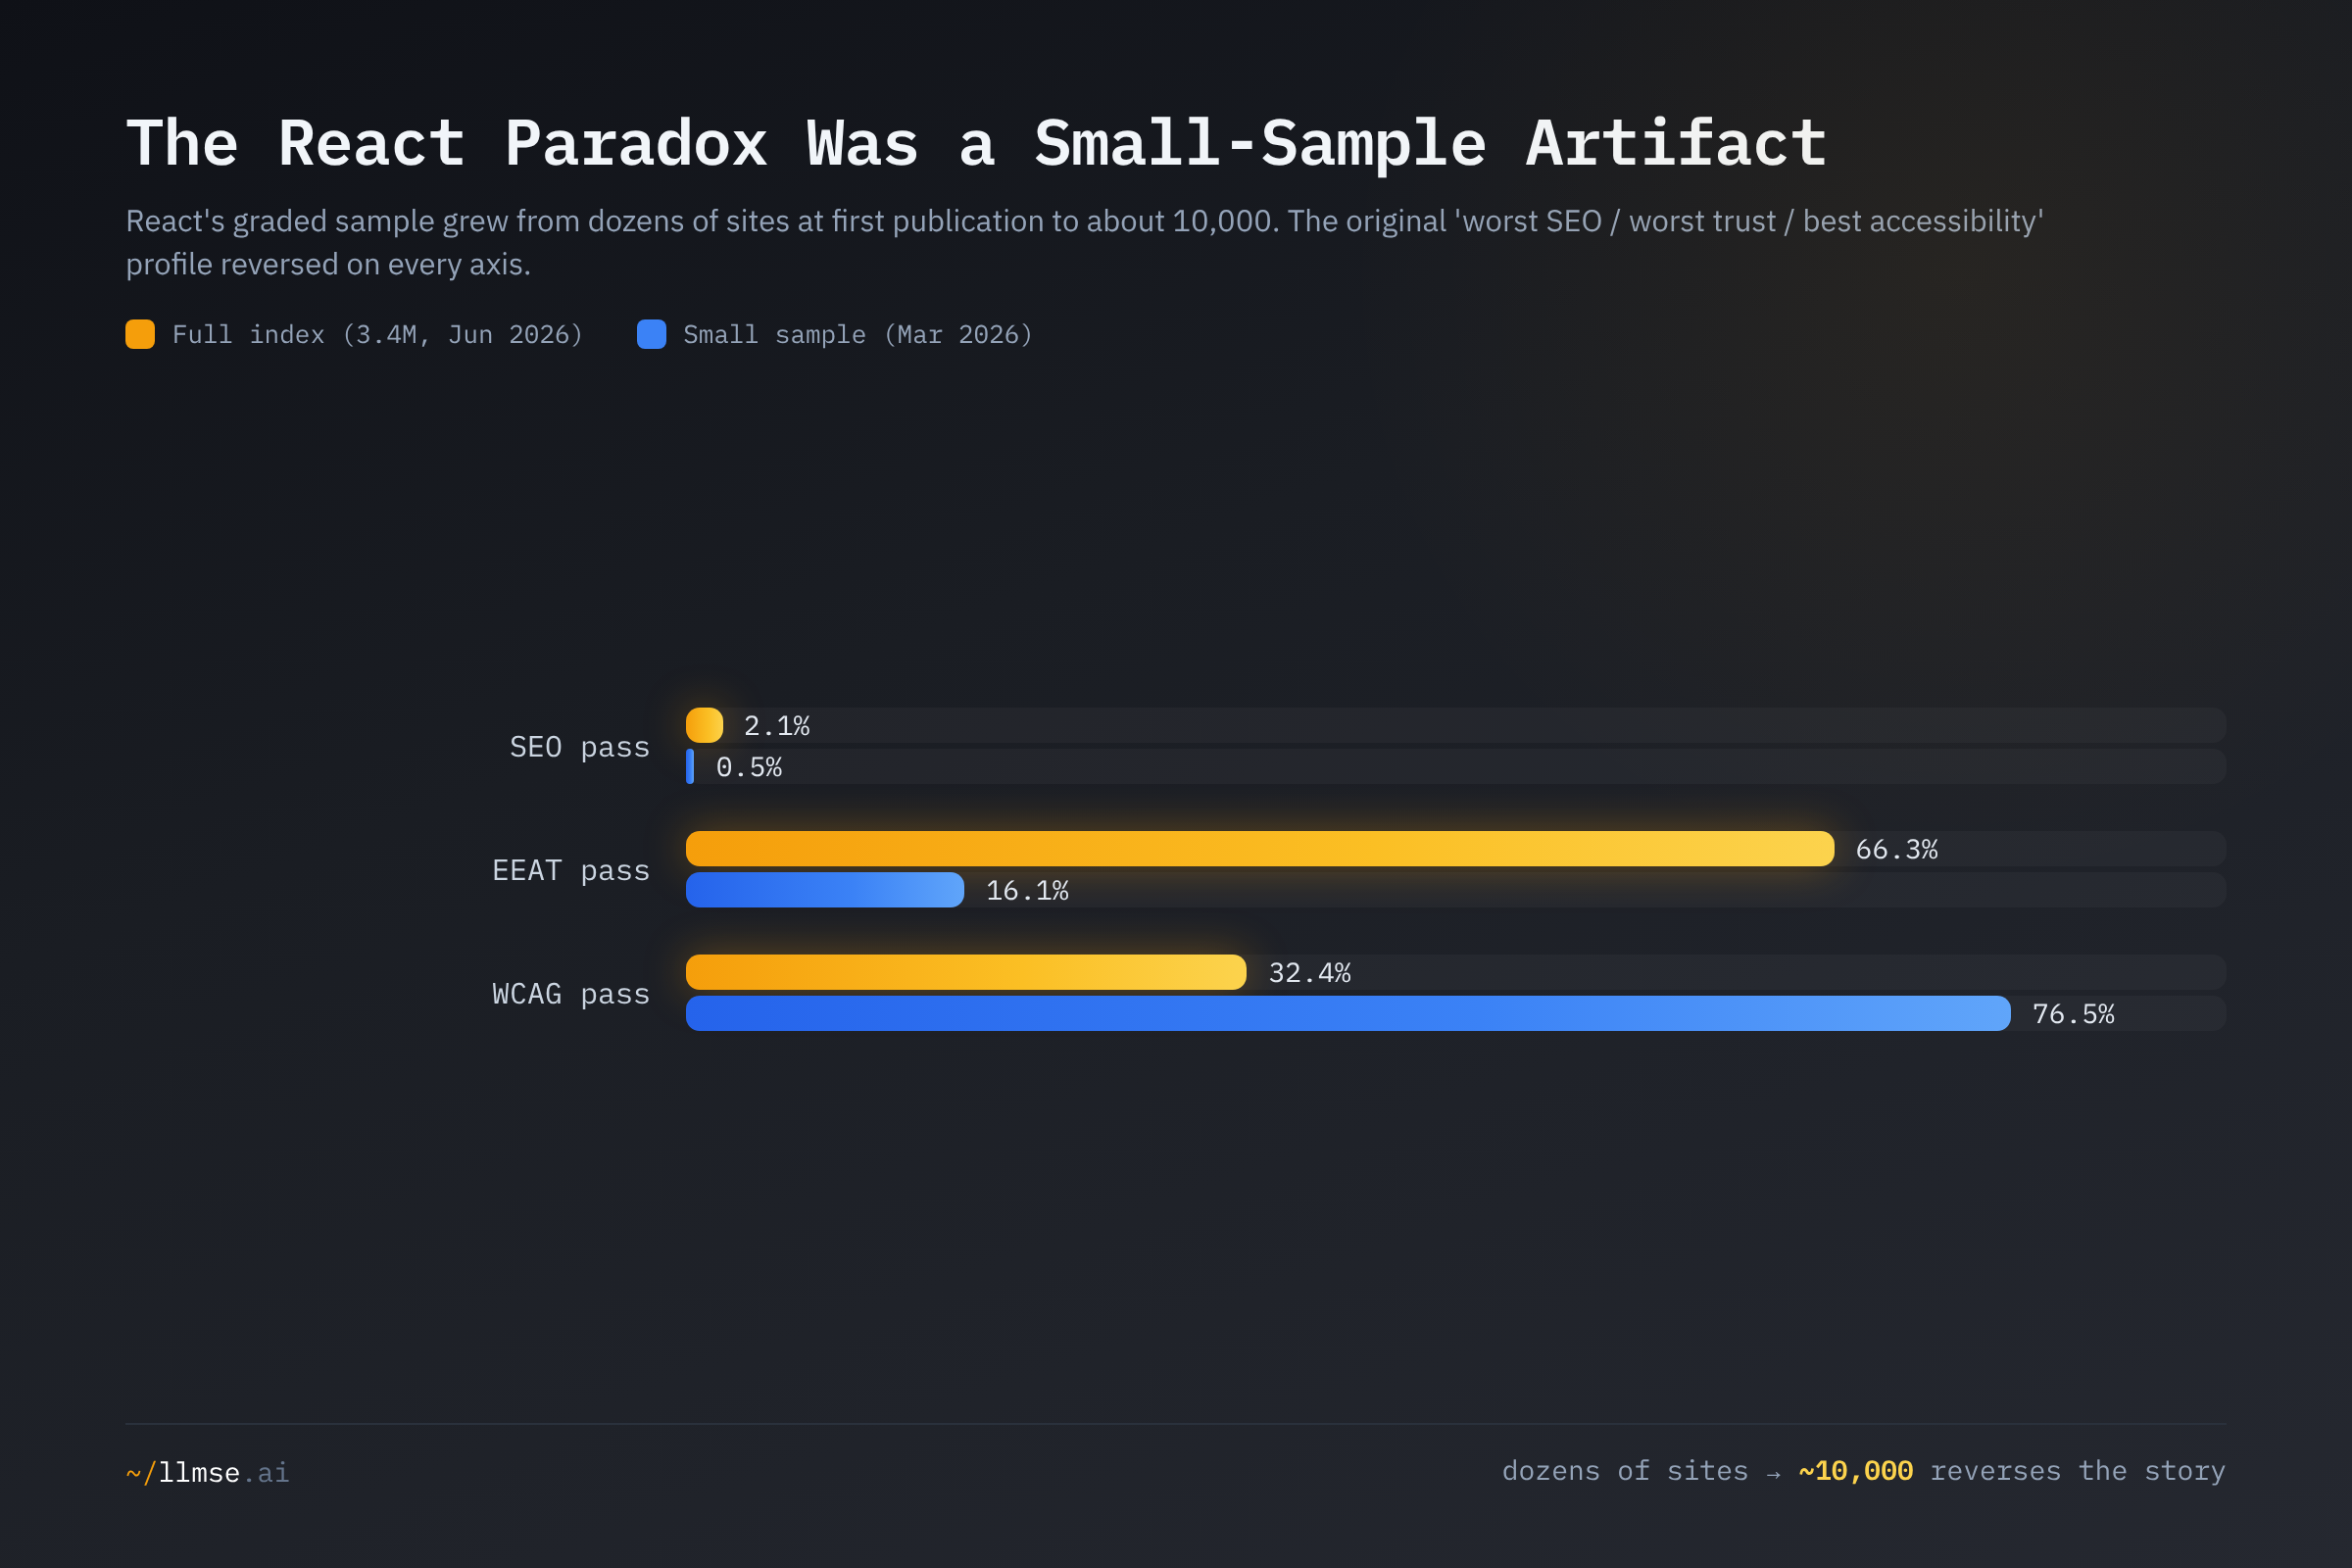
React now passes SEO at 2.1% (was 0.5%), EEAT at 66.3% (was 16.1%), and WCAG at just 32.4% (was 76.5%). It went from worst-on-SEO to mid-pack, from worst-on-trust to comfortably above the 45.4% web average, and from best-on-accessibility to below the 43.8% average. The "React builds inaccessible app shells with no content signals" narrative — and its mirror image, "but at least React nails accessibility" — were both artifacts of which few dozen sites happened to be graded first.
Two things are worth keeping from the wreckage, both hedged. React's readability remains genuinely low (16.6%, against a 32.8% average) — consistent with the fact that many React deployments are data-dense dashboards and applications rather than prose, which Flesch scoring penalizes. And React's AEO pass rate (3.0%) is double the web average — its component-and-API architecture tends to produce structured, extractable data that AI-answer graders reward, even when classic SEO suffers. Neither of these is a "paradox"; both are straightforward consequences of what React is typically used to build. The broader takeaway is methodological: a framework's quality profile cannot be read off a curated handful of sites, and the surprising version of any such finding deserves the most scrutiny.
Trust and Accessibility Track Content Type, Not Framework
Once discovery is set aside, the rendering ladder stops predicting anything. Trust (EEAT) is led by commerce and builder platforms, whose templates are built around exactly the signals EEAT measures.
| Dimension | Leaders | Laggards |
|---|---|---|
| EEAT (trust) | Shopify 91.8%, Webflow 86.6%, Drupal 65.6%, React 66.3% | Remix 28.1%, Nuxt.js 33.1%, Squarespace 33.8%, Ghost 33.6% |
| WCAG (accessibility) | Ghost 74.5%, Nuxt.js 63.8%, Gatsby 60.1%, Hugo 55.1%, Next.js 54.3% | OpenCart 5.9%, Shopify 26.4%, jQuery 31.1%, React 32.4%, Webflow 31.3% |
| Privacy | Shopify 76.9%, Webflow 69.2%, React 61.1%, Drupal 56.7% | Jekyll 4.4%, jQuery 19.2%, Hugo 19.9%, Squarespace 20.8% |
Shopify tops EEAT (91.8%), privacy (76.9%), and readability (52.5%) — not because of its rendering model but because e-commerce templates ship business identity, contact and returns pages, reviews, consent banners, and product copy as standard furniture. Webflow follows the same logic (86.6% EEAT, 69.2% privacy). These platforms cluster with the trust and privacy leaders we found across consumer industries, where Shopping was the trust, readability, and privacy champion.
Accessibility tracks whether a platform emits clean semantic HTML, and that does not map onto SPA-versus-SSG. Ghost (74.5%), the React-based Nuxt.js (63.8%) and Next.js (54.3%), and the static Gatsby (60.1%) all clear the bar; the same React component model passes accessibility at 54.3% inside Next.js but only 32.4% in client-only React deployments. The difference is the default output — server-rendered semantic markup versus a hydrated div — not the underlying library. The laggards span every type: OpenCart's product templates (5.9%), Shopify's image-and-widget product grids (26.4%), and the unmaintained jQuery web (31.1%). Because automated checks catch only a portion of WCAG criteria, these are best read as relative floors, but the spread is wide enough to be meaningful.
The privacy column is the cleanest refutation of the old "React is uniquely bad" story: React passes privacy at 61.1%, well above the 37.0% web average and above WordPress (47.2%) and every static generator. Jekyll, by contrast — a developer-documentation favorite — passes privacy at just 4.4%, because project and docs pages collect little and disclose less. Privacy maps to data sensitivity and platform purpose, not to framework brand.
jQuery: The Web's Largest Pool of Technical Debt
The single largest framework cohort in the index is also one of the weakest, and it is not a modern one. jQuery is detected on 299,324 sites — the most of any JavaScript library here, and roughly triple its footprint at first publication. That scale is corroborated externally: the 2024 HTTP Archive Web Almanac finds jQuery on about 74% of mobile pages, still "the most widely used library on the web," while React appears on around 10%.
jQuery trails the web average on five of six dimensions — SEO (0.7% vs 1.9%), AEO (0.1% vs 1.5%), EEAT (42.6% vs 45.4%), WCAG (31.1% vs 43.8%), and privacy (19.2% vs 37.0%) — passing only readability above average (43.5% vs 32.8%), a reflection of the older, prose-heavy content these sites tend to carry. The near-zero AEO rate (0.1%) is the starkest figure in the entire dataset: legacy sites are structurally invisible to AI answer engines.
jQuery does not cause poor quality; it correlates with sites that have not been rebuilt. jQuery is a 19-year-old library that ships on countless templates and unmaintained installs, so its cohort is dominated by older sites that predate structured data, consent frameworks, and modern accessibility practice. It is best read as a marker of platform era — a proxy for "last touched years ago" — and on that reading the era effect is enormous: the legacy web passes discovery at roughly a seventh of the static-generator rate.
Astro and the Shift Toward Static
The most-watched modern build tool, Astro, is now the largest in the index by detected footprint — ahead of Next.js. At 23,797 sites, Astro has overtaken Next.js (21,305), Jekyll (17,666), and every other static generator and meta-framework tracked here.
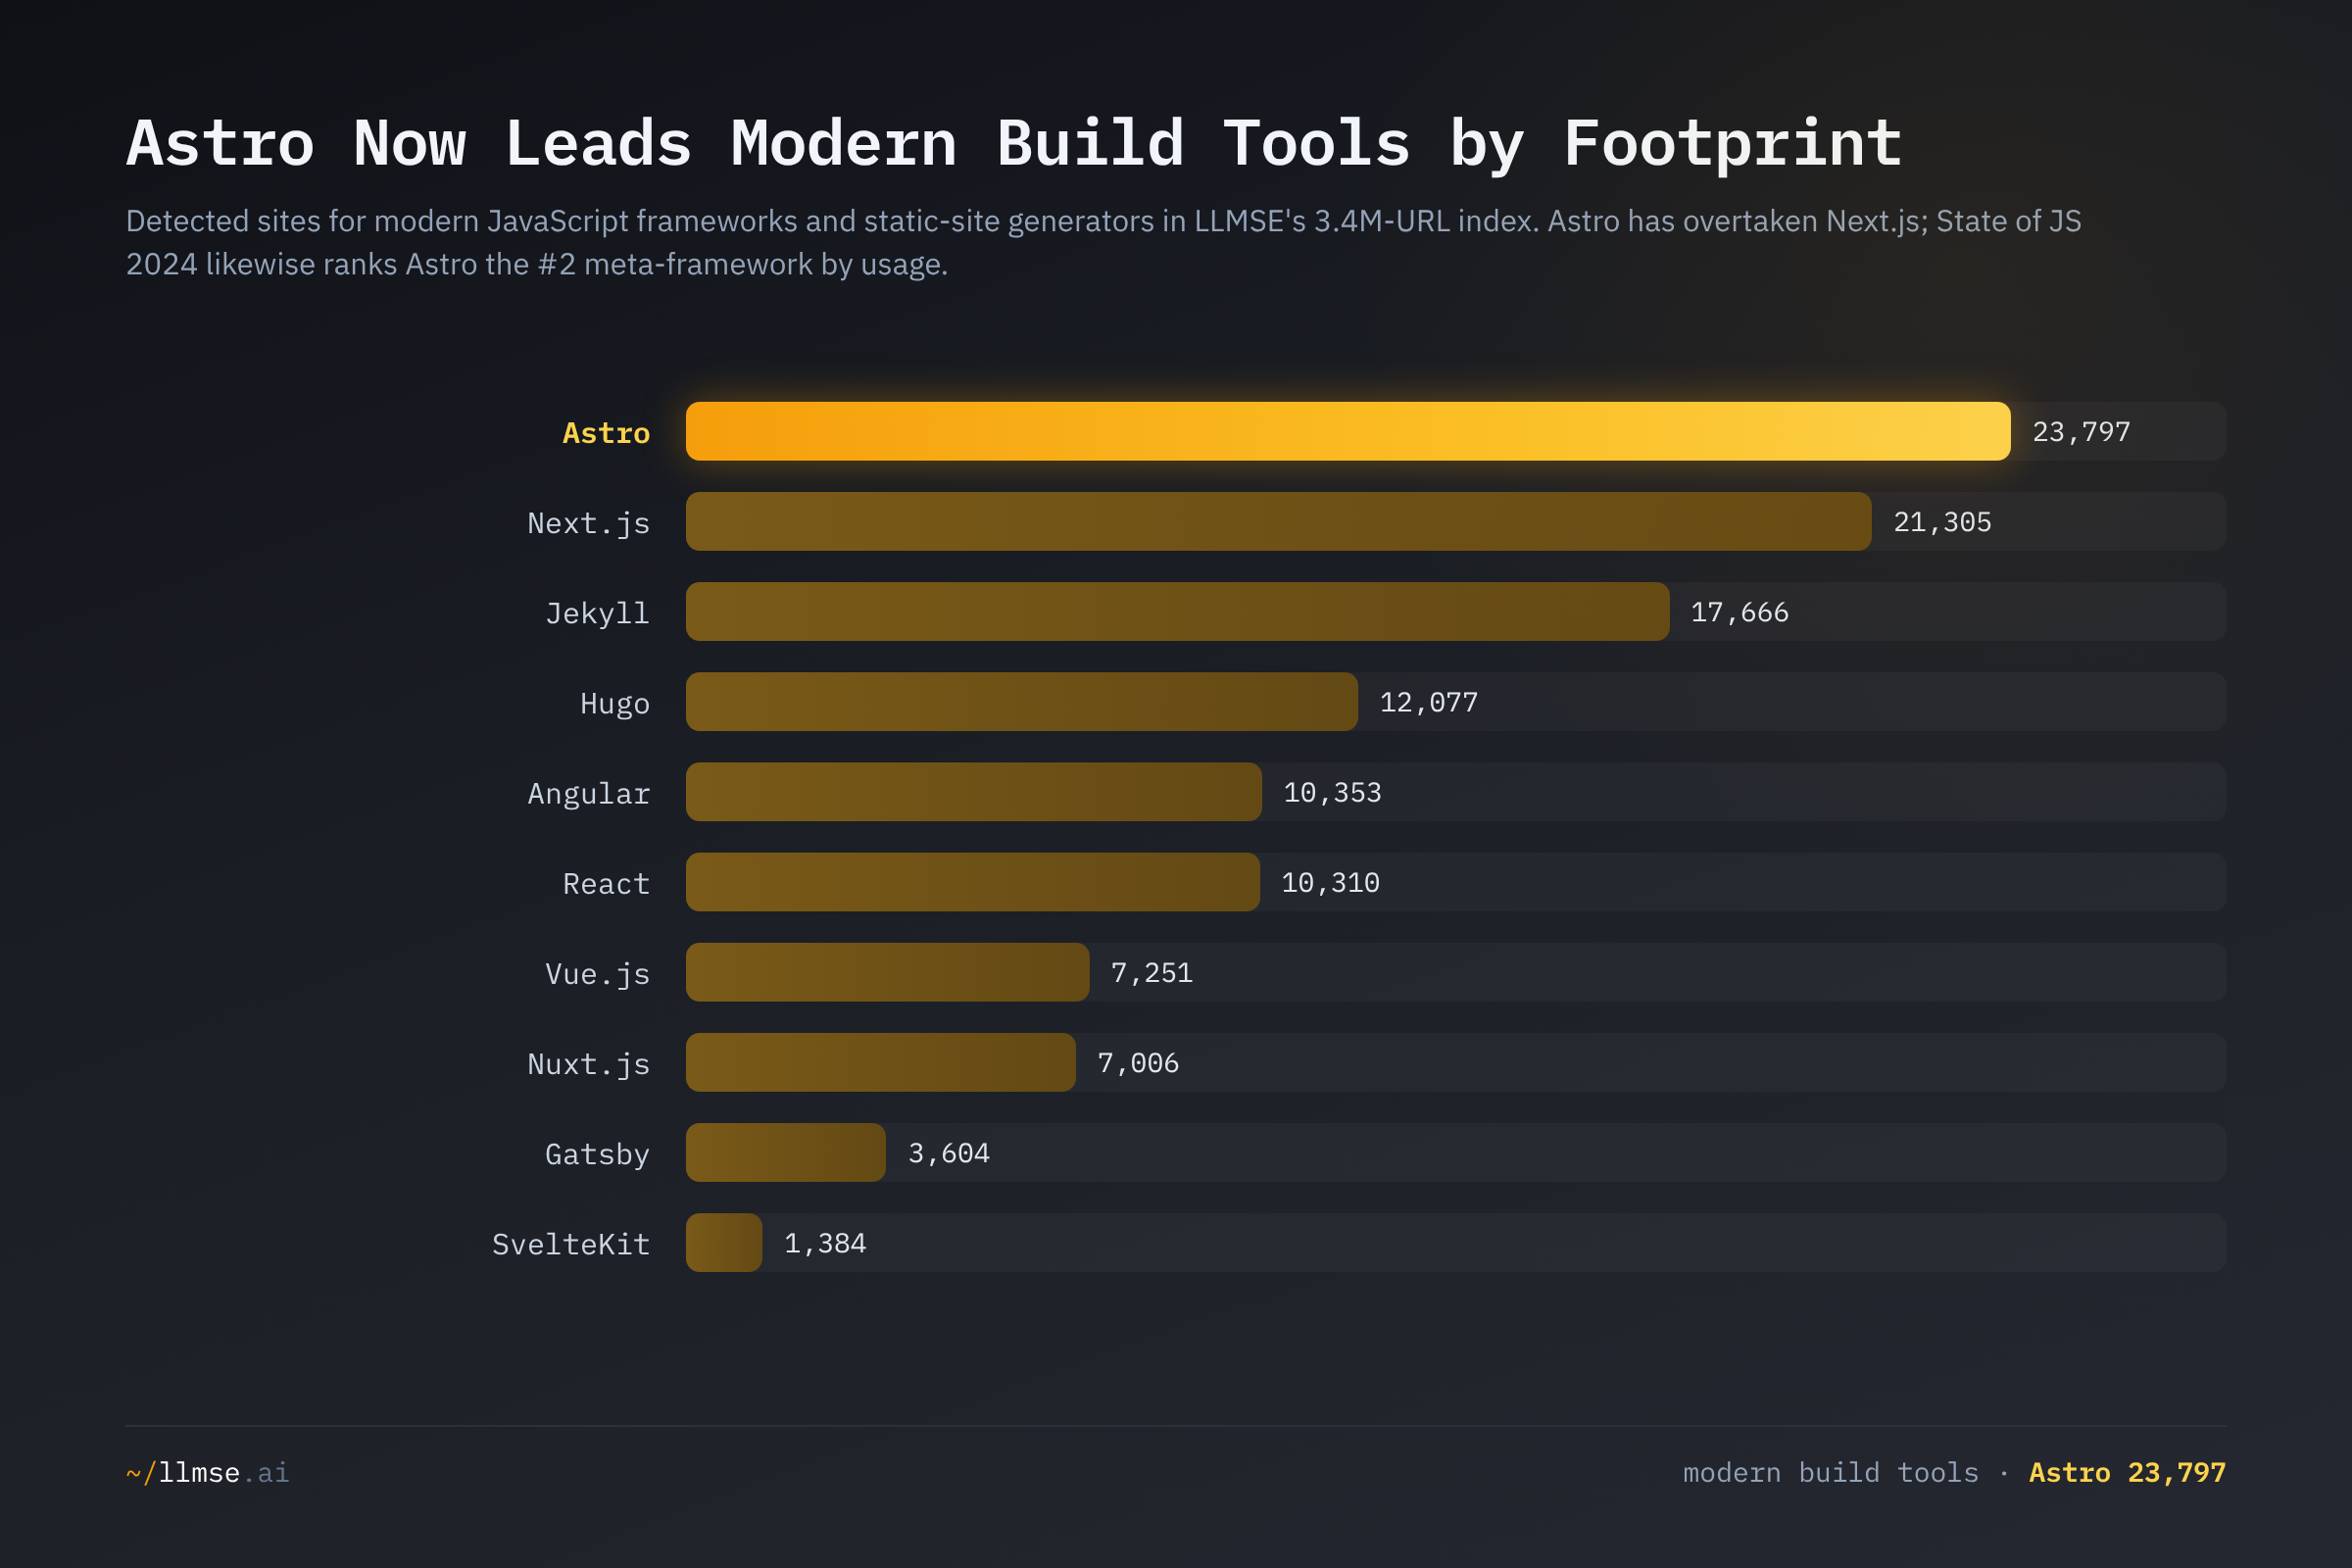
This is corroborated by independent survey data: State of JS 2024 ranked Astro the #1 meta-framework on interest, retention, and positivity, with usage rising from fourth to second place (behind only Next.js) and 94% of users saying they would use it again. Astro's architecture is the reason it fits the discovery thesis: it ships zero JavaScript by default and pre-renders static HTML, the output pattern that tops the SEO table — and indeed Astro passes SEO at 4.9%, in the leading SSG band.
This is a directional read, not a clean growth measurement. The index itself more than doubled (1.5M→3.4M) between the two snapshots, so part of Astro's raw rise reflects broader crawl coverage rather than adoption alone; detection counts sites, not projects, and methodology has shifted. What we can say firmly is cross-sectional: as of June 2026, Astro is the largest modern build-tool footprint in the index, and the external survey evidence is consistent with continued rapid adoption. Where the original post's other longitudinal asides went further than the data allowed, this one stops at the snapshot.
What's at Stake
- Discovery is decided before a line of content is written. A team's rendering choice — static, server-rendered, or client-only — predicts its SEO pass rate more strongly than any content decision, and the gap (SSG 4.7% vs SPA 2.0% vs legacy 0.7%) is structural. Teams shipping client-only SPAs for content that needs to be found are paying a discovery tax they often do not realize they have opted into.
- The legacy web is invisible to AI answers. jQuery-era sites pass AEO at 0.1%, against a 1.5% web average that is itself low. As AI answer engines replace blue links for more queries, the ~299,000-site legacy cohort — and the older content it represents — will be cited least, ceding the field to whoever has built extractable, structured pages.
- Accessibility is a default-output problem, not a framework problem. The same React component model passes WCAG at 54.3% server-rendered (Next.js) and 32.4% client-only — and commerce templates (Shopify 26.4%, OpenCart 5.9%) fail regardless of stack. With accessibility increasingly a legal exposure, the risk concentrates in image-and-widget commerce builders and unmaintained legacy sites, not in any one framework.
- Surprising small-sample findings are a trap. The original "React paradox" was widely shareable precisely because it was counterintuitive — and it was an artifact of dozens of sites. Quality claims about a technology need population-scale samples; a curated handful can invert the truth on every axis.
What Would Help
- Site owners: choose rendering by goal, not by hype. If a site must be found — marketing, publishing, documentation, commerce content — prefer static generation or server-side rendering, which pass SEO at 2-5x the client-only rate. Reserve client-only SPAs for genuine applications behind a login, where crawlability is not the point. Check where your own site lands at llmse.ai/classify.
- Front-end teams: server-render the content, hydrate the rest. The accessibility and SEO gaps between Next.js and client-only React, built on the same library, show that the output model is the lever. Adopt SSR or static export for content routes and treat full client-side rehydration as the exception, in line with Google's own rendering guidance and Core Web Vitals targets.
- Owners of jQuery-era sites: the cheapest quality win is a rebuild on a modern static stack. A 299,000-site cohort that fails discovery, AI-answer optimization, and privacy together is carrying technical debt that compounds as search shifts to AI answers. Migrating prose-heavy legacy sites to an SSG captures the SEO, AEO, and privacy gains at once.
- E-commerce and builder teams: fix accessibility before it becomes liability. Shopify (26.4%) and OpenCart (5.9%) lead trust and privacy but fail accessibility worst — image-heavy product grids, carousels, and custom widgets are exactly what automated checks flag. Semantic structure, alt text, and keyboard-navigable controls are the cheapest wins relative to the legal risk.
- Researchers and writers: demand population-scale samples. This post is a cautionary tale about its own first edition. Before publishing a framework-quality claim, confirm the graded sample is large enough to be a population, not a handful — every figure here is reproducible by cross-referencing LLMSE's grade and platform indices, and the cross-industry report card shows how the same method behaves at scale.
This analysis was conducted using LLMSE, which has classified over 3.4 million websites across SEO, EEAT, AEO, WCAG accessibility, readability, GARM brand safety, and privacy dimensions. Framework figures reflect the platforms detected in the index as of June 2026 (jQuery 299,324 sites; WordPress 1,060,974; React 10,310; Astro 23,797, among others). To analyze your own site across every dimension in this post, visit llmse.ai/classify.