The InfoSec Website Paradox: The Industry That Sells Trust Scores Worst on Demonstrating It
Update — 2026-06-29: Refreshed against LLMSE's current index of 3.4 million classified URLs (up from ~1.4M at first publication) and expanded from five graded dimensions to seven, adding AEO (AI-answer optimization) and Privacy. Numbers are restated under the standard pass definition (A+B+C, not the original's A+B), so the headline rates rise on paper — InfoSec SEO reads 1.0% here versus 0.29% in the original, EEAT 20.5% versus 9.0% — without the underlying sites improving. The core paradox holds and, if anything, sharpens: the security industry's own marketing sites are worst on the two things it sells — being found (SEO 1.0%, AEO 0.8%) and being trusted (EEAT 20.5%, 55% below the web). One correction: the original's "accessibility bright spot" does not survive the larger sample. On 784 graded sites InfoSec's WCAG F-rate looked like 20.8%; across 28,926 it is 43.7% — above the web's 38.0% — so accessibility is no longer a relative strength. Several curated CMS- and server-level sub-tables from the original were dropped in favor of reproducible aggregates.
"The cobbler's children have no shoes." It is a centuries-old proverb, and in cybersecurity it is a running joke. InfoSec companies spend their days auditing other organizations' security posture, publishing best-practice guides, and selling trust. Their entire business model depends on demonstrating experience, expertise, authority, and trustworthiness.
So what happens when you audit the auditors — not for security vulnerabilities, but for the quality of their own websites? The conventional intuition is that an industry staffed by technical professionals, selling to skeptical technical buyers, would build sites that are at least competently optimized and credibility-rich. Security buyers, after all, search for answers rather than brands, and organic search is the channel that converts.
The intuition does not survive contact with the data. We cross-referenced 29,398 domains classified under Computer & Electronics > Information & Network Security in LLMSE's index against seven graded dimensions — SEO, AEO, EEAT, WCAG accessibility, readability, privacy, and GARM brand safety — using the same automated graders applied uniformly across 3.4 million URLs, not a hand-picked sample of famous vendors. Then we benchmarked the results against the all-category web average and against the technology subcategories alongside it.
The results confirm the proverb. The industry that sells trust and being-found is measurably worse at both than the average website: EEAT (trust) passes at 20.5% against a 45.4% web average — 55% below — and technical SEO passes at just 1.0%, roughly half the web's already-dismal 1.9%. The one place security sites stand out cleanly is brand safety, where they score 100% — a reflection of how inoffensive professional security content is, not how well it is built.
The Data
The Information & Network Security subcategory spans the full spectrum of the industry: vendors selling security products, managed security service providers, vulnerability databases, threat-intelligence firms, security-research blogs, and industry organizations. A smaller adjacent bucket, "Computer Security" (2,079 sites), sits beside it; this analysis focuses on the larger subcategory. Every grade below comes from LLMSE's automated pipeline applied to the population actually graded on each dimension — denominators differ because not every URL carries every grade.
| Dimension | InfoSec sites graded | InfoSec pass rate | Web average |
|---|---|---|---|
| SEO | 29,222 | 1.0% | 1.9% |
| AEO (AI answers) | 28,887 | 0.8% | 1.5% |
| EEAT (trust) | 29,159 | 20.5% | 45.4% |
| WCAG (accessibility) | 28,926 | 41.0% | 43.8% |
| Readability | 28,928 | 21.3% | 32.8% |
| Privacy | 28,870 | 39.2% | 37.0% |
| GARM (A / brand-safe) | 25,016 | 100.0% | 90.2% |
InfoSec sits below the web average on five of six quality dimensions, level-to-slightly-above only on privacy, and clears the web only on brand safety. English dominates the subcategory (23,725 sites, roughly 81% of the category, with German, Chinese, and French trailing far behind at 2.3%, 1.8%, and 1.6%) — consistent with cybersecurity tooling, CVE disclosures, and the industry's conference circuit being overwhelmingly English-language. Sentiment skews positive (Good 93.8%, Neutral 5.7%, Bad 0.5% of graded sites): there is little emotionally charged content in explaining how firewalls work.
One demographic note, with a caveat. Every Information & Network Security site that LLMSE tags with an audience is tagged male and aged 25–44 — uniformly, with zero female-targeted or all-audience tags. The original read this as the most gender-skewed category in the database. We treat it more cautiously here: the perfect uniformity (the male and 25–44 counts are identical to the graded total) indicates a single category-level demographic label the classifier infers for security content, not a per-site measurement. It says the model reads cybersecurity as written for a young-to-middle-aged male technical audience — which, if accurate, is itself a finding about who security marketing is built for — but it should not be read as a site-by-site census.
Methodology
This post makes quantitative claims, so definitions and limits matter.
- Grades and "pass." Each site is graded A–F by a dedicated automated analyzer (there is no E grade). "Pass" means A+B+C for SEO, AEO, EEAT, WCAG, and Privacy, and A+B for Readability (a Flesch Reading Ease score of roughly 50+, ≈ 8th-grade level or below). GARM "brand-safe" means A only. SEO grades technical fundamentals; AEO grades answer-extractability and AI-citation signals; EEAT grades experience/expertise/authoritativeness/trust signals; WCAG covers automated accessibility checks (~30–40% of WCAG 2.1 Level A — manual testing is required for full conformance); Privacy grades consent gating, policy presence, and tracker behavior; GARM maps content to the brand-suitability framework.
- Classification basis. Subcategory membership is by LLM classification; each grade is an independent automated analyzer. Where a check is heuristic (notably WCAG, which is static-HTML only), the coverage caveat above applies.
- Cross-references are computed as set intersections (Redis
ZINTERCARD) between the subcategory index and each grade or peer-category index. All counts are aggregate; no individual site is identified. - Known limits. Pass rates are over graded populations, which are smaller than the raw subcategory size (29,398). The Readability grade uses Flesch scoring, calibrated for English, so it understates readability for the non-English minority; treat readability as indicative. Counts are a live snapshot and drift as classification continues. Russian-language sites are excluded from all aggregates.
- Why these numbers differ from the 2026-03 original. Three things changed. First, the pass definition. The original reported SEO and EEAT "pass" as A+B only (0.29% and 9.0%); the current standard, used across all LLMSE posts, is A+B+C — which is why SEO now reads 1.0% and EEAT 20.5%. That is a definitional restatement, not site improvement; on a like-for-like A+B basis the figures are essentially unchanged (SEO A+B is 0.18%, EEAT A+B 7.7%). Second, the dataset grew from ~1.4M to ~3.4M URLs, and early grades skewed toward higher-quality, more-visible sites, so absolute web baselines fell a few points as coverage broadened. Third, sample size. The original computed WCAG over just 784 graded InfoSec sites and readability over 832; both are now near 29,000. The small early samples are exactly where the original's conclusions moved most — see the accessibility correction below.
The Scorecard
Plotting InfoSec against the all-category web average across every quality dimension produces a consistent, unflattering shape: a sector below the line almost everywhere, with the deepest gaps on the two axes the industry is supposed to own.
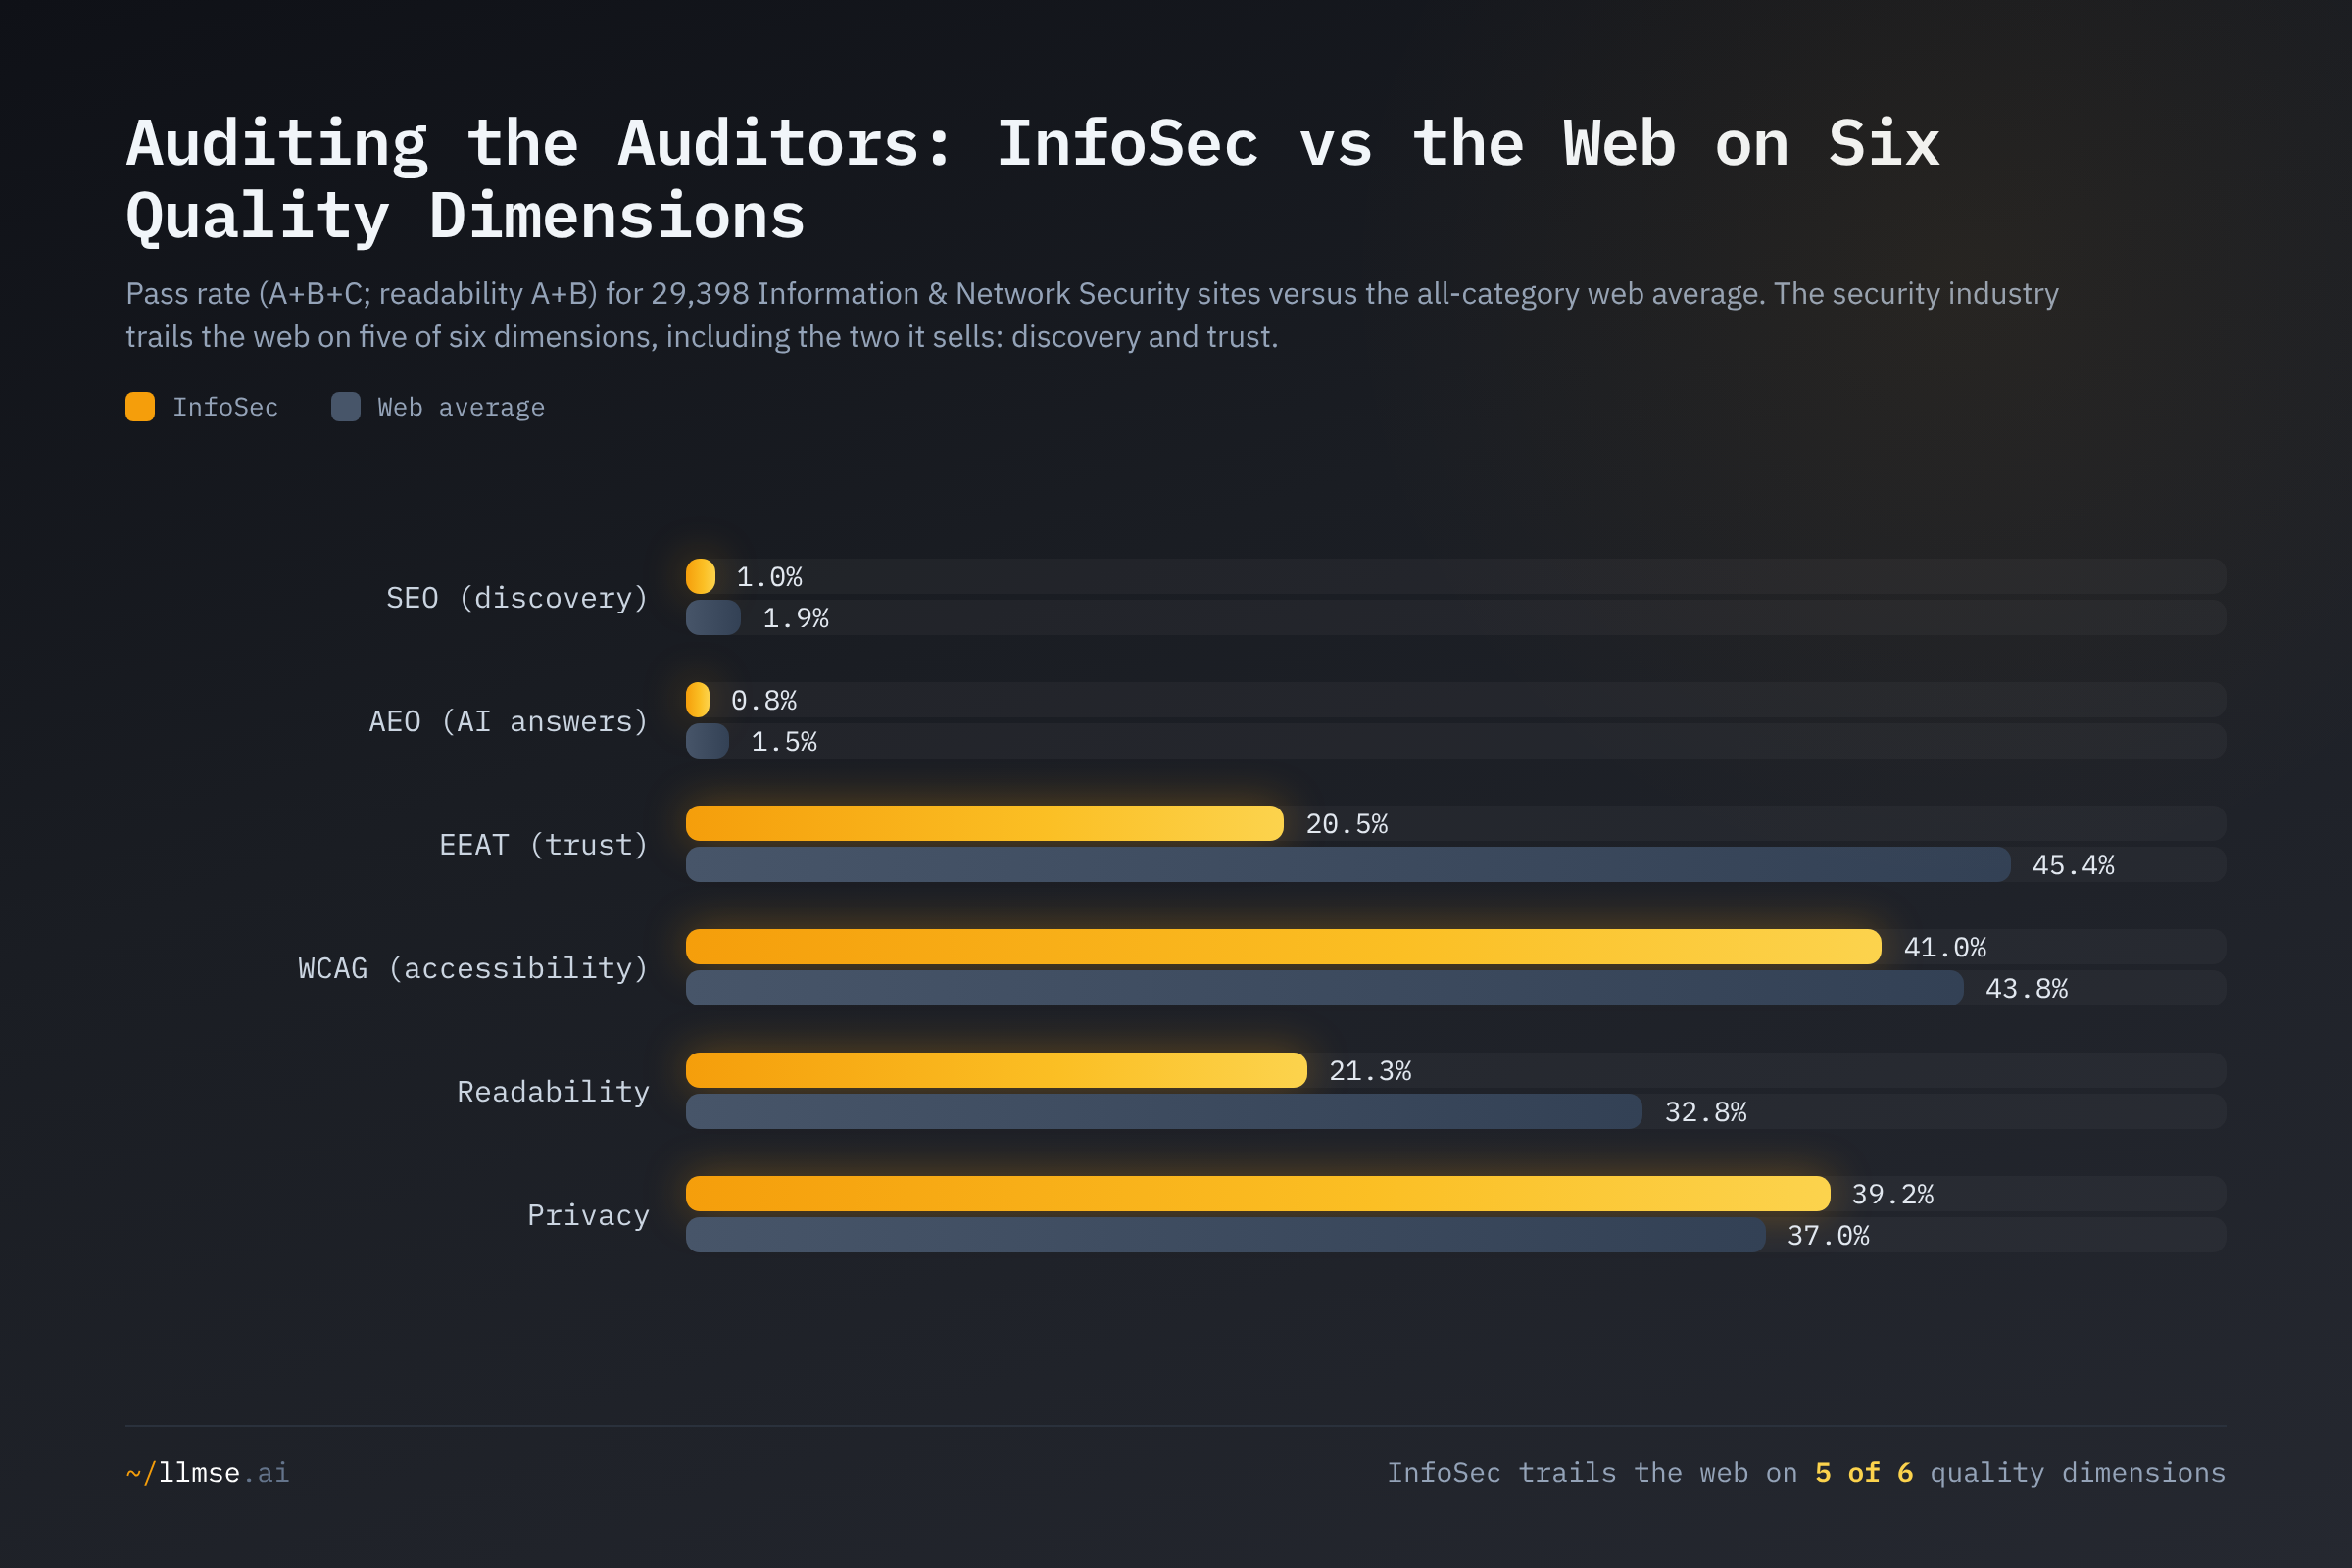
Information & Network Security is below the web average on five of six quality dimensions — and the two it trails most are discovery (SEO, AEO) and trust (EEAT), the exact capabilities the industry sells. This is the tell. A sector that merely neglected marketing would scatter randomly around the web average. Instead the deficits concentrate where they are most ironic: a 55% trust gap and a discovery rate at roughly half the web. The single dimension where InfoSec edges ahead, privacy (39.2% vs 37.0%), is a marginal lead, not a strength — and it is the one dimension where you would most expect security companies to excel. The rest of this report is the story of those gaps, and of the one bright spot that the original found and the larger sample erased.
SEO: The Industry Built on Being Found, Isn't
At a 1.0% pass rate, Information & Network Security clears technical SEO at roughly half the 1.9% web average. The grade distribution is brutal: 97.0% of graded security sites score F, a higher failure rate than the already-dismal 94.5% web F-rate. Only two sites in 29,222 earn an A.
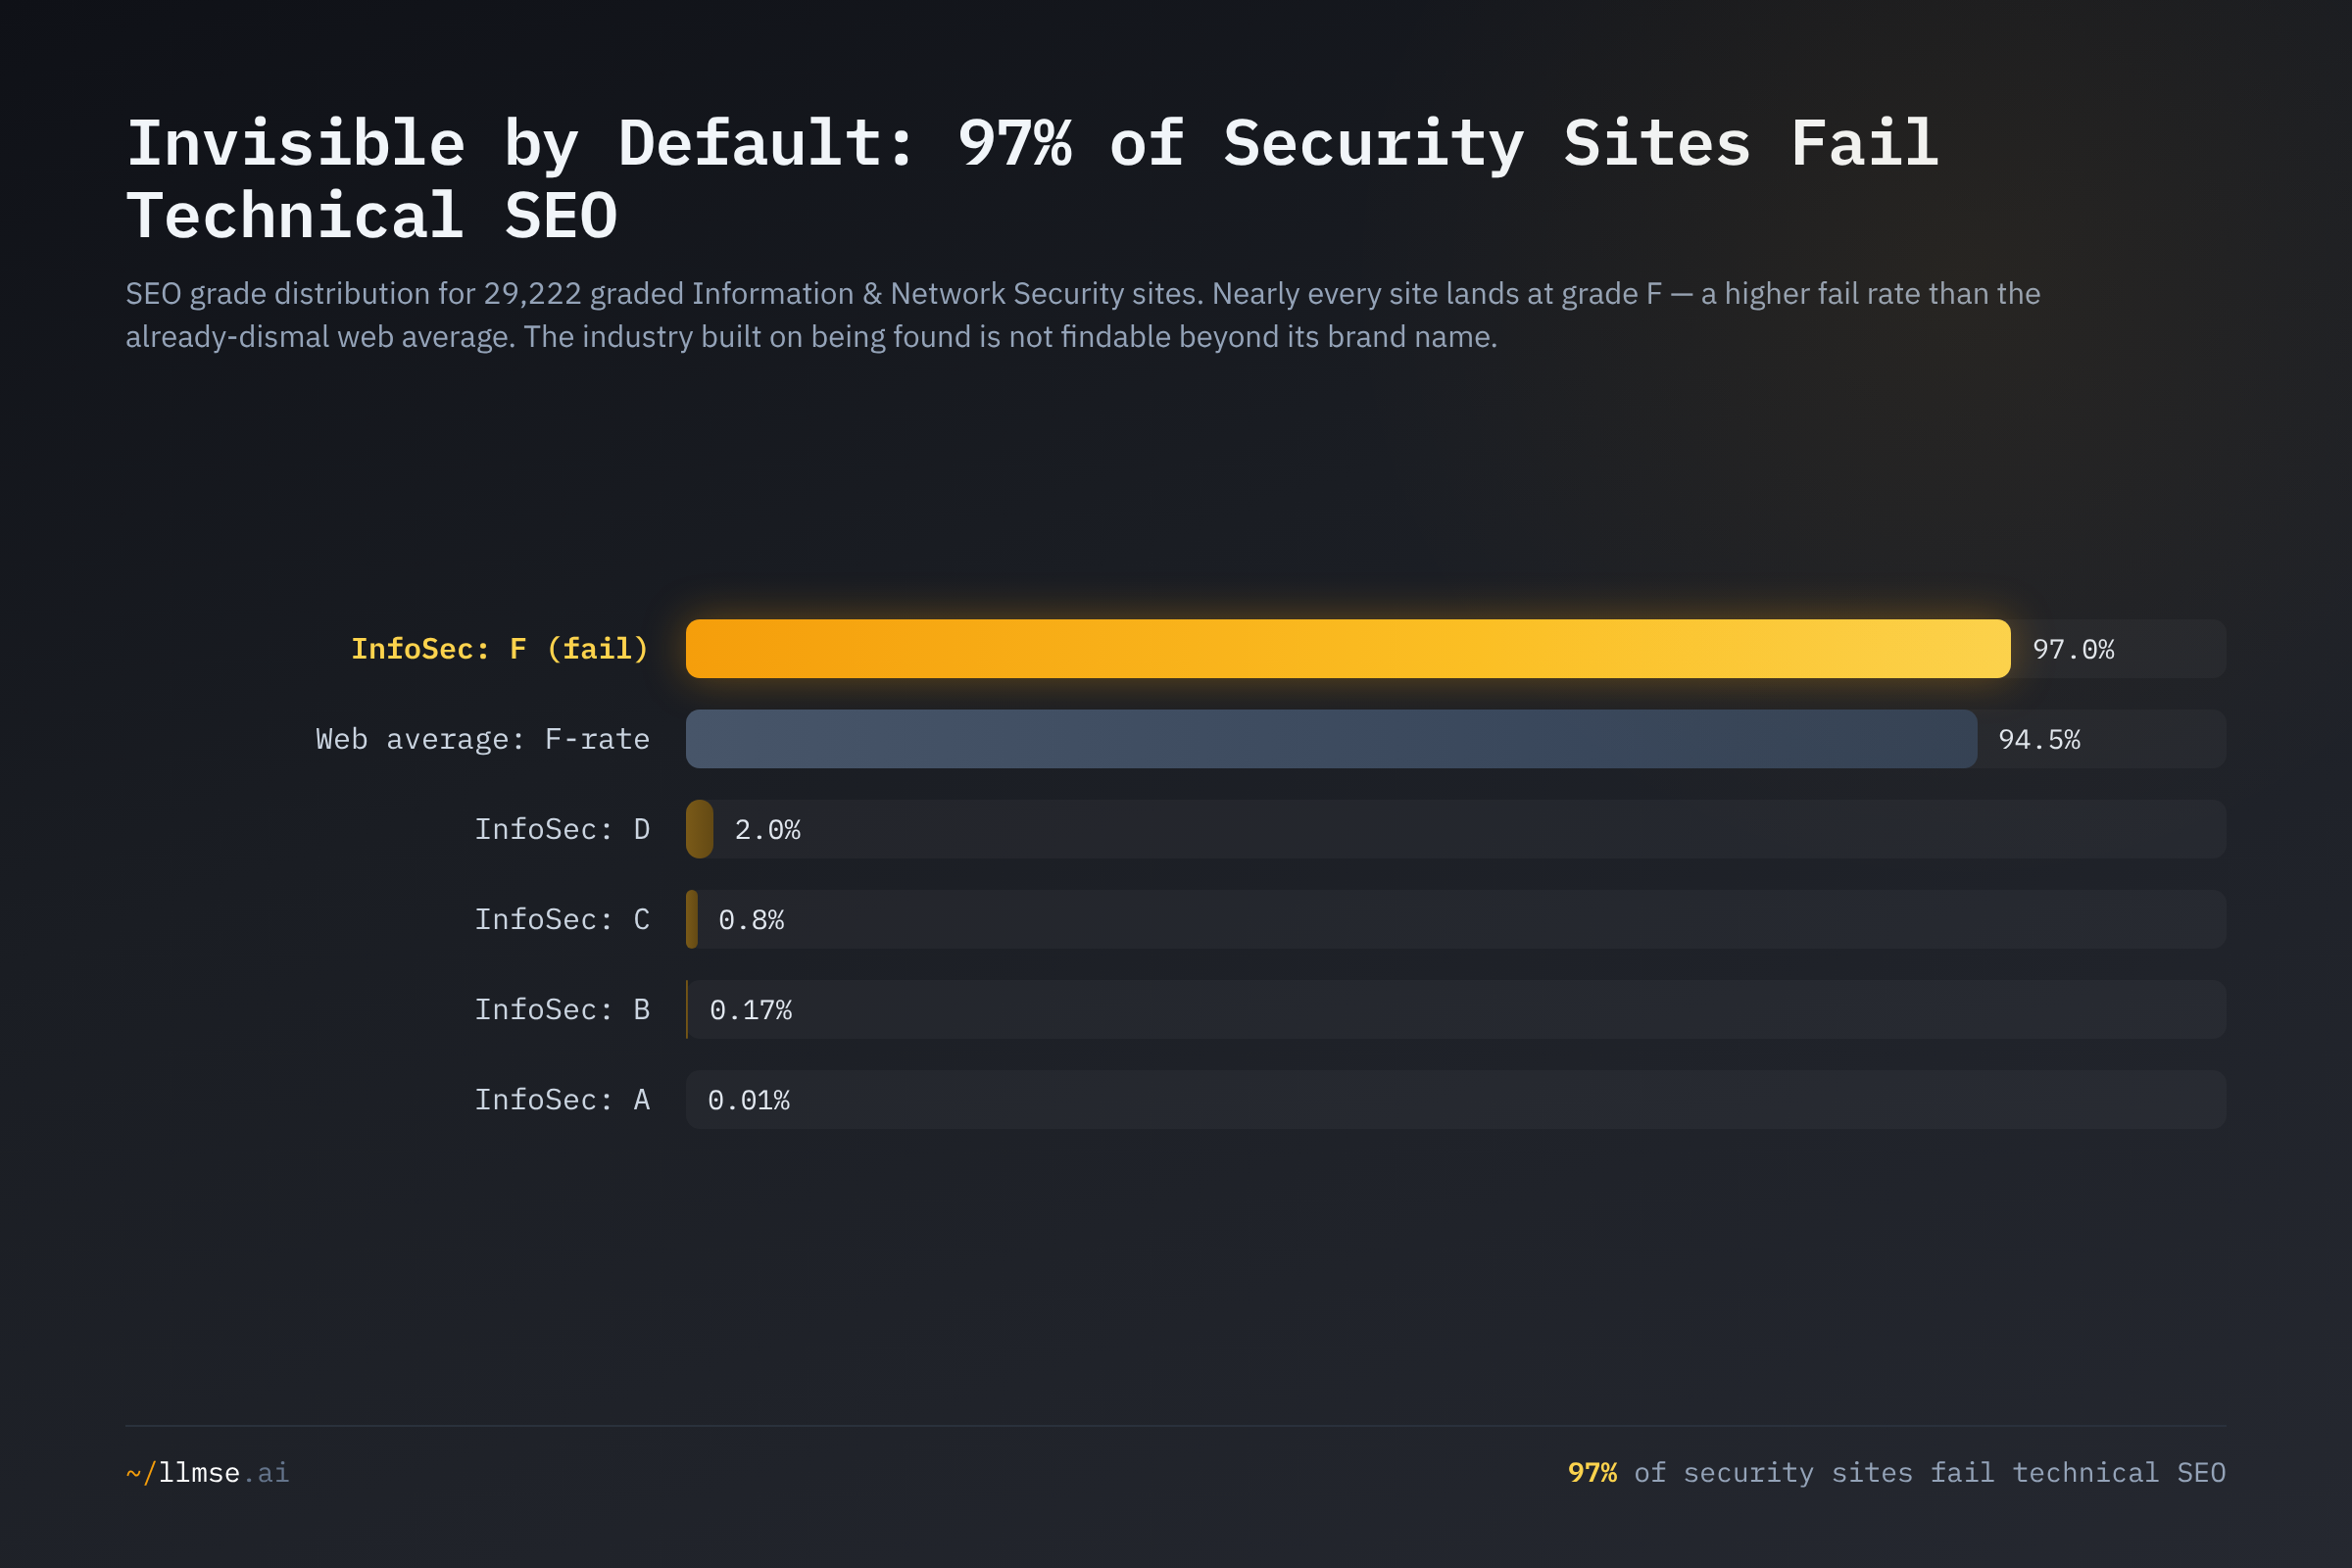
For nearly every cybersecurity company, the website is effectively invisible to search beyond its brand name. Search someone for "endpoint detection and response," "zero trust architecture," or "SIEM vs SOAR," and most InfoSec vendors' pages do not meet the basic structural requirements — clean titles and meta descriptions, crawlable structure, valid canonicals — to compete. This matters more here than almost anywhere, because security buyers behave differently from brand-led consumers: industry benchmarks describe cybersecurity as a market where organic search drives roughly 48.5% of traffic and "buyers search for answers, not brands," against a 6–12 month enterprise sales cycle. An industry whose customers research before they will talk to a salesperson, that fails technical SEO at 97%, is conceding the channel that matters most.
The technology sector as a whole is bad at this — the parent Computer & Electronics category also passes SEO at 1.0% — so InfoSec is not uniquely incompetent. But "no worse than the rest of tech" is not the bar for an industry that builds web infrastructure for a living. We frame the mechanism as a plausible explanation, not a proven cause: security firms appear to invest their web budgets in product, conferences, and paid channels, and treat organic discoverability as an afterthought — the same neglect that lets penetration-testing firms run unpatched WordPress and threat-intelligence companies let SSL certificates expire.
AEO: Conceding the AI-Answer Channel Too
If SEO is the established game, AEO — getting content surfaced and cited by AI answer engines like ChatGPT, Perplexity, and Google's AI Overviews — is the emerging one, and InfoSec is no better positioned for it. AEO passes at just 0.8%, against a 1.5% web average — again roughly half. AEO rewards exactly the assets a credible security vendor should produce in abundance: direct, extractable answers, comparison tables, statistics, source citations, and complete Organization/Article/Author schema. A Princeton-led study (KDD 2024) found that adding citations, quotations, and statistics can lift a source's visibility in generative-engine answers by up to 40%. The security industry, which trades in exactly this kind of evidence-backed content, is not packaging it in the forms AI answer engines can lift — leaving the field to whoever does. The broader pattern is documented in The AI Citation Readiness Gap; InfoSec sits on the wrong side of it.
EEAT: The Trust Paradox, Stated Plainly
This is where the paradox becomes undeniable. Information & Network Security passes EEAT at 20.5%, against a 45.4% web average — a 55% relative deficit. The companies that publish threat-landscape whitepapers, hire PhDs in cryptography, and present at Black Hat communicate experience, expertise, authority, and trust through their own websites less effectively than the average retailer or recipe blog.
The grade distribution shows how they fail. InfoSec EEAT collapses into a single grade: 76.2% of graded sites score D, versus 47.3% web-wide, with correspondingly fewer A, B, and C grades.
| Grade | InfoSec | Web average |
|---|---|---|
| A | 1.9% | 5.5% |
| B | 5.8% | 16.0% |
| C | 12.9% | 23.9% |
| D | 76.2% | 47.3% |
| F | 3.2% | 7.3% |
A D is not a catastrophic failure — it is "present but minimal." The pages exist, but the signals an automated rater reads as authoritative are thin: anonymous or absent author credentials, missing Organization schema, sparse editorial transparency, weak source citation. This matters because security is unambiguously a "Your Money or Your Life" (YMYL) topic in Google's framework — content that "could significantly impact the health, financial stability, or safety" of users. Google's own guidance is explicit that, of the four E-E-A-T components, "trust is most important", and that YMYL topics receive heightened scrutiny — a bar set out in detail in the Search Quality Rater Guidelines. The industry whose product is trust is, by the measure search engines use, demonstrating the least of it where it counts most.
Set against its technology peers, InfoSec is mid-pack — not, as an earlier read of a smaller sample suggested, the trust leader of the tech sector.
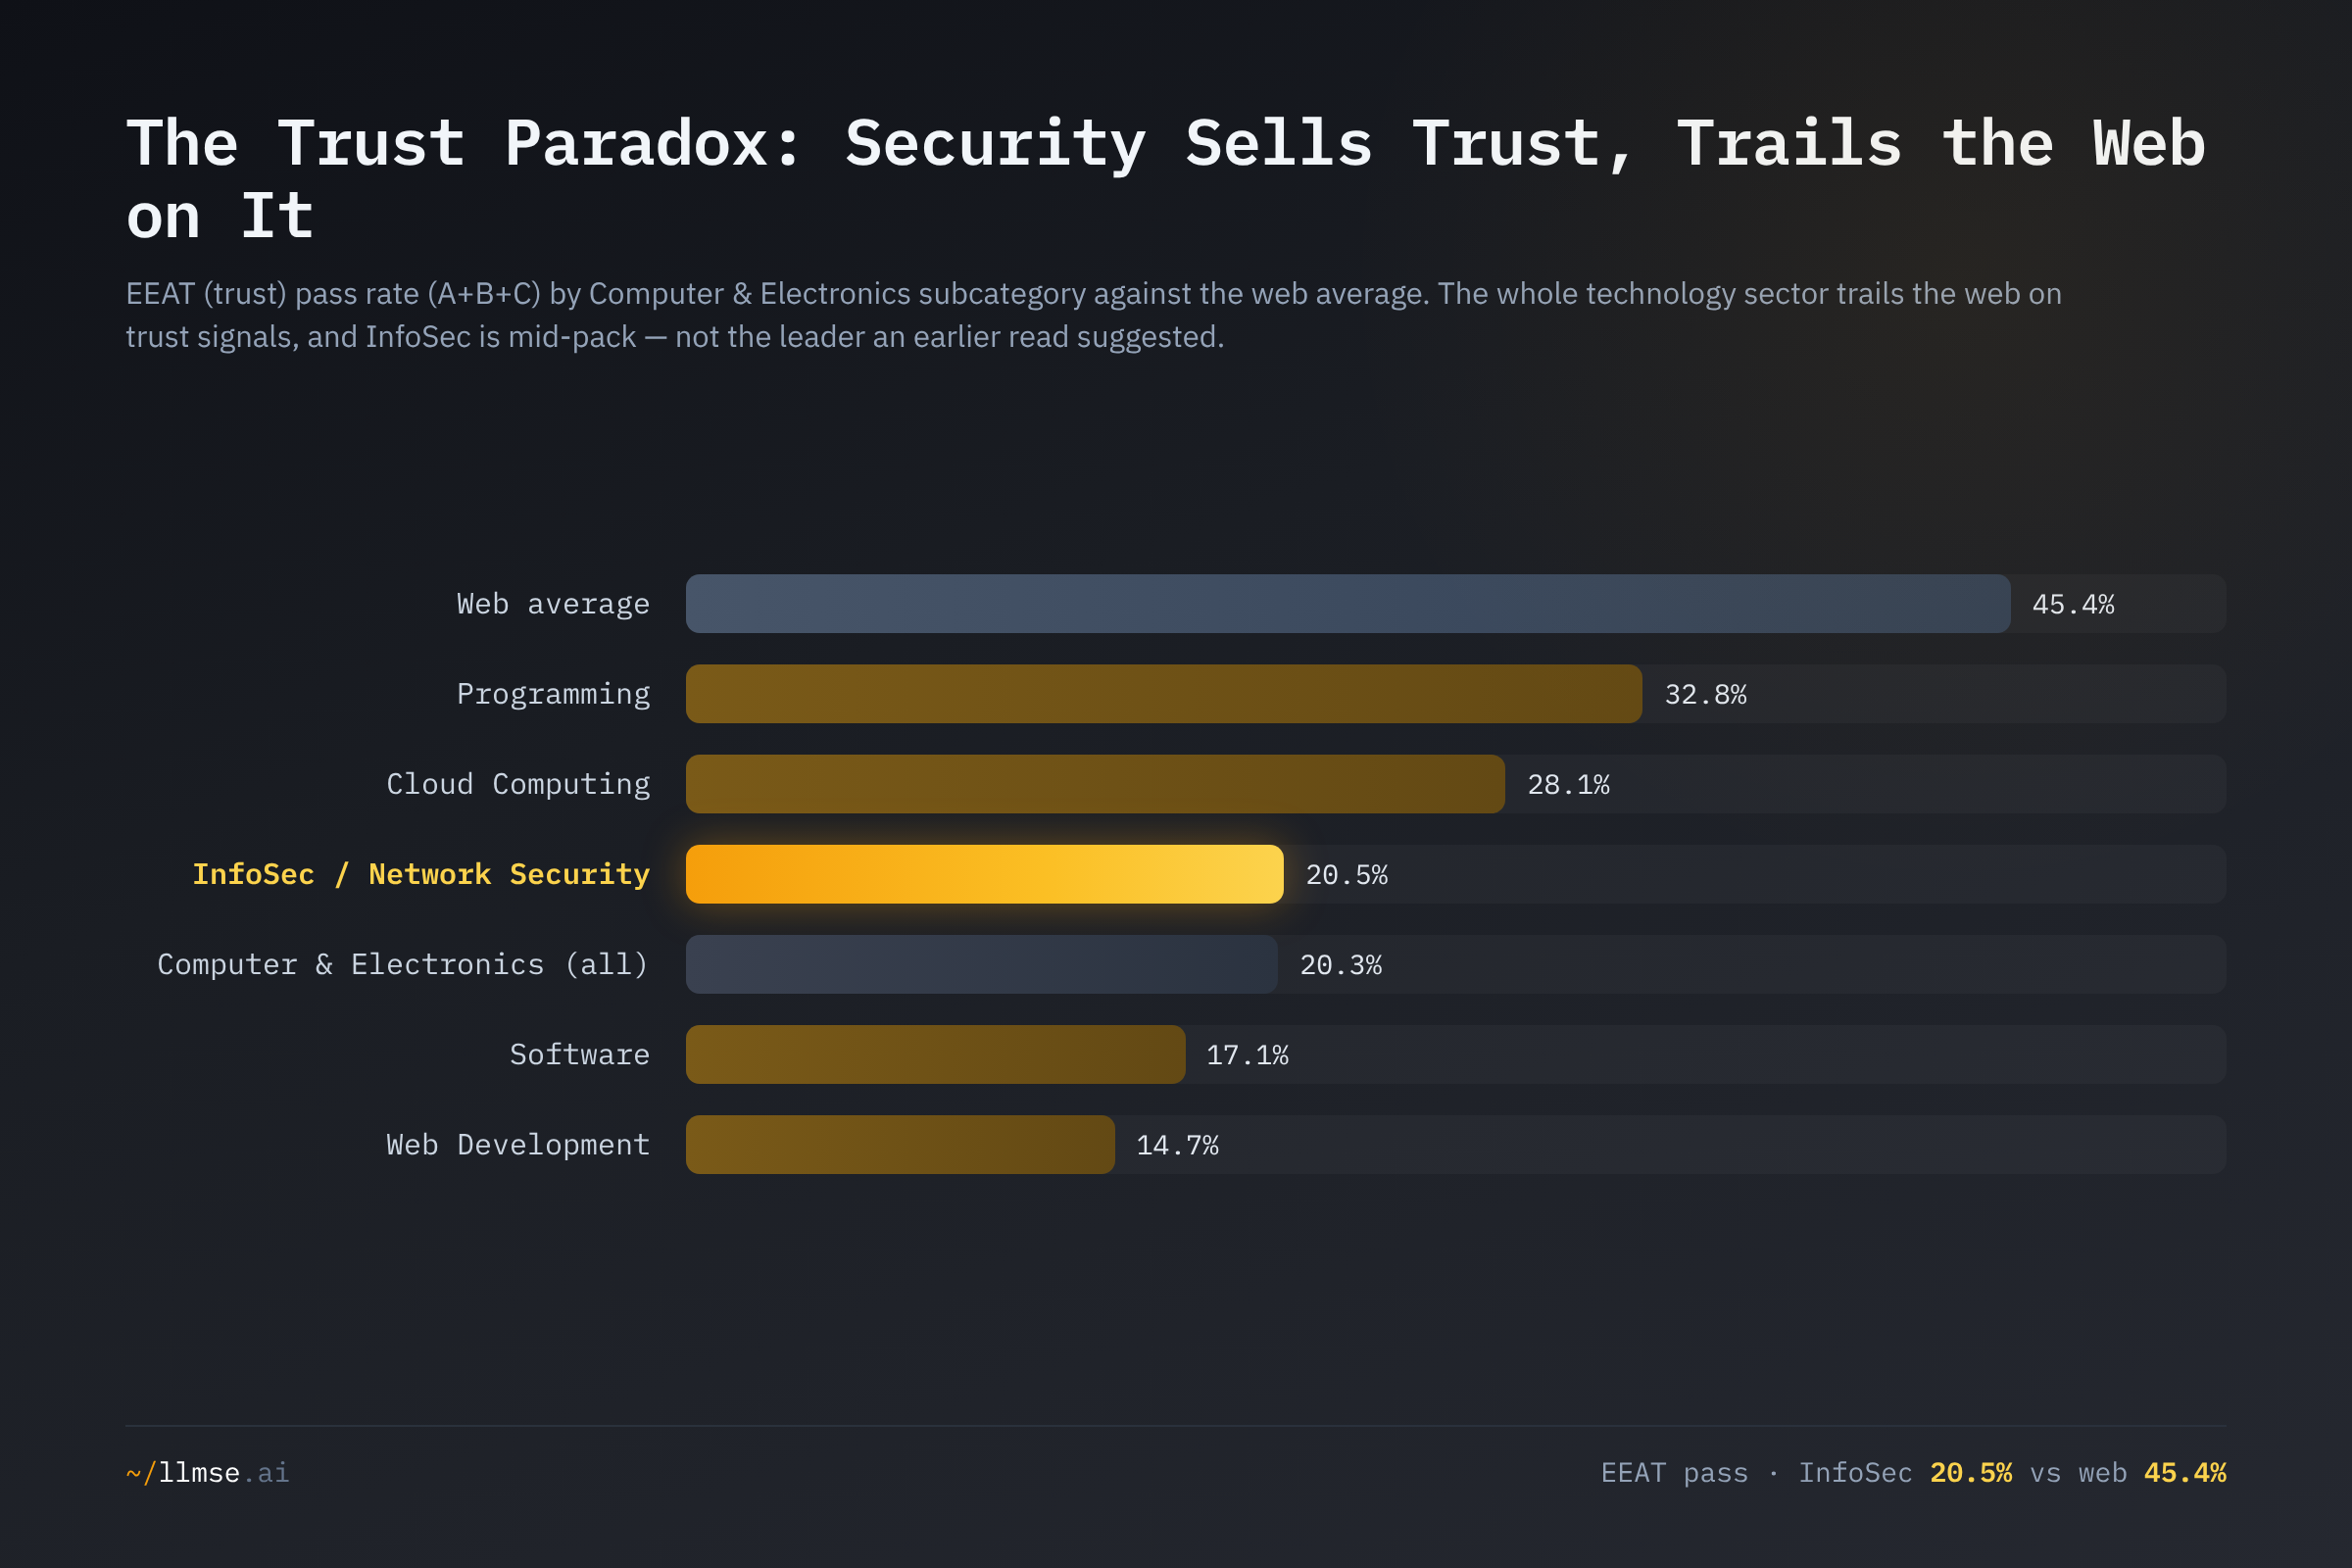
Programming (32.8%) and Cloud Computing (28.1%) clear EEAT more often than InfoSec (20.5%), while Software (17.1%) and Web Development (14.7%) trail it — and every one of them is far below the 45.4% web average. The original claimed InfoSec had the highest EEAT pass rate in tech; on the current, far larger sample that is no longer true. The honest finding is narrower and harder: the entire technology sector under-communicates trust, and the security subcategory is unremarkable within it. Selling trust as a product evidently does not translate into demonstrating it on your own marketing site.
WCAG Accessibility: The Bright Spot That Wasn't
The original post's one consolation was accessibility — the single dimension where InfoSec appeared to beat the web. That finding does not survive the larger sample, and the correction is worth showing in full, because it is a clean case study in how small early samples mislead.
In the original, WCAG was graded over just 784 InfoSec sites, of which 20.8% scored F — below the then-web F-rate, which read as a modest edge. Across 28,926 graded sites today, the F-rate is 43.7%, above the web's 38.0%.
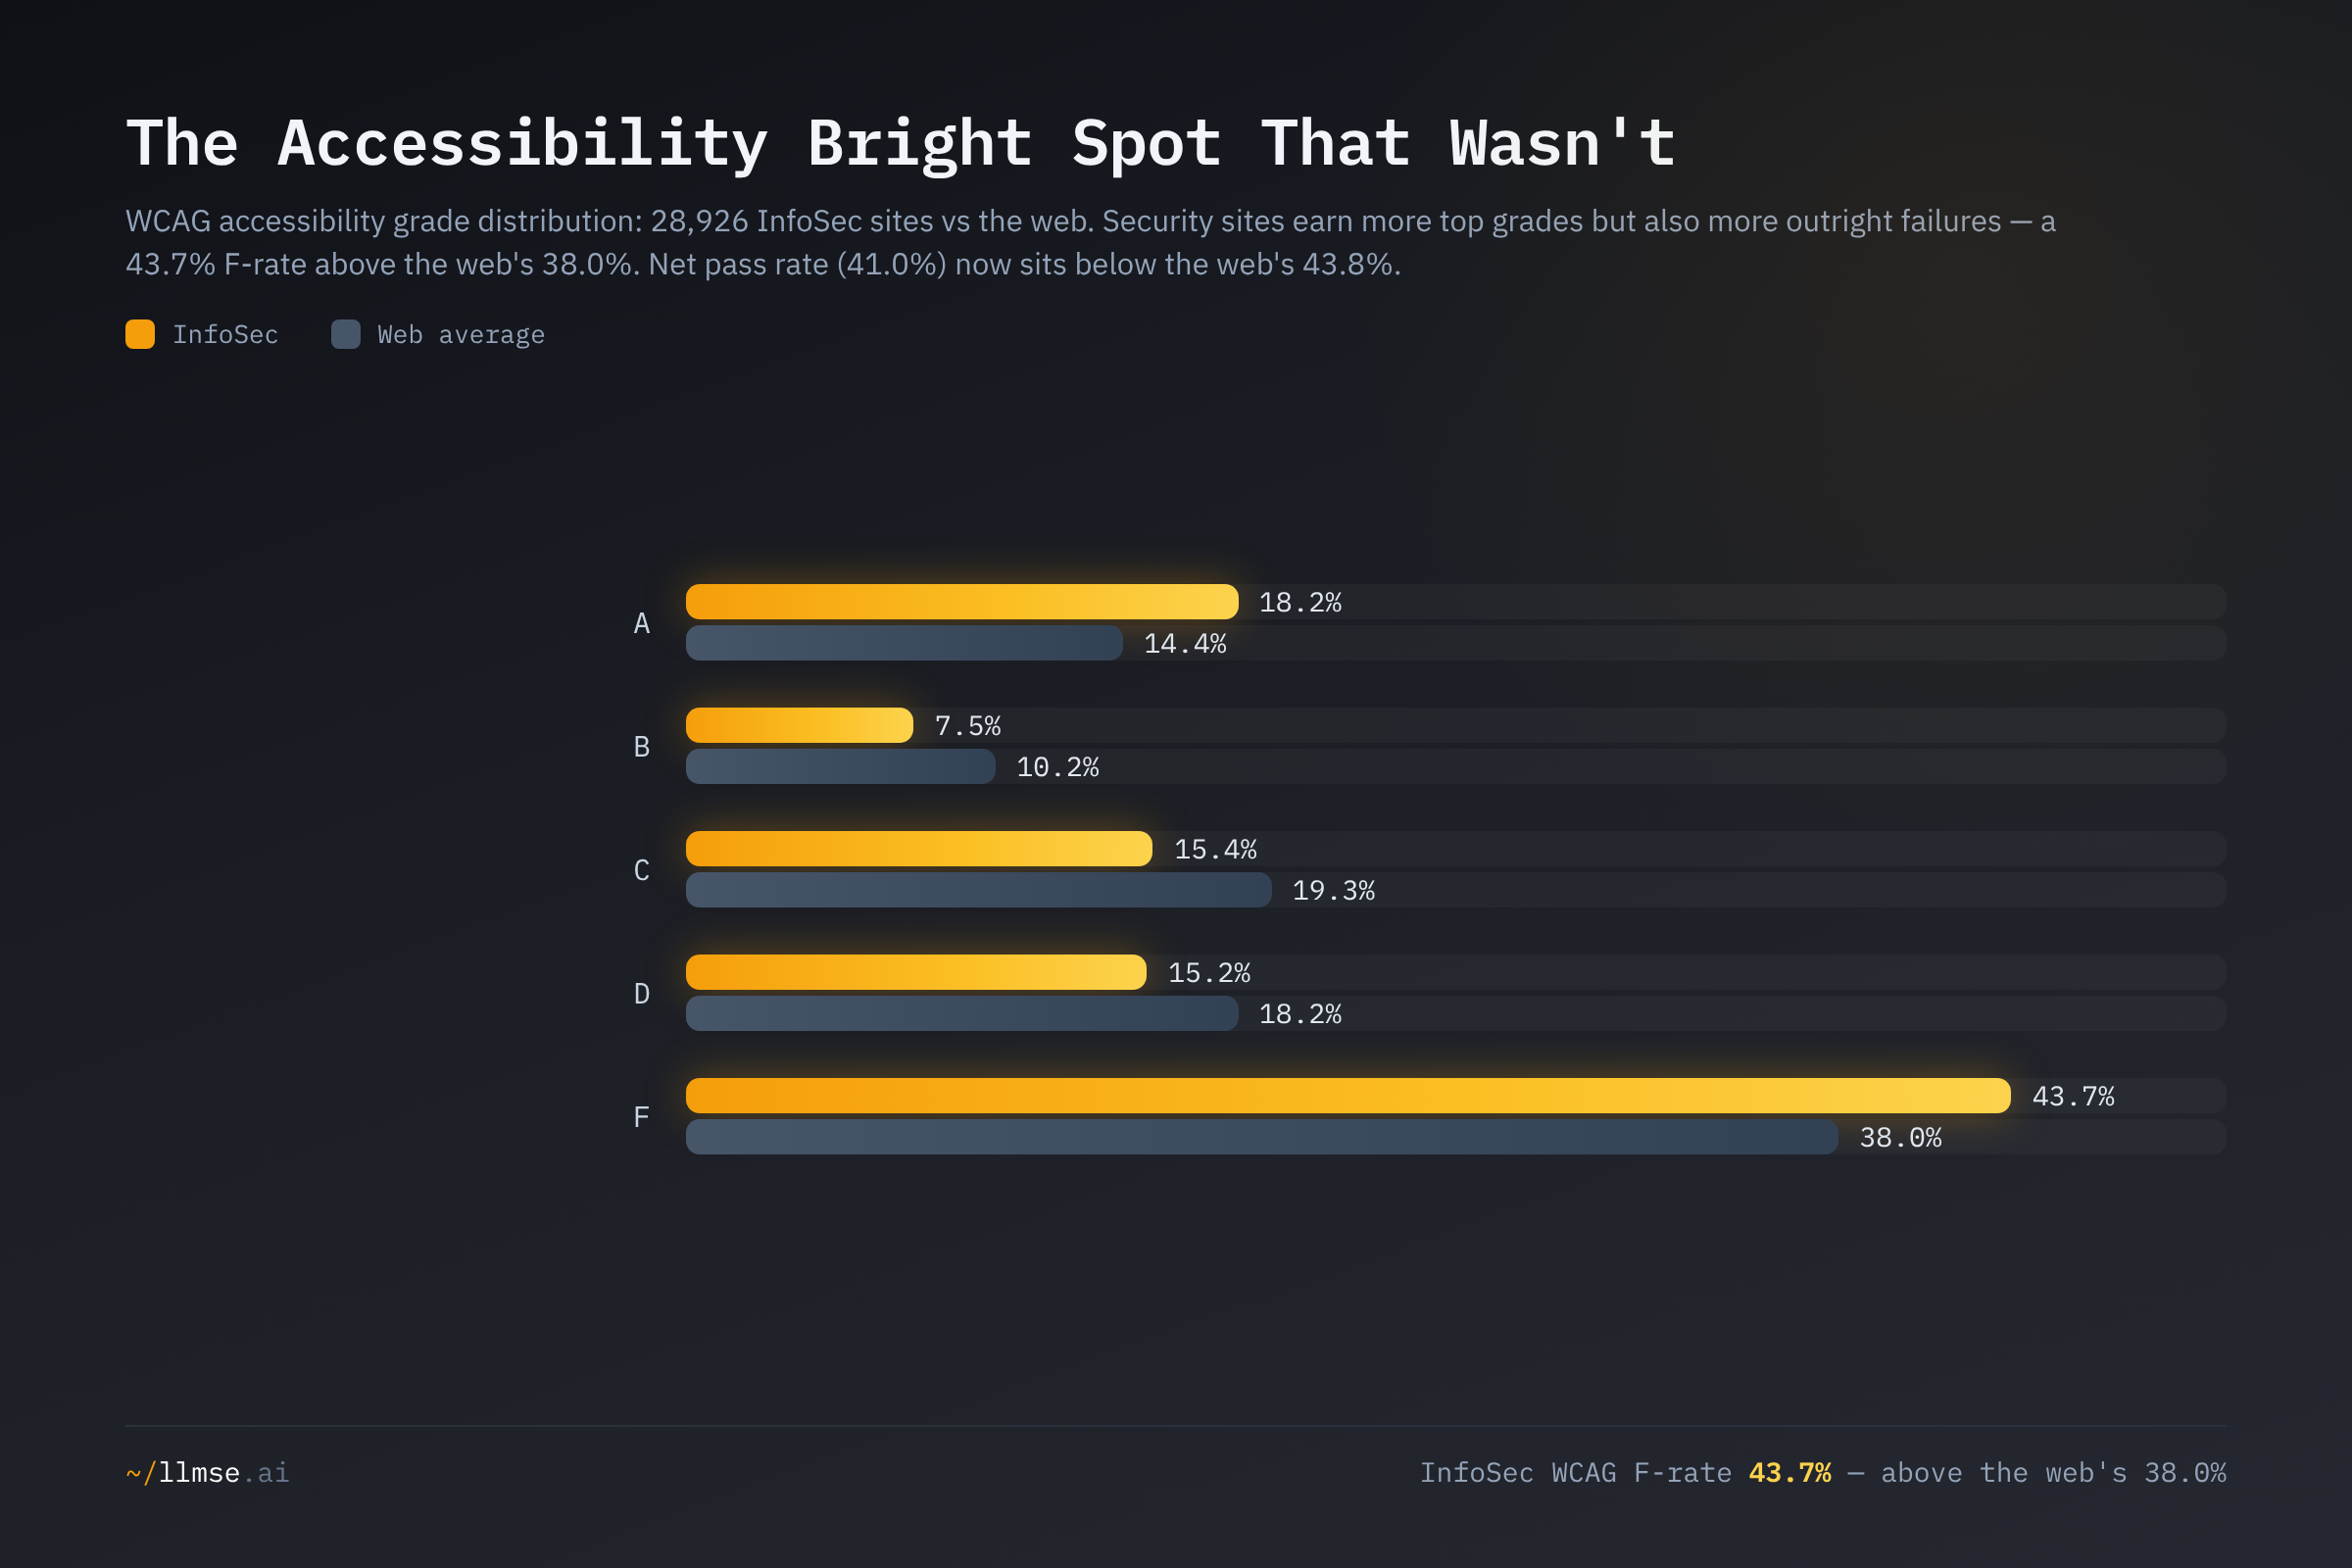
Information & Network Security now passes WCAG at 41.0%, just below the web's 43.8% — accessibility is no longer a relative strength. The distribution is revealingly bimodal: InfoSec earns more top grades than the web (18.2% A vs 14.4%) and more outright failures (43.7% F vs 38.0%), with the middle hollowed out. A minority of sites — likely the dashboards and tools built by teams with mature front-end practices — clear the automated checks for semantic structure, alt text, and ARIA; a larger share fail them outright. Averaged together, the sector lands at or just below the web. The "builders make accessible sites" story was an artifact of a few hundred well-built early-sample pages; at scale it does not hold.
This is not a cosmetic concern. WCAG 2.1, a W3C Recommendation organized around four principles — perceivable, operable, understandable, robust — is the reference standard that accessibility law increasingly points to, and the EU's European Accessibility Act now extends accessibility obligations to e-commerce and a range of digital services. A 43.7% failure rate is a growing liability, not a courtesy gap.
Readability: Writing for Insiders
Readability passes at 21.3%, against a 32.8% web average — 35% below. Nearly a third of security content is rated very difficult to read. This is the jargon problem made measurable: "SIEM," "SOAR," "XDR," "EDR," "CASB," and "ZTNA" are second nature to practitioners and impenetrable to the executives — CISOs, CIOs, CFOs — who actually authorize the spend. The irony is sharp. Security vendors must convince non-technical budget-holders to fund their products, yet write web copy pitched at the engineers who will implement them. (Readability here uses English-calibrated Flesch scoring; the non-English minority is understated, so read this as indicative of the English-language majority that dominates the subcategory.)
Privacy and Brand Safety: The Only Places Security Holds the Line
Two dimensions are not deficits. Privacy passes at 39.2%, marginally above the web's 37.0% — the one quality dimension where InfoSec edges ahead, though "edge" is the right word for a two-point gap. Given that this is the industry built on data protection, a near-tie with the general web is itself underwhelming: one would expect security companies to be exemplary on consent gating, complete privacy and cookie policies, and tracker discipline, and the data shows them merely ordinary. (For the cross-industry picture, see the Privacy Compliance Report.)
Brand safety is the only clean win: 100% of graded security sites score GARM A, against a 90.2% web average. This is expected and says little about site quality — professional security content is inherently brand-suitable, with no adult, violent, or controversial material for the framework to flag. It is the one scorecard cell where the security industry leads, and it is the one that required no effort.
What's at Stake
- The industry that sells discoverability cannot be discovered. With SEO at 1.0% and AEO at 0.8%, security vendors are effectively invisible in both classic search and the emerging AI-answer channel — in a market where buyers research before they buy and organic search drives nearly half of traffic. The gap is a direct constraint on pipeline, and it pushes spend toward paid channels and conferences that do not compound.
- The trust deficit is a business problem, not just an SEO one. EEAT at 20.5% in a YMYL category means Google has less reason to surface security content, and AI answer engines applying YMYL-grade scrutiny have less reason to cite it. A company that cannot demonstrate expertise on its own site is structurally disadvantaged against the minority of competitors that can.
- The accessibility edge is gone, and the liability is growing. A 43.7% WCAG failure rate, now above the web average, is exposure under standards like WCAG 2.1 and laws like the European Accessibility Act — for an industry that should understand compliance risk better than most.
- Brand safety is the only differentiator, and it is free. The single dimension where security leads (GARM 100%) is the one that reflects content category, not craft. Strip it away and the scorecard is a sector below the web on everything that takes work.
What Would Help
- Security vendors: fix the trust signals you already have the evidence for. EEAT passes at 20.5% and 76% of sites sit at grade D — "present but minimal." Author bylines with credentials, Organization and Article schema, editorial transparency, and real source citations move EEAT, AEO, and discoverability at once, and security firms produce the underlying evidence (threat research, test methodologies, named experts) by the truckload. Run a full multi-dimension check at llmse.ai/classify before assuming a strong industry reputation covers you.
- Marketing and content teams: write for the buyer, not the implementer. Readability at 21.3% reflects copy pitched at engineers when the purchase is authorized by executives. Plain-language editing — define the acronym on first use, lead with the outcome — is the cheapest conversion investment available, and the one search will not make for you.
- Developers and web teams: treat accessibility as the legal exposure it now is. The accessibility "edge" was a small-sample illusion; the real F-rate is 43.7%. Semantic structure, alt text, form labels, and keyboard-navigable controls clear most of WCAG 2.1 Level A's automatable checks and reduce liability under frameworks like the European Accessibility Act.
- SEO and demand-gen teams: build for AI answers, not just blue links. AEO at 0.8% means security content is largely absent from generative answers. Direct-answer blocks, comparison tables, statistics, and complete schema are the AEO fundamentals — and the same patterns that win "best EDR" search rankings get content cited by assistants.
- Founders and CMOs: make web quality a priority, because the skills are already in the building. Adding schema markup and author bios takes less effort than a penetration test; writing for decision-makers takes less time than a vulnerability advisory. The gap here is not capability but attention — the cross-industry quality report card shows the whole tech sector shares the blind spot, and the gambling industry shows what an industry that does prioritize discovery looks like by comparison.
This analysis was conducted using LLMSE, which has classified over 3.4 million websites across SEO, EEAT, AEO, WCAG accessibility, readability, GARM brand safety, and privacy dimensions. Information & Network Security figures reflect 29,398 classified sites in the index as of June 2026. To analyze your own site across every dimension in this post, visit llmse.ai/classify.