The AI Citation Readiness Gap: Who Wins When the Web Can't Be Cited
Update — 2026-06-29: Refreshed against LLMSE's current index of 3.4 million classified URLs (up from ~1.5M at first publication), with the analysis rebuilt entirely on aggregate cross-references rather than the original's hand-counted 180,432-site slice. The headline numbers moved as coverage broadened: web-wide AEO pass fell from 2.7% to 1.5% (98.5% now fail), gambling still leads but at 14.2% rather than 16.9%, casinos top all subcategories at 19.4%, and the most-corrected claim — "65.2% of AEO passers are EEAT-A" — drops to 32.0% once the full population is counted (though 87.8% of passers still clear EEAT). Four branded charts were added (category, CMS, web server, and the EEAT-vs-AEO disconnect). The core thesis holds and sharpens: trust does not equal citability, and the industries forced into structured content — not the ones building the technology — own the citation gap.
AI answer engines now intercept traffic before it ever reaches a website. When Google shows an AI Overview, the top organic result loses roughly 58% of its clicks — up from 34.5% a year earlier — according to Ahrefs' February 2026 analysis of 300,000 keywords. ChatGPT, Perplexity, Gemini, and Claude answer hundreds of millions of questions a day by synthesizing web content rather than linking to it. The shift from "ten blue links" to "one generated answer" is no longer a forecast; it is the measured present.
That changes the strategic question every site owner faces. For two decades the goal was to rank. The new goal is to be cited — to be the source an answer engine extracts, attributes, and quotes. These are related but distinct disciplines, and the conventional assumption is that the sites already winning the old game (the trusted institutions, the big brands, the editorially serious publishers) will inherit the new one. If you have authority, the thinking goes, the citations will follow.
The data says otherwise. Being trustworthy and being citable turn out to be different capabilities, only loosely correlated, and the industries best positioned for the AI-answer era are not the ones you would predict.
We graded 3.3 million websites on AEO (Answer Engine Optimization) — LLMSE's measure of whether content is structured for AI citation: direct extractable answers, FAQ and HowTo schema, source citations, statistics, entity clarity, and schema completeness. We then cross-referenced AEO grades against industry, CMS, web server, language, sentiment, and — critically — against EEAT trust grades, using set intersections over the full index rather than a curated sample. Every grade comes from the same automated pipeline applied uniformly across the web.
The result is a cliff, not a curve: only 1.5% of the web passes AEO, and 98.5% fails. The industry leading the citation race is gambling, at 14.2% — nine times the web average — while Computer & Electronics, the sector that builds the web's plumbing, sits near the bottom at 0.6%. And the most-trusted sites on the internet are largely invisible to AI: only 8.7% of EEAT-A sites are citation-ready, meaning more than nine in ten of the web's most authoritative pages cannot be cleanly cited. This is the citation readiness gap, and it is the structural story of AI search.
The Data
AEO is one of six quality dimensions LLMSE grades across its index. It is, by a wide margin, the one almost nobody passes.
| Dimension | URLs graded (web-wide) | Web-average pass rate |
|---|---|---|
| EEAT (trust) | 3,358,193 | 45.4% |
| WCAG (accessibility) | 3,341,362 | 43.8% |
| Privacy | 3,335,626 | 37.0% |
| Readability | 3,341,513 | 32.8% |
| SEO | 3,362,323 | 1.9% |
| AEO (AI answers) | 3,337,309 | 1.5% |
Pass rates are computed over the population actually graded on each dimension — not every URL carries every grade — so the denominators differ slightly. The discovery dimensions (SEO and AEO) are an order of magnitude harder to pass than the content-quality dimensions: nearly half the web clears a baseline trust check, but fewer than one site in sixty is structured for AI citation.
The AEO grade distribution shows why. It is not a population with a long improvable middle — it is a population stacked against the floor:
| AEO Grade | Sites | Share |
|---|---|---|
| A (85-100) | 68 | 0.002% |
| B (70-84) | 3,175 | 0.10% |
| C (55-69) | 47,038 | 1.41% |
| D (40-54) | 324,568 | 9.73% |
| F (0-39) | 2,962,460 | 88.77% |
Sixty-eight websites out of 3.3 million earn an A. Just over 3,000 earn a B. The pass rate (A+B+C) is 1.5%; the D+F failure rate is 98.5%, with 88.8% failing outright at F. The web was built for human readers and keyword-matching crawlers. Answer engines need structured, extractable, schema-rich, citation-bearing content — and almost nobody is producing it.
Methodology
This post makes quantitative cross-references, so the definitions and limits matter.
- AEO grades and "pass." Each site is graded A-F by LLMSE's automated AEO analyzer (there is no E grade). "Pass" means A+B+C. The 100-point AEO score rewards ten signals an answer engine relies on: answer-format detection (Q&A extractability), FAQ and HowTo schema, direct answer snippets (<50-word extractable blocks), entity clarity, source citations to authoritative domains, statistics and data points, schema completeness (Organization/Article/Author), content freshness, and topical authority, with a small clickbait penalty. Full factor weights are on the AEO tool page. Schema metrics are scored neutrally when no corresponding content exists, so the score does not penalize a page for lacking an FAQ it never needed.
- Other dimensions. "Pass" is A+B+C for SEO, EEAT, WCAG, and Privacy, and A+B for Readability (a Flesch Reading Ease score of roughly 50+, ≈ 8th-grade level or below). EEAT grades experience/expertise/authoritativeness/trust signals; SEO grades technical fundamentals.
- Classification basis. Industry membership is by LLM classification into LLMSE's 58-category taxonomy; CMS, server, and language are detected automatically; each grade is an independent automated analyzer. Where a grade is heuristic, that limits precision but is applied identically to every site, so cross-segment comparisons are fair.
- Cross-references are set intersections (Redis
ZINTERCARD) between a grade index (e.g.aeo-A) and a segment index — a category, subcategory, CMS, server, language, sentiment band, or another grade index such aseeat-A. All counts are aggregate; no individual site is identified. - Known limits. Pass rates are computed over graded populations, which are smaller than raw segment sizes. Counts are a live snapshot and drift as classification continues. Sub-segments below ~10,000 graded sites (some finance niches, smaller languages) are flagged as indicative, not precise. The AEO grader scores English-first structured-content conventions; non-English content may be understated where its conventions differ. Russian-language sites are excluded from every aggregate.
- Why these numbers differ from the March 2026 original. The original analyzed a hand-counted 180,432-site cross-section; this rework runs the full graded population of ~3.3M. As coverage broadened from the early, higher-quality, more-visible sites, most absolute pass rates fell a few points (web AEO 2.7%→1.5%). Rankings built on the smallest early samples moved the most — most notably the EEAT composition of AEO passers (see The EEAT-AEO Disconnect). Every figure here is a fresh cross-reference against the current index; no number was carried forward from the original.
The Scorecard: A Cliff, Not a Curve
Cross-referencing AEO grades against the 58-category taxonomy reveals a leaderboard with one bar running off the chart and a long tail pressed against zero. The gap between best- and worst-prepared industries is roughly 140x.
| Rank | Industry | Graded | Pass (A+B+C) | Pass Rate |
|---|---|---|---|---|
| 1 | Gambling | 73,102 | 10,396 | 14.2% |
| 2 | Finance | 18,036 | 814 | 4.5% |
| 3 | Law & Government | 19,209 | 564 | 2.9% |
| 4 | Games | 43,808 | 1,262 | 2.9% |
| 5 | Shopping | 41,069 | 1,146 | 2.8% |
| 6 | Health | 76,295 | 1,658 | 2.2% |
| 7 | Education | 121,462 | 2,526 | 2.1% |
| 8 | News & Media | 70,420 | 1,290 | 1.8% |
| — | Web average | 3,337,309 | 50,281 | 1.5% |
| 9 | Entertainment | 223,142 | 2,773 | 1.2% |
| 10 | Computer & Electronics | 395,110 | 2,312 | 0.6% |
| 11 | Sensitive Topics | 145,203 | 177 | 0.1% |
| 12 | Reference | 44,516 | 23 | 0.1% |
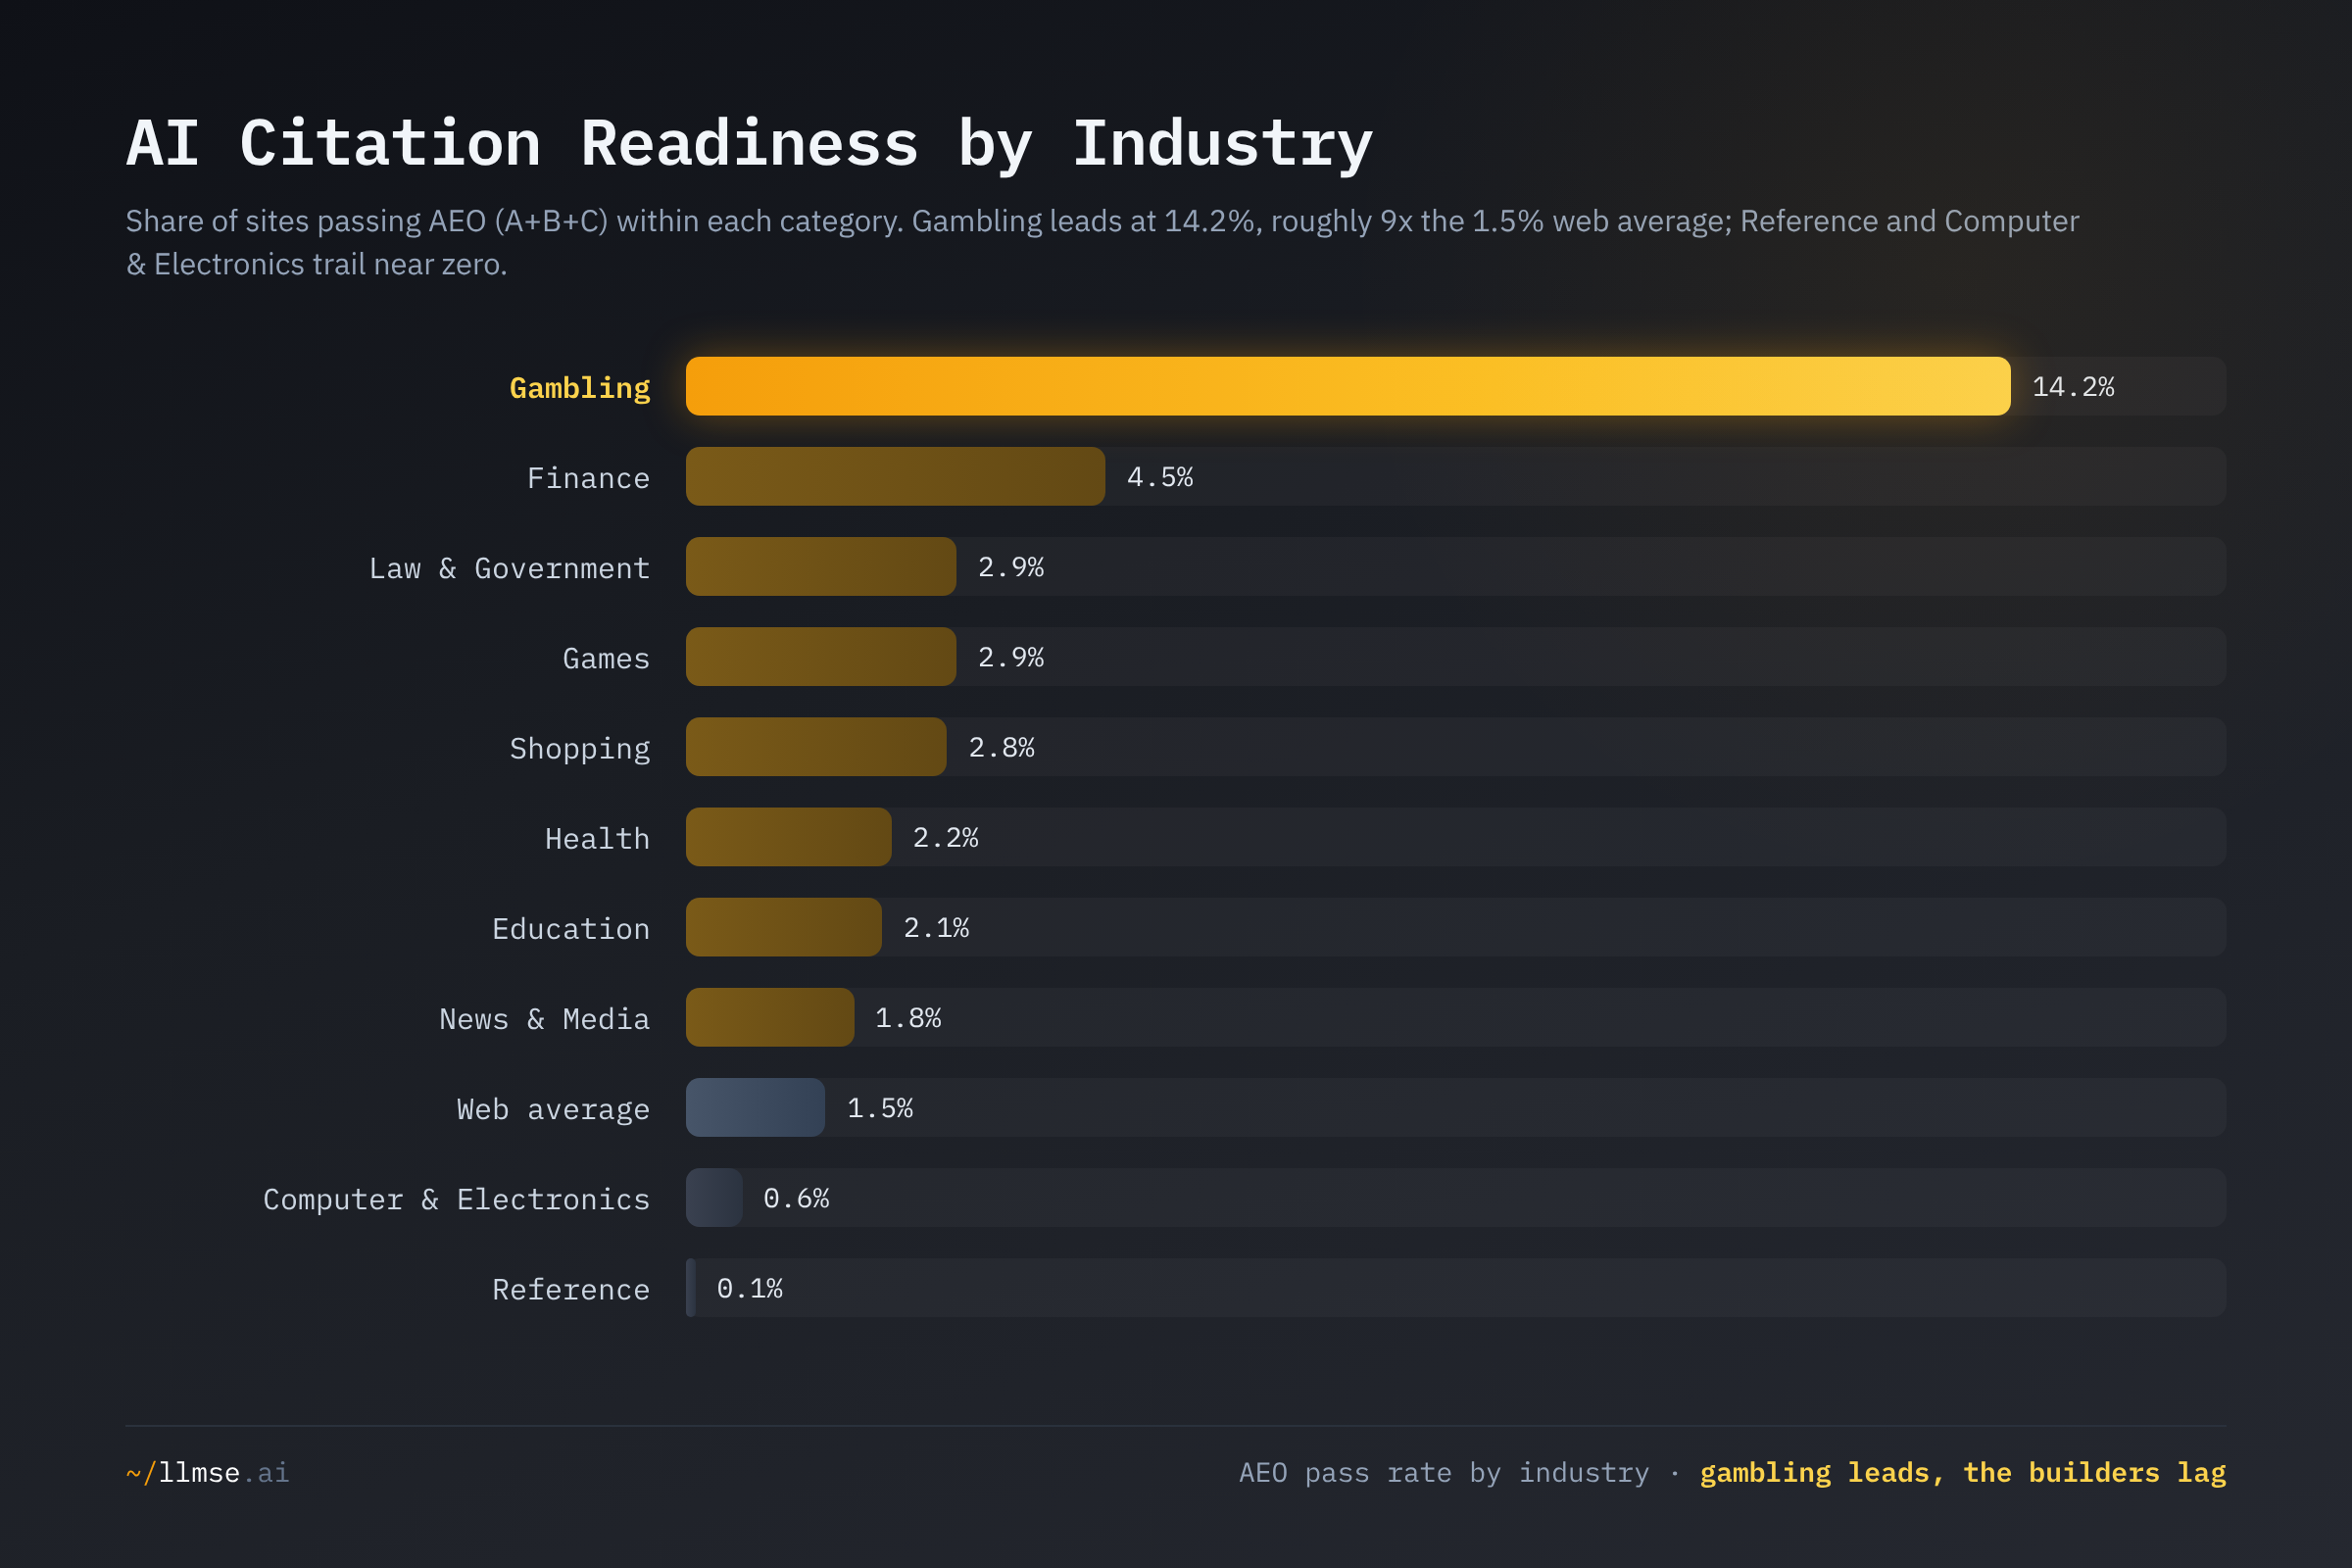
Gambling passes AEO at 14.2% — nine times the web average and more than triple second-place Finance. This is the same result that crowns gambling the most search-optimized industry overall (see The House Always Optimizes): an industry locked out of paid advertising channels by licensing rules and brand-safety filters pours everything into organic and affiliate content, and the structured, comparison-heavy pages that win "best casino" rankings happen to be exactly what answer engines extract.
The deeper irony is that gambling is optimizing for AI citation in a vertical the platforms are actively trying to suppress. Ahrefs' analysis of 146 million SERPs found AI Overviews appear on about 21% of queries overall but only 1.4% of gambling queries — the most-suppressed category. The supply of citable gambling content is the highest on the web; the demand for it in AI answers is the lowest. Citation readiness and citation opportunity are not the same thing, and the mismatch is widest exactly where the content is best optimized.
The Winners: Comparison Content Beats Editorial Content
Splitting the leaders into subcategories shows what AEO actually rewards — and it is not prestige. It is structure.
| Gambling Subcategory | Graded | Pass Rate |
|---|---|---|
| Casinos | 35,005 | 19.4% |
| Sports Betting | 7,242 | 16.9% |
| Regulators & Organizations | 22,371 | 9.1% |
| Poker | 1,287 | 8.5% |
| Lottery | 4,935 | 3.4% |
| Bingo | 2,239 | 2.0% |
Casinos lead every subcategory on the web at 19.4% — thirteen times the web average. Casino review sites answer specific questions ("Is this casino licensed?", "What's the minimum deposit?") in extractable blocks, structure bonus and payout comparisons in tables, and cite licensing authorities — the precise pattern a Princeton-led study (KDD 2024) found can lift a source's visibility in generative-engine answers by up to 40% when content adds citations, quotations, and statistics. Sportsbooks (16.9%) follow the same template. State-run lotteries (3.4%) and bingo (2.0%), which face no competitive pressure, sit near the floor. The commercial core out-optimizes the headline; the regulators counted alongside it pull the category average down.
The lesson generalizes: the industries clustered near the top of the leaderboard — gambling, finance, shopping, games — all produce comparison-driven, FAQ-heavy, data-bearing content because their users arrive with specific commercial questions. The industries at the bottom produce reference listings, editorial prose, or experiential content that resists extraction.
The Tech Paradox: The Builders Can't Be Cited
Computer & Electronics — the industry that builds the technology powering AI search — passes AEO at 0.6%, less than half the web average. The people making the tools are among the worst at being read by them.
| Tech Subcategory | Graded | Pass Rate |
|---|---|---|
| Artificial Intelligence | 3,509 | 3.3% |
| Computer Hardware | 26,932 | 1.6% |
| Programming | 47,346 | 0.9% |
| InfoSec / Network Security | 28,862 | 0.8% |
| Software | 50,282 | 0.4% |
| Web Development | 52,572 | 0.2% |
| Operating Systems | 44,409 | 0.1% |
Web Development sites — the people who literally build websites — pass AEO at 0.2%, and software documentation at 0.4%. These pages are optimized for a developer arriving via search-by-error-message: code blocks, API references, terminal output. They rarely carry FAQ schema, answer-first snippets, Organization/Author markup, or the entity definitions answer engines extract. The one tech subcategory above the web average is Artificial Intelligence content (3.3%) — the corner of the sector that has actually noticed the shift. This is the same disconnect the cross-industry report card flags: technical competence and citation readiness are independent skills, and this sector has invested in only one.
Finance: Quietly Ahead
Finance passes AEO at 4.5% — three times the web average — and is the only non-gambling industry above 3%. It earns its rank the same way casinos do: through structure, not status.
| Finance Subcategory | Graded | Pass Rate |
|---|---|---|
| Investing | 3,672 | 6.6% |
| Banking | 2,559 | 4.8% |
| Financial Planning | 1,455 | 3.8% |
| Financial Management | 5,894 | 3.3% |
Financial content's natural form — rate tables, comparison grids, regulatory disclosures, and FAQ sections about account terms — maps directly onto what answer engines lift. Investing content leads at 6.6%; smaller niches such as credit and insurance run higher still but on samples too small (under 500 graded sites) to report with confidence. The pattern is consistent: where content answers a specific money question with specific numbers, it is citable. This is also a YMYL ("Your Money or Your Life") vertical Google scrutinizes heavily, and the scrutiny correlates with the structured, sourced formatting AEO rewards.
The EEAT-AEO Disconnect: Trusted but Invisible
Here is the finding that should reshape how authoritative sites think about AI search. You would expect the web's most trusted content — sites with author credentials, institutional identity, and editorial standards — to also be its most citable. It is not.
Among the 183,978 sites with a top-tier EEAT-A trust grade, the AEO outcome is bleak:
| AEO Grade | EEAT-A Sites | Share |
|---|---|---|
| A | 36 | 0.02% |
| B | 773 | 0.4% |
| C | 15,289 | 8.3% |
| D | 70,097 | 38.1% |
| F | 97,783 | 53.2% |
More than half of the web's most-trusted sites score F on AEO, and 91.3% fail it entirely. Only 8.7% are citation-ready. Trust does correlate with citability — EEAT-A sites pass AEO at 8.7% versus 1.5% web-wide, and the rate declines monotonically down the trust bands — but the ceiling is low. The most authoritative tier of the web clears AI-citation readiness fewer than one time in eleven.
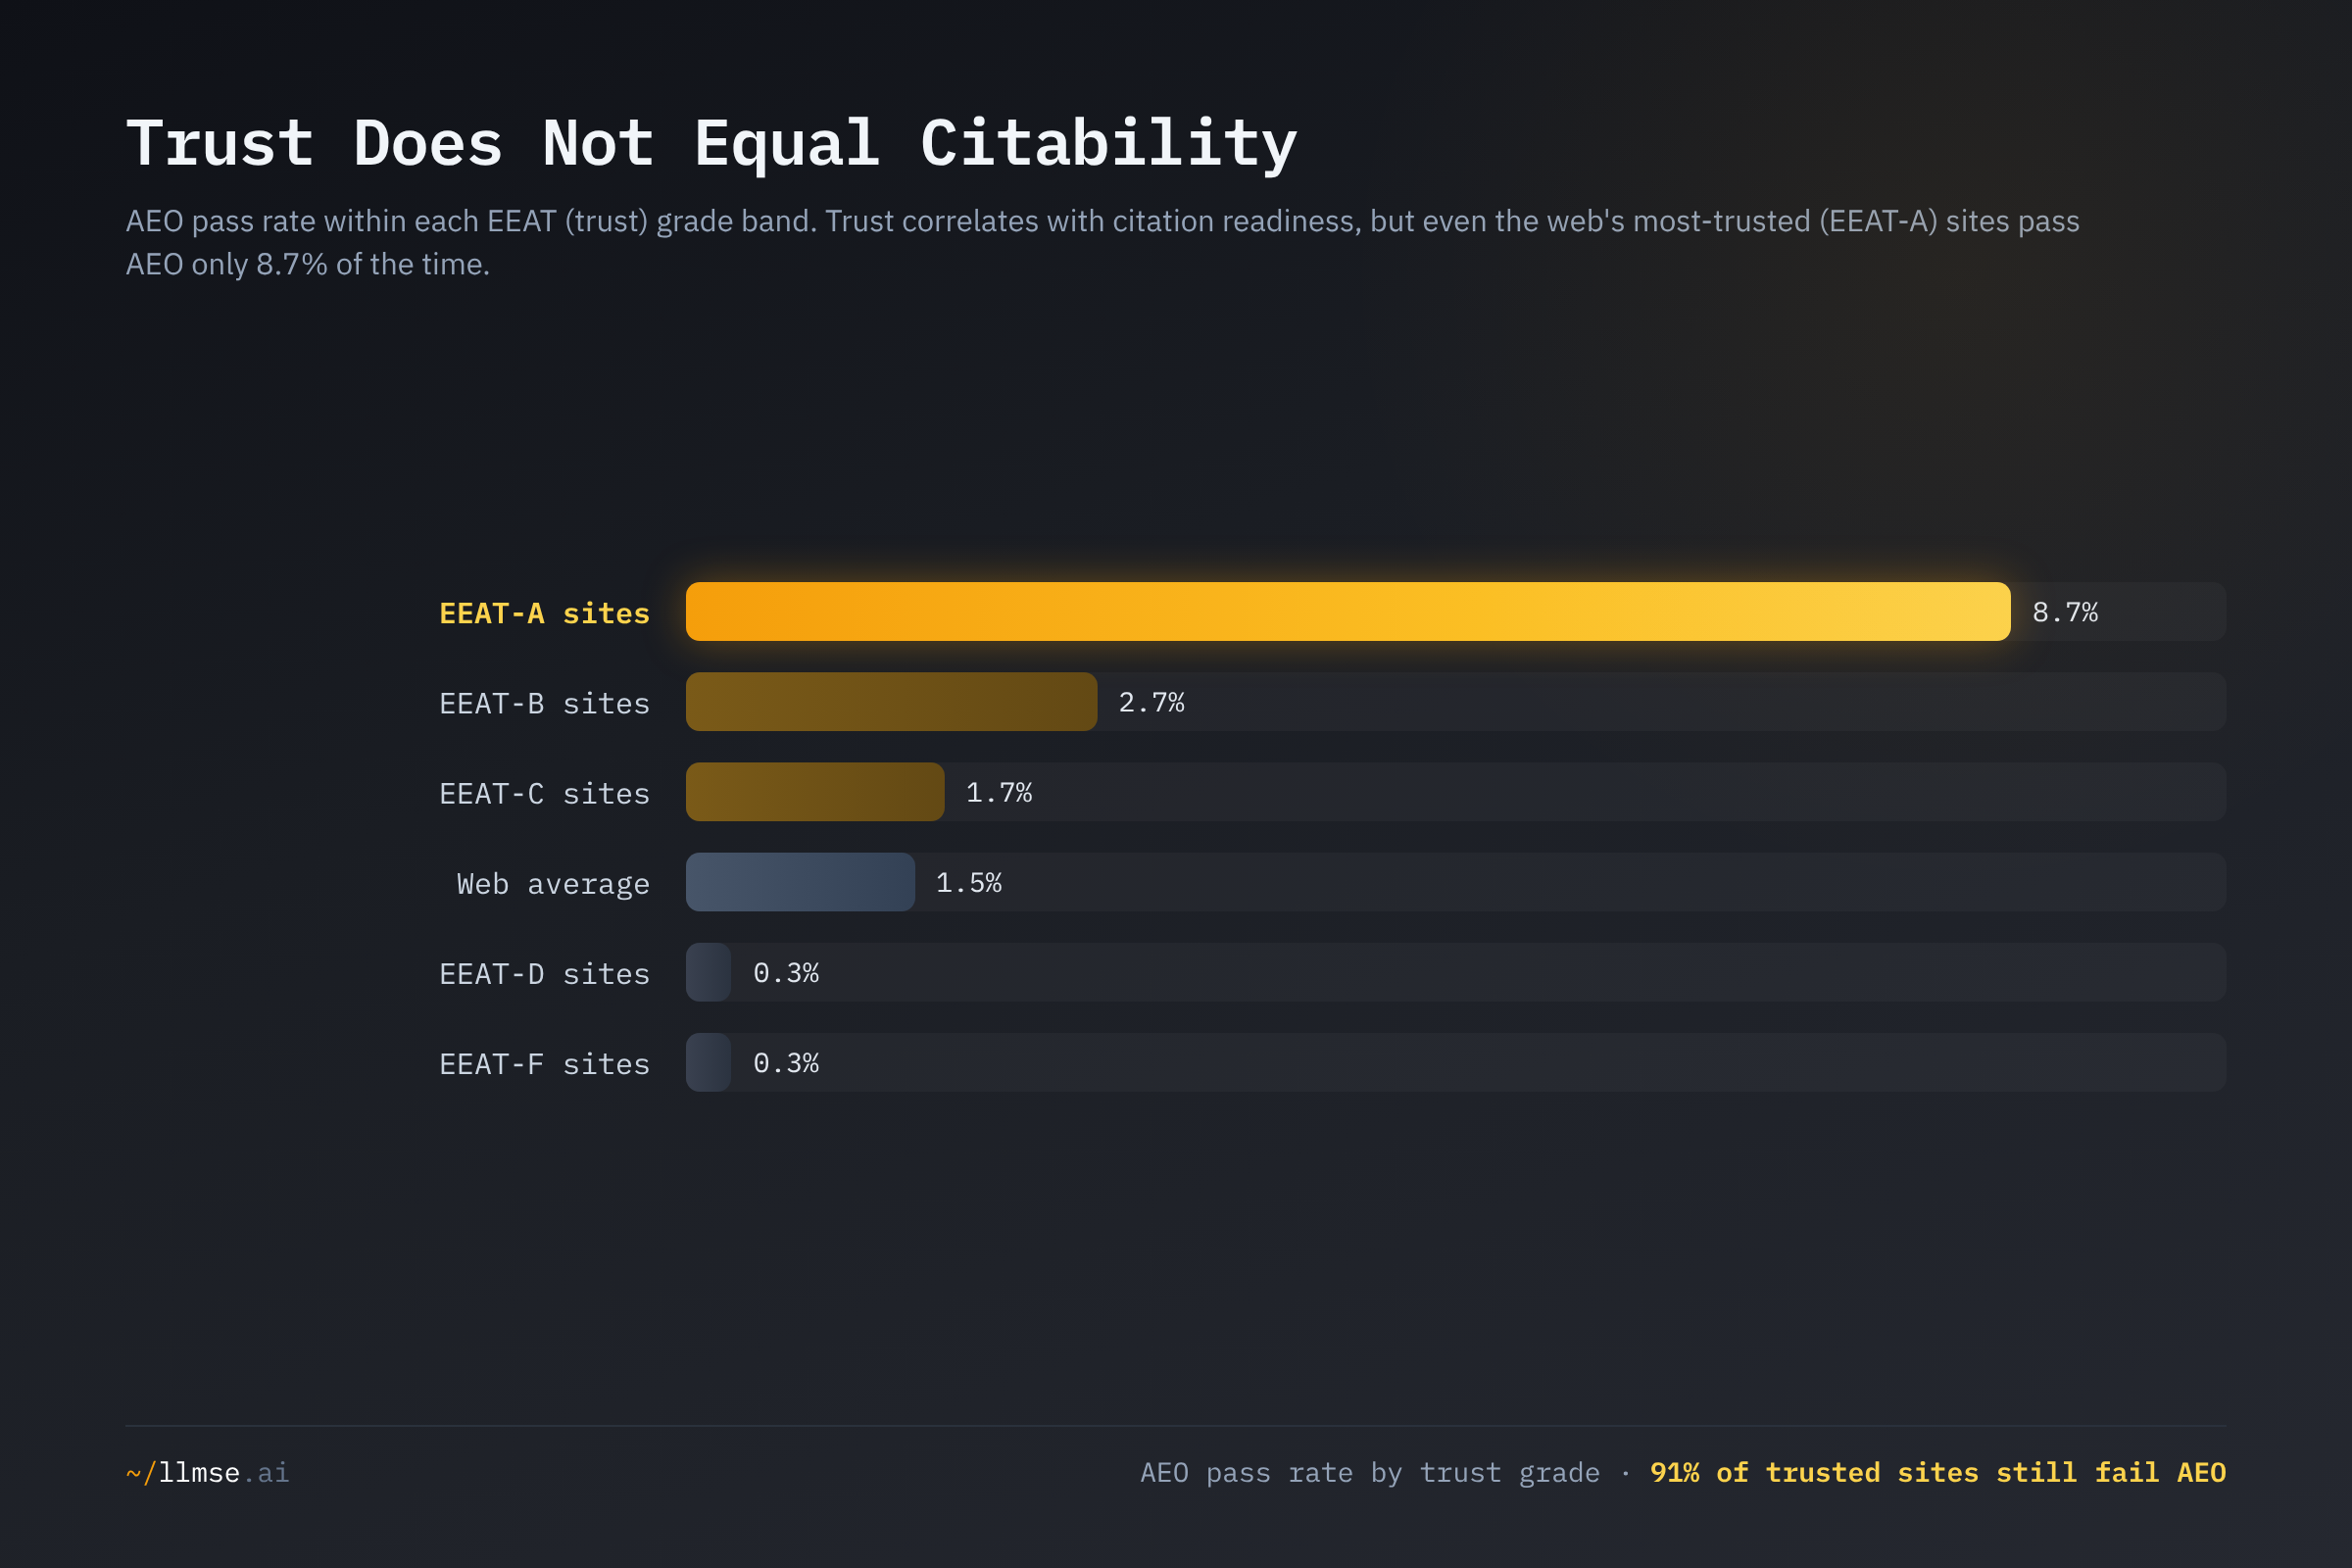
The relationship runs one way. Looking at it from the other side — the EEAT composition of the ~50,000 sites that do pass AEO — trust is nearly always present:
| EEAT Grade | AEO Passers | Share |
|---|---|---|
| A | 16,098 | 32.0% |
| B | 14,540 | 28.9% |
| C | 13,479 | 26.8% |
| D | 5,286 | 10.5% |
| F | 837 | 1.7% |
87.8% of AEO passers also pass EEAT — nearly double the web's 45.4% trust rate. (This is where the original post most needs correcting: it reported "65.2% of AEO passers are EEAT-A," a figure inflated by the early, high-quality sample; on the full index the top-tier share is 32.0%, though the broader A+B+C share holds at 87.8%.) The takeaway is unchanged and now better evidenced: citation readiness almost guarantees trust, but trust barely predicts citation readiness. Sites that invest in extractable structure tend to have credentials and editorial process; the reverse does not follow. An organization can be the world's most authoritative source and still be invisible to ChatGPT, because authority is content quality and citability is content architecture — a second, separate layer of schema markup, answer formatting, and source attribution that most trusted sites have never built.
SEO and AEO Are Different Games
If AEO is just SEO with a new name, the two should travel together. They do not.
| AEO Passers | AEO Non-Passers | |
|---|---|---|
| SEO pass rate | 7.8% | 1.8% |
AEO passers are 4.2x more likely to also pass SEO — a real but weak relationship. The decisive number is the other one: even among sites optimized for AI citation, only 7.8% clear a baseline technical-SEO check, so more than nine in ten AEO passers still fail SEO. Optimizing for an answer engine (extractable structure, schema, citations) and optimizing for a ranking algorithm (crawlability, titles, canonicals, link signals) overlap at the edges but are distinct investments. A site can be highly citable and poorly ranked, or vice versa. Treating AEO as a free byproduct of an existing SEO program is, on this evidence, a mistake.
The Technology Stack: Where Citable Content Is Built
The platform a site is built on, and the infrastructure it sits behind, both correlate strongly with citation readiness — not because the technology adds AEO, but because the choice of stack is a proxy for how much a site invests in modern content structure.
| Platform | AEO Graded | Pass Rate |
|---|---|---|
| Shopify | 15,245 | 6.0% |
| Webflow | 13,315 | 2.5% |
| Drupal | 34,976 | 2.4% |
| WordPress | 1,046,904 | 2.3% |
| Medium | 288,198 | 2.0% |
| Adobe Experience Manager | 115,147 | 1.2% |
| Squarespace | 26,287 | 1.0% |
| Wix | 3,004 | 0.8% |
| jQuery (legacy) | 295,285 | 0.1% |
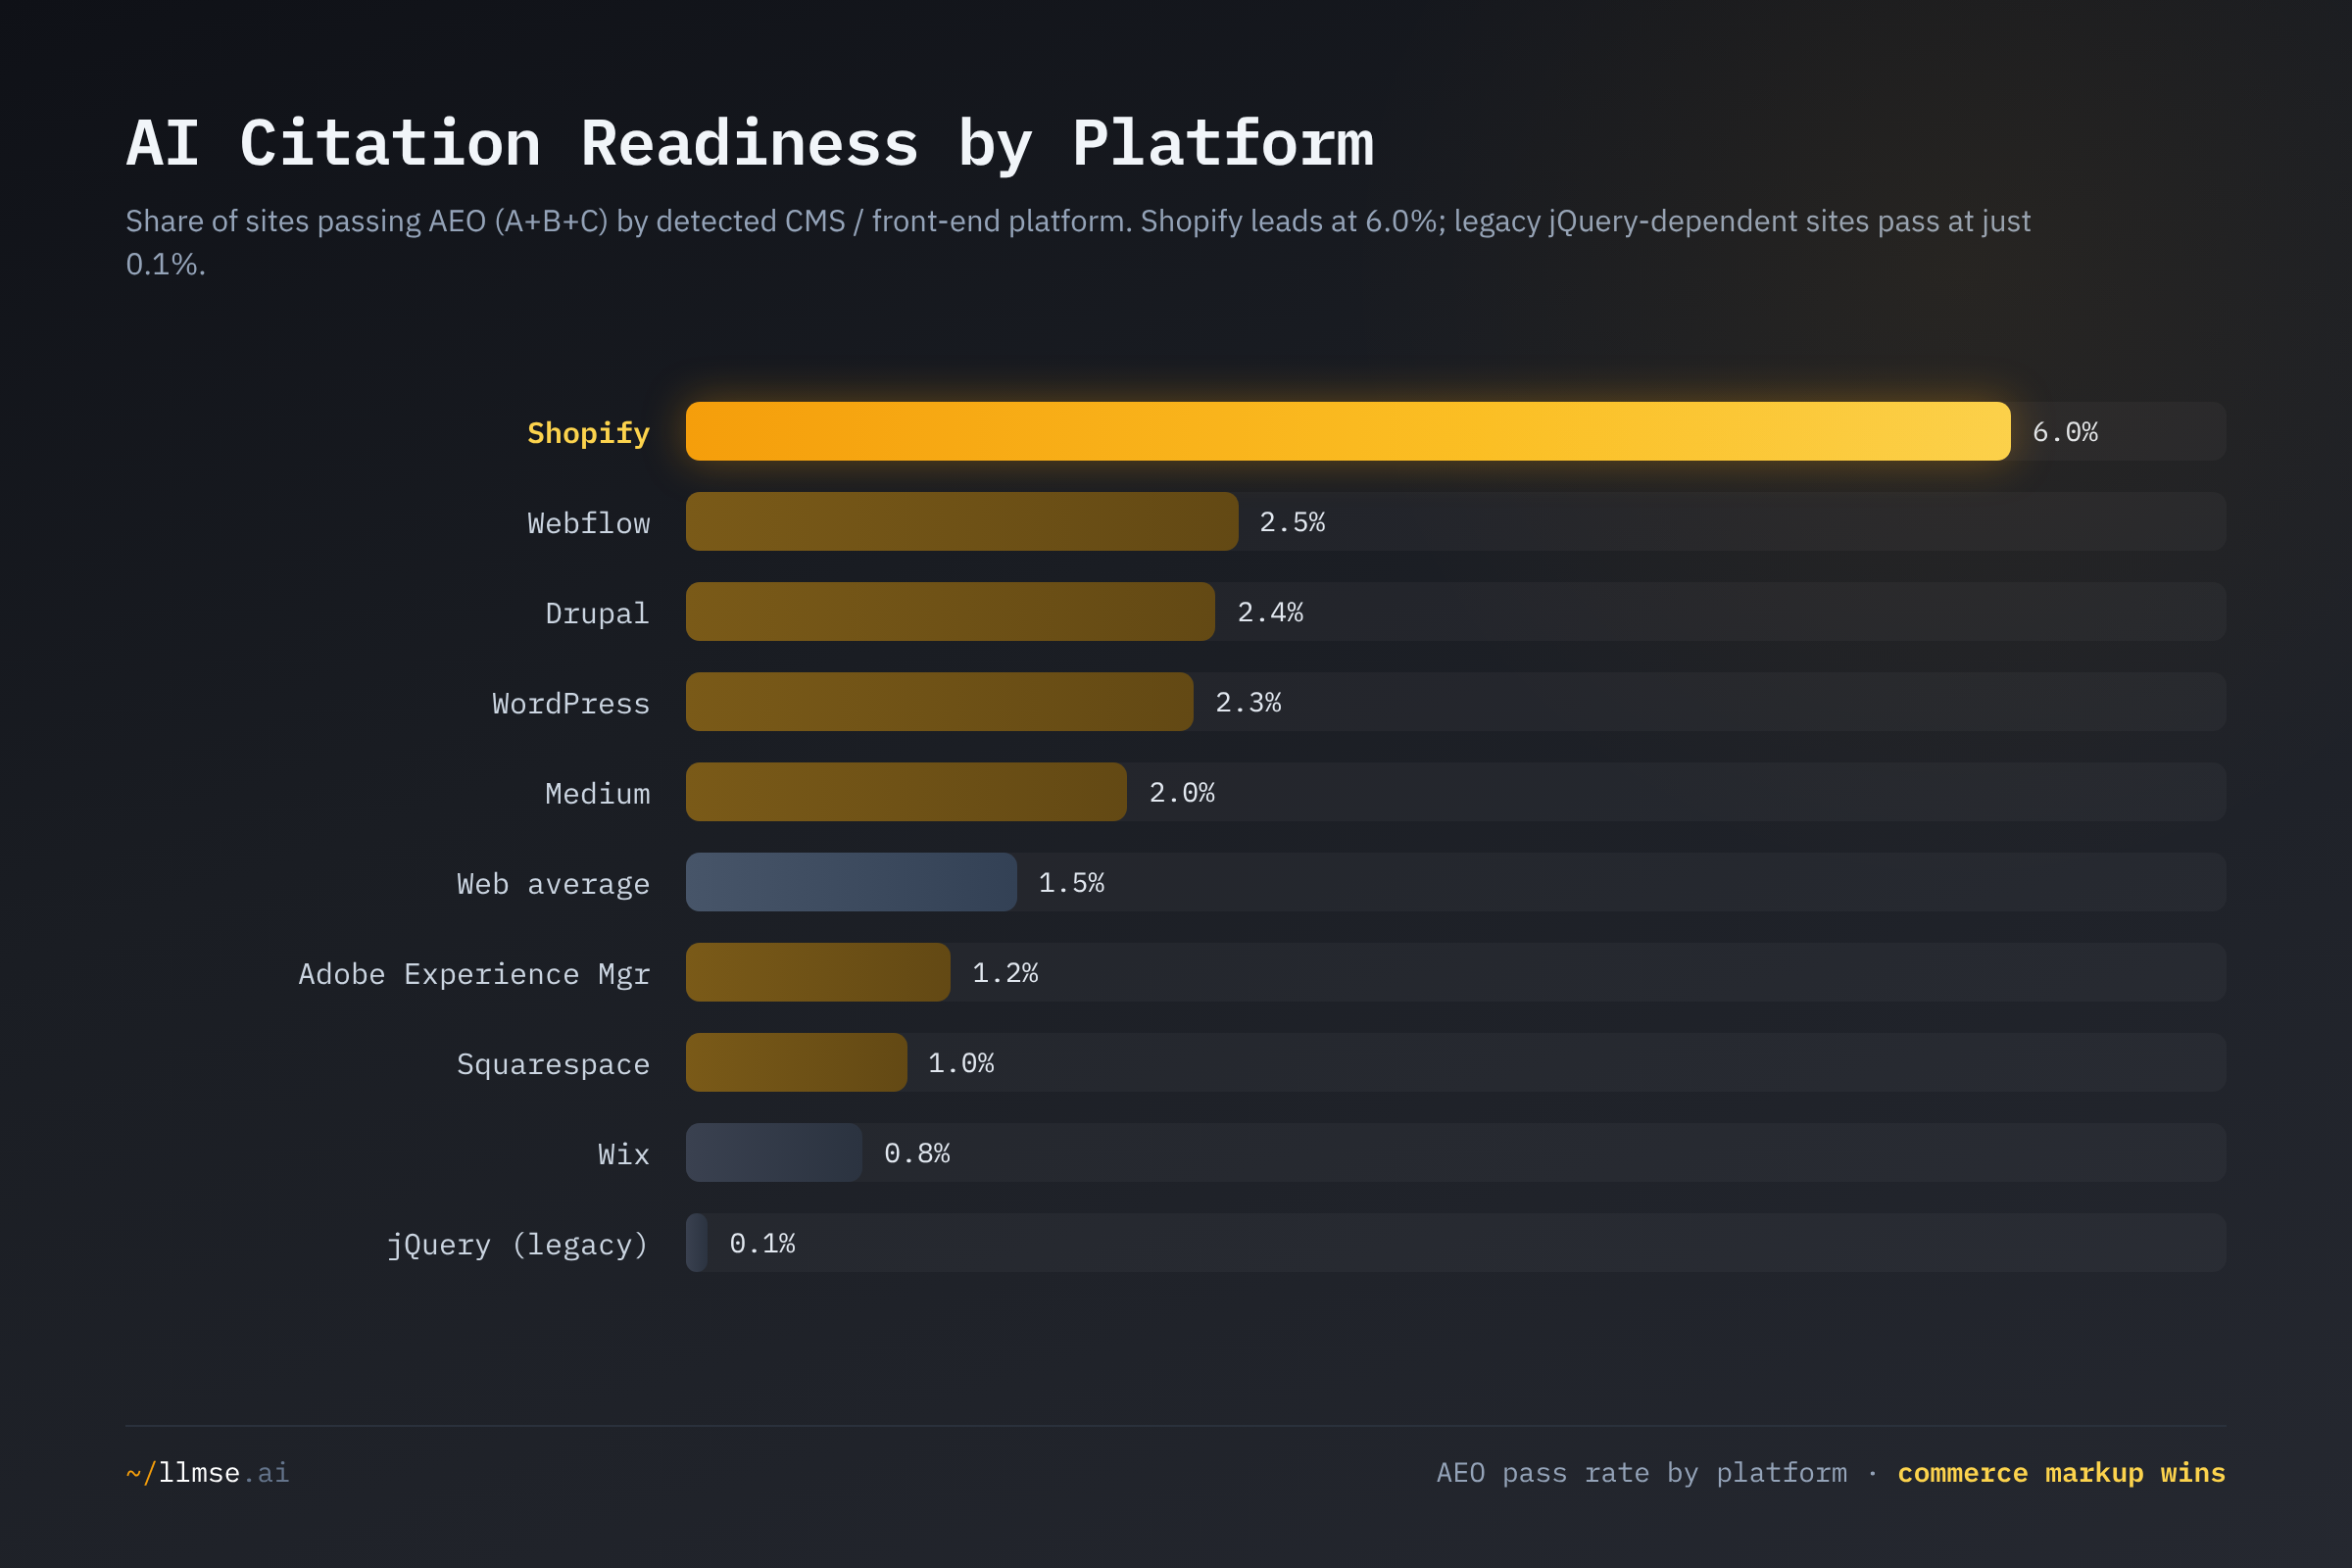
Shopify leads at 6.0% — four times the web average. E-commerce platforms emit structured product data (pricing, specifications, FAQ blocks, comparison tables) by default, and Shopify's app ecosystem ships schema and FAQ generators that add citation-ready markup automatically. WordPress (2.3%) has the largest schema-plugin ecosystem (Yoast, Rank Math, Schema Pro) but a long tail of unconfigured sites drags the average down — installing a plugin is not using it. jQuery-dependent sites at 0.1% are the legacy web: older pages with minimal schema and outdated structure.
The infrastructure layer tells the same story even more starkly:
| Web Server | AEO Graded | Pass Rate |
|---|---|---|
| Cloudflare | 605,530 | 4.9% |
| Vercel | 21,721 | 2.5% |
| Netlify | 16,993 | 1.3% |
| GitHub Pages | 87,743 | 1.2% |
| nginx | 822,580 | 0.8% |
| Apache | 918,109 | 0.5% |
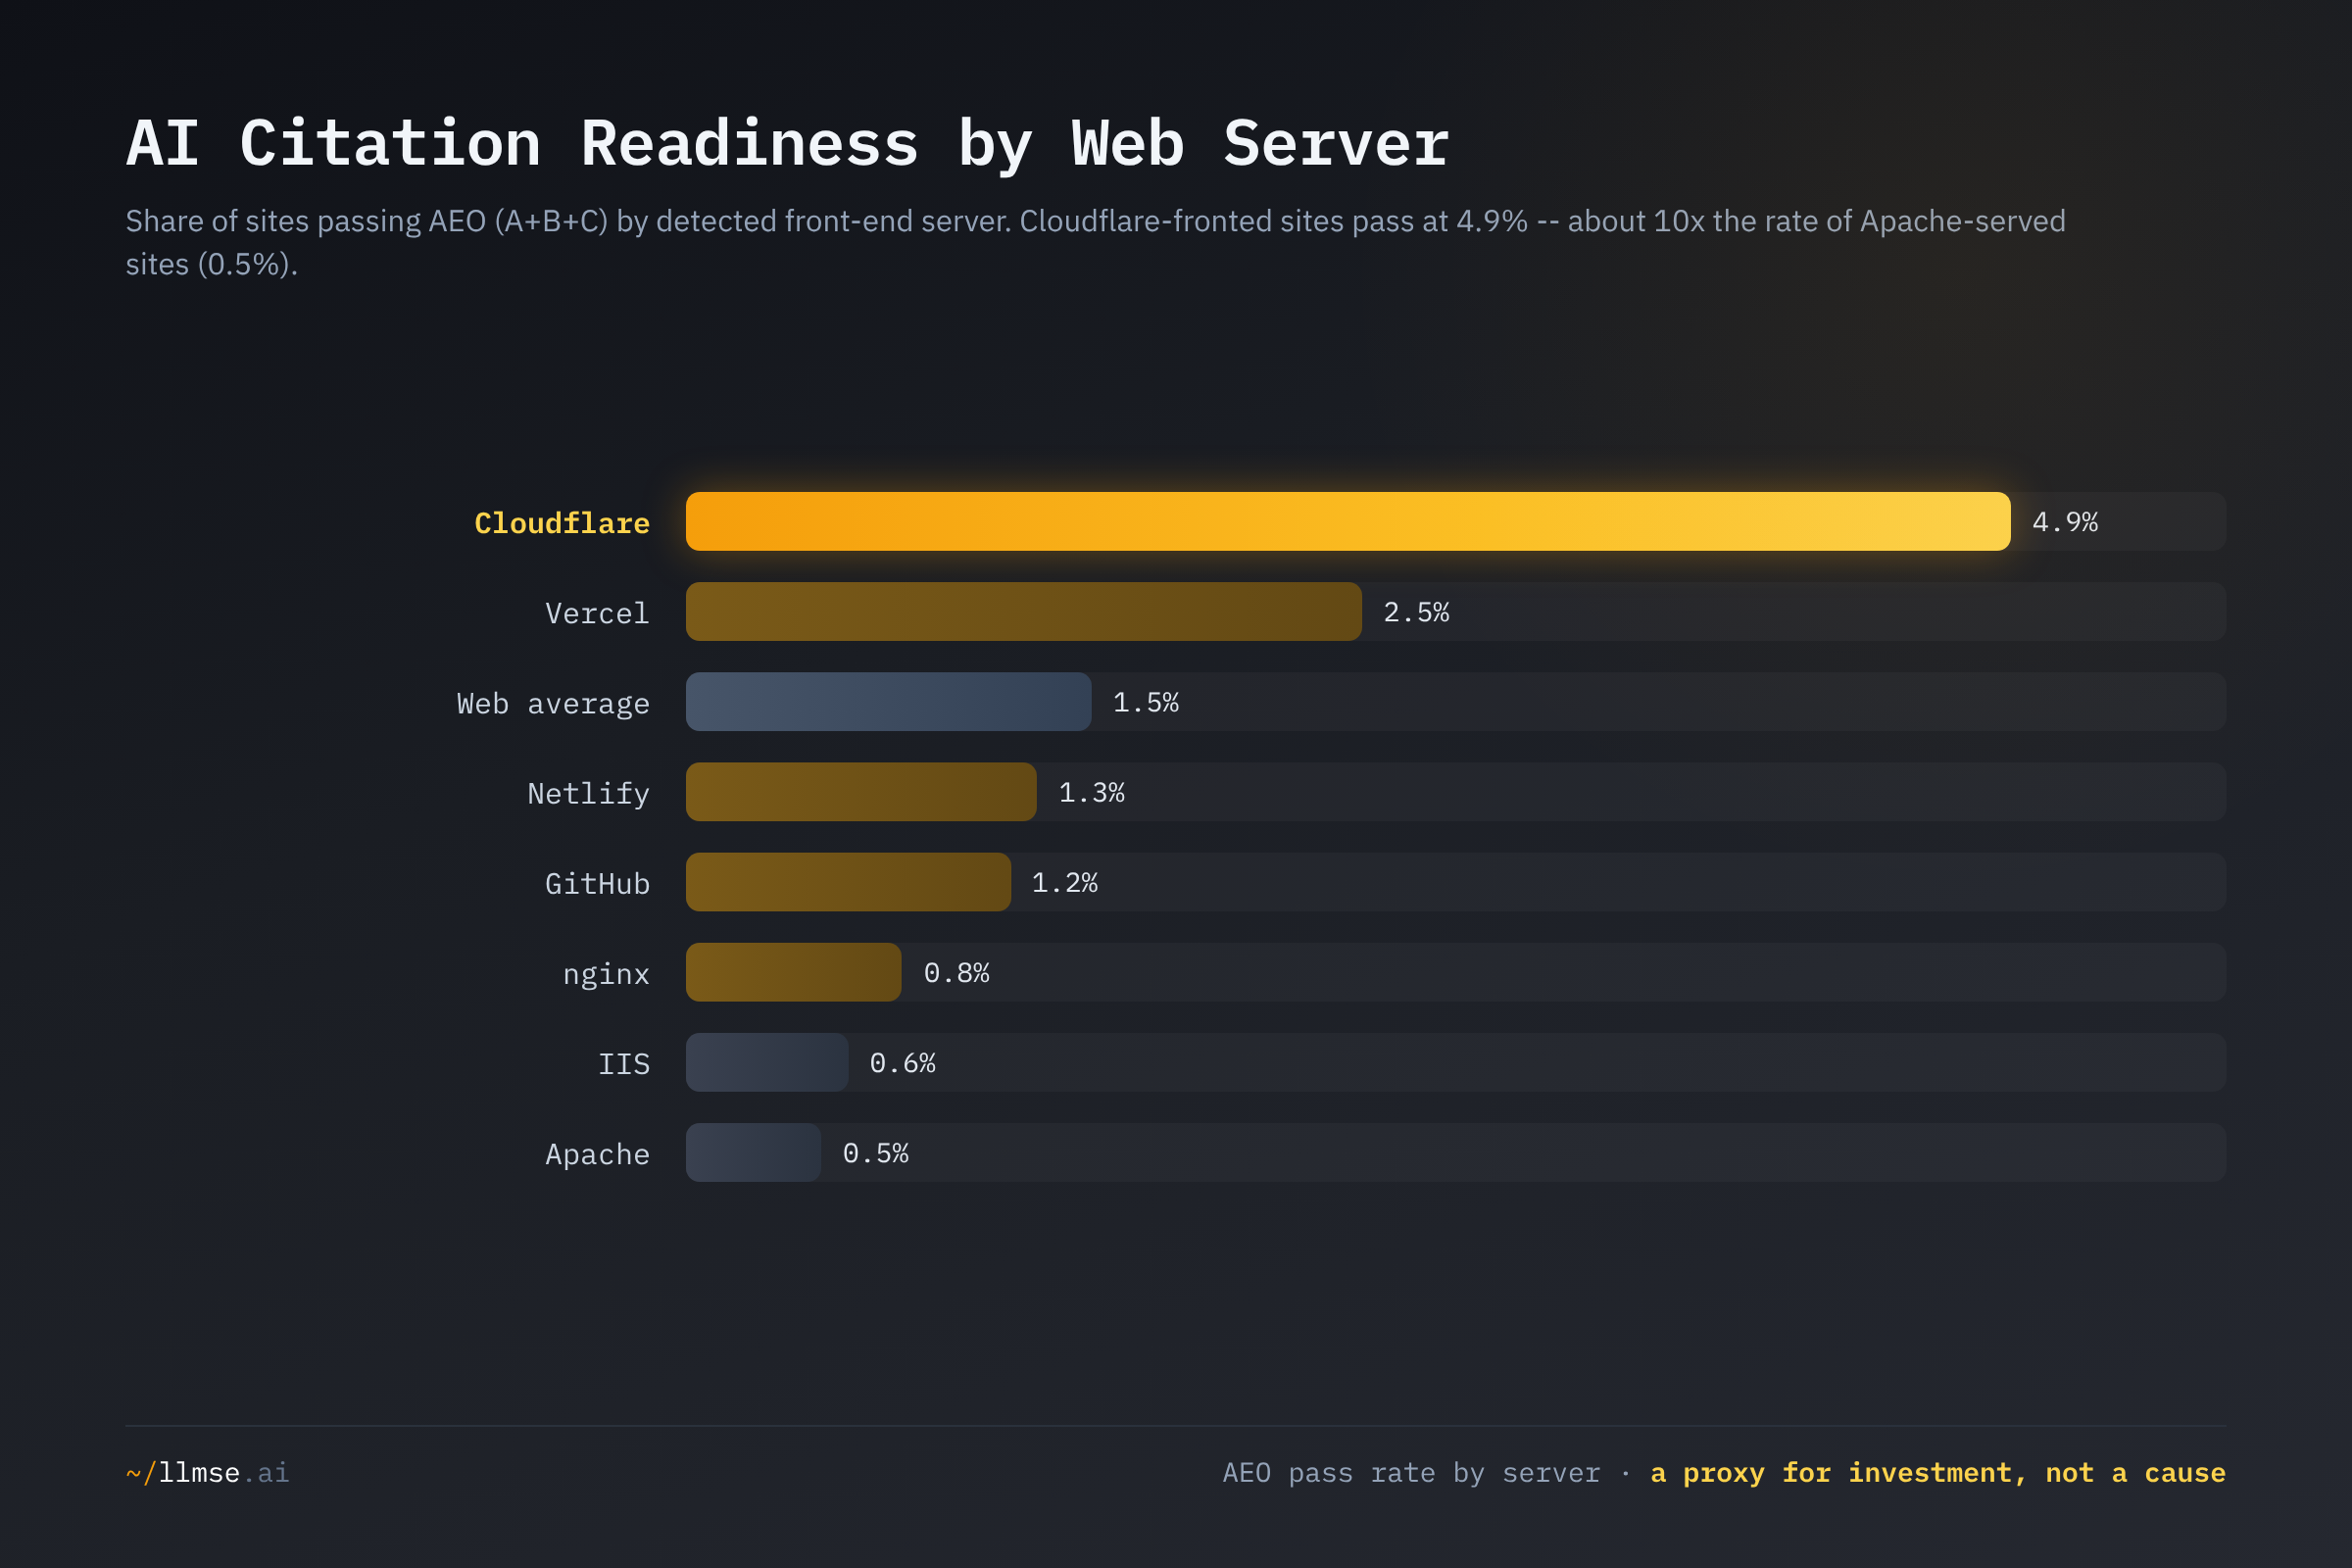
Sites behind Cloudflare pass AEO at 4.9% — roughly ten times the rate of Apache-served sites (0.5%) and six times nginx (0.8%). This is not because a CDN adds answer-format markup. It is a selection effect: choosing Cloudflare, Vercel, or Netlify signals a team that actively maintains its stack and adopts modern web practices, structured data included. The workhorse servers running the long tail of older, unmaintained sites — Apache and nginx — front the bulk of the failing 98.5%. Stack choice is a proxy for investment, not a cause of citability; we state it as a correlation.
Language and Tone: Where Citable Content Lives
Citation readiness is also unevenly distributed across languages and content tone.
| Language | Graded | Pass Rate |
|---|---|---|
| Vietnamese | 22,698 | 9.5% |
| Indonesian | 15,218 | 3.9% |
| English | 2,009,171 | 2.0% |
| Italian | 24,532 | 1.1% |
| Dutch | 116,105 | 0.8% |
| Spanish | 97,674 | 0.8% |
| French | 129,290 | 0.7% |
| Portuguese | 68,923 | 0.7% |
| German | 286,692 | 0.4% |
| Chinese | 55,555 | 0.2% |
| Japanese | 72,791 | 0.0% |
Vietnamese sites lead every language at 9.5% — nearly five times the English rate. This outlier is consistent with Vietnam's large, aggressively optimized online-gambling and gaming sector, which dominates AEO globally; Indonesian (3.9%) shows a similar pattern. English at 2.0% leads the major Western languages, unsurprising given that schema documentation and AEO guidance are published in English first. Japanese (0.0%) and Chinese (0.2%) sit at the bottom: distinct content conventions, less structured-data adoption, and an AEO grader calibrated to English-first patterns all plausibly contribute, so these low rates should be read as indicative rather than a clean quality verdict.
Sentiment correlates too:
| Sentiment | Graded | Pass Rate |
|---|---|---|
| Neutral | 281,032 | 3.8% |
| Good | 2,794,649 | 1.0% |
| Bad | 22,992 | 0.7% |
Neutral-sentiment content passes at 3.8% — nearly four times the rate of positive content. Neutral content tends to be informational, reference-oriented, and data-driven: comparison tables, factual answers, source citations. "Good"-sentiment content skews promotional or inspirational, which is less structured for extraction. The pattern is consistent with AEO rewarding informational architecture over persuasive prose — a plausible mechanism, not a proven one.
What's at Stake
- 98.5% of the web is structurally invisible to AI answers — and the vacuum is being filled by the optimized fringe. As AI Overviews cut top-result clicks by 58% and chatbots answer in place of links, the sites that haven't built extractable, citation-rich content lose visibility they cannot buy back. The content most ready to fill the gap is gambling and affiliate material, not the most authoritative source.
- Trust without structure is invisible. Organizations that spent a decade building EEAT — credentials, institutional authority, editorial standards — are not automatically rewarded by answer engines: 91% of EEAT-A sites fail AEO. The highest-stakes information on the web (the trusted tier) is the least likely to be cited cleanly, which both starves users of authoritative answers and rewards whoever formatted best.
- AEO is a separate investment, not an SEO dividend. Because more than nine in ten AEO passers still fail SEO — and the relationship is only 4.2x — teams that assume their SEO program covers AI citation are exposed. The two require different work.
- Platform and stack choices compound across the long tail. Shopify's 6.0% versus jQuery's 0.1%, and Cloudflare's 4.9% versus Apache's 0.5%, are content-architecture differences that scale across millions of sites. A site's defaults quietly determine whether it is citable before anyone writes a word.
- Citation readiness and citation opportunity are mismatched. Gambling has the most citable content (14.2%) yet the least AI-Overview exposure (1.4% of queries), while Health and Science queries trigger AI Overviews most (43%+) but those sectors are only mid-pack on readiness (Health 2.2%). Where answers appear and where citable content exists are governed by different forces.
What Would Help
- Site owners: audit citability separately from trust and ranking. A strong reputation or a solid SEO score predicts almost nothing about AEO. Run a dedicated check at llmse.ai/classify and treat AI-citation readiness as its own line item — especially if you are a trusted institution assuming authority is enough.
- Content teams: add the extractable layer to content you already have. The highest-leverage moves map directly to what the Princeton GEO study found lifts visibility up to 40%: answer-first blocks (40-60 words before the detail), source citations to authoritative domains, and embedded statistics. These convert existing authoritative prose into citable content without rewriting it.
- Developers and technology publishers: ship the markup you omit. Computer & Electronics fails AEO at 0.6% because its pages carry code but not structured data — no Organization/Author schema, no FAQ blocks, no entity definitions. The sector best equipped to implement schema is the least likely to. Adding it would make technical content far more citable at minimal cost.
- Platform and CMS vendors: make citation readiness a default, not a plugin. Shopify's lead shows what shipping schema generators and FAQ blocks by default does at scale. Platforms that bake answer-ready markup into base templates create a measurable, compounding advantage for every site they host.
- AI platforms: weight provenance, not just extractability. Because mainstream and authoritative content is uniformly low on AEO while gambling and affiliate verticals are high, naive retrieval over-surfaces the optimized fringe. For YMYL topics especially, prefer trusted, well-sourced sources over whatever is best formatted — and recognize that the most citable content is not always the most reliable.
This analysis was conducted using LLMSE, which has classified over 3.4 million websites across SEO, EEAT, AEO, WCAG accessibility, readability, GARM brand safety, and privacy dimensions. AEO figures reflect the 3,337,309 sites graded on AI citation readiness in the index as of June 2026. To analyze your own site across every dimension in this post, visit llmse.ai/classify.