The WordPress Paradox: The Web's Most-Attacked CMS Scores Above the Web Average on Every Quality Dimension
Update — 2026-06-29: Refreshed against LLMSE's current index of 3.4 million classified URLs (up from ~1.4M at first publication) and expanded from five graded dimensions to seven, adding AEO (AI-answer optimization) and Privacy. The headline thesis is intact and slightly stronger: WordPress is now above the web average on every dimension, including readability — the original's one exception is gone. But the magnitudes have come down as coverage broadened. The original's signature claim that WordPress EEAT is "double the web average" no longer holds: on the strict A+B trust bar the gap is 1.44x (31.0% vs 21.5%), not 2x; the Cloudflare-over-nginx SEO advantage narrowed from 7.3x to ~4.7x on that same bar. We have also dropped the 12-CMS comparison tables that duplicated The CMS Quality Gap; this post is now a WordPress-only deep dive. Every figure is recomputed against the live index.
WordPress has a security problem, and the numbers keep getting worse. Patchstack's State of WordPress Security 2026 counted 11,334 new vulnerabilities disclosed across the WordPress ecosystem in 2025 — a 42% jump year-over-year, with 91% of them in third-party plugins and more high-severity bugs than the previous two years combined. WordPress is also where the web gets hacked: Sucuri's threat research found WordPress accounted for 95.5% of the infected sites it cleaned.
The intuitive conclusion is that WordPress sites must therefore be low quality — insecure, abandoned, throwaway projects running outdated plugins. The platform's ubiquity is read as a symptom: it is everywhere because it is the path of least resistance, and the path of least resistance produces mediocre websites.
That conclusion does not survive contact with the data. We cross-referenced 1,060,974 sites detected running WordPress in LLMSE's index against seven automated quality graders — SEO, AEO (optimization for AI answer engines), EEAT (trust signals), WCAG accessibility, readability, privacy compliance, and GARM brand safety — using the same pipeline applied uniformly across all 3.4 million classified URLs. WordPress detection is based on HTML fingerprints (wp-content references, REST API endpoints, generator tags, theme and plugin signatures). The question was simple: does the web's most-attacked CMS actually produce worse websites than the web at large?
It produces measurably better ones. WordPress clears the web-wide pass rate on all six graded quality dimensions, plus brand safety — its EEAT pass rate is 59.8% against a 45.4% web average, its SEO pass rate is 2.8% against 1.9%, and it now edges the web on readability too (33.0% vs 32.8%), the one dimension where it used to fall short. The same plugin marketplace that manufactures most of the web's vulnerabilities also manufactures most of WordPress's quality signals. This is not a contradiction. It is the same architecture seen from two angles.
The Data
WordPress is not a niche to be sampled — it is, by W3Techs' June 2026 figures, 41.9% of all websites and roughly 60% of the entire CMS market, the largest single technology footprint on the web. The 1.06M WordPress sites in LLMSE's index are a slice of that footprint, graded by the same analyzers as everything else. Pass rates below are computed over the population actually graded on each dimension; not every URL carries every grade, so the denominators differ.
| Dimension | WordPress sites graded | WordPress pass rate | Web average |
|---|---|---|---|
| SEO | 1,051,378 | 2.8% | 1.9% |
| AEO (AI answers) | 1,046,975 | 2.3% | 1.5% |
| EEAT (trust) | 1,050,258 | 59.8% | 45.4% |
| WCAG (accessibility) | 1,048,031 | 45.1% | 43.8% |
| Readability | 1,048,066 | 33.0% | 32.8% |
| Privacy | 1,046,448 | 47.2% | 37.0% |
| GARM brand-safe (A) | 984,393 | 91.6% | 90.2% |
WordPress's reach is genuinely global: English accounts for just 55.5% of its sites in the index, with German (9.7%), French (5.3%), Spanish (4.5%), Dutch (4.5%), and a long multilingual tail behind it — a far lower English share than most single-industry segments. That global spread, and the hosting stack underneath it (nginx 28.8%, Apache 26.9%, Cloudflare 19.6%, LiteSpeed 10.3%), turn out to matter enormously for the quality numbers, as the deep-dives show.
Methodology
This post makes quantitative claims, so the definitions and limits matter.
- Grades and "pass." Each site is graded A-F by a dedicated automated analyzer (there is no E grade). The LLMSE standard "pass" is A+B+C for SEO, AEO, EEAT, WCAG, and Privacy, and A+B for Readability (a Flesch Reading Ease score of roughly 50+, ≈ 8th-grade level or below). GARM brand safety counts only A as "safe."
- The strict A+B bar. This post's original (March 2026) edition used A+B as "pass" for every dimension — a stricter, top-tier bar. We align to the current standard above, but where the original's signature claims depended on the A+B bar (notably EEAT and SEO), we report the strict A+B figure too and label it "top-tier (A+B)," so the comparison to the original is honest. The two bars answer different questions: A+B+C asks "does the site clear a passing floor?"; A+B asks "is the site in the top two tiers?"
- Classification basis. WordPress membership is by HTML fingerprint; category membership is by LLM classification; each grade is an independent automated analyzer. SEO grades technical fundamentals; AEO grades answer-extractability and AI-citation signals; EEAT grades experience/expertise/authoritativeness/trust signals; WCAG covers automated accessibility checks (~30-40% of WCAG 2.1 Level A — full conformance requires manual testing); Privacy grades consent gating, policy presence, and tracker behavior.
- Cross-references are computed as set intersections (Redis
ZINTERCARD) of theapp-WordPressindex with grade indices, and three-way intersections with server (server-*), language (lang-*), and category indices. All counts are aggregate; no individual site is identified. - Known limits. Pass rates are over graded populations, smaller than the 1.06M raw total. The Readability grade uses Flesch scoring, which is calibrated for English, so cross-language readability is unreliable and we avoid it — the language breakdown below is SEO only. Server detection reads the response header, so managed WordPress hosts (WP Engine, Kinsta, Flywheel) that emit custom headers fall outside the four major server buckets. Counts are a live snapshot. Russian-language sites are excluded from every aggregate.
- Why these numbers differ from the original. The graded population grew from ~1.4M to ~3.4M URLs. Early grades skewed toward higher-quality, more-visible sites, so most absolute pass rates have fallen a few points as coverage broadened (web EEAT, WCAG, and readability baselines all dropped). The original also reported A+B pass rates against smaller samples; recomputed against the current index, the WordPress-over-web gaps are narrower but consistently positive. For cross-CMS comparisons — how WordPress stacks up against Drupal, Shopify, Webflow, and the static generators — see the dedicated CMS Quality Gap report; this post stays inside WordPress.
The Scorecard
Plotting WordPress against the all-site web average across every dimension produces a profile with no dips: a platform that is at or above the baseline everywhere, and clearly ahead on trust, privacy, and discovery.
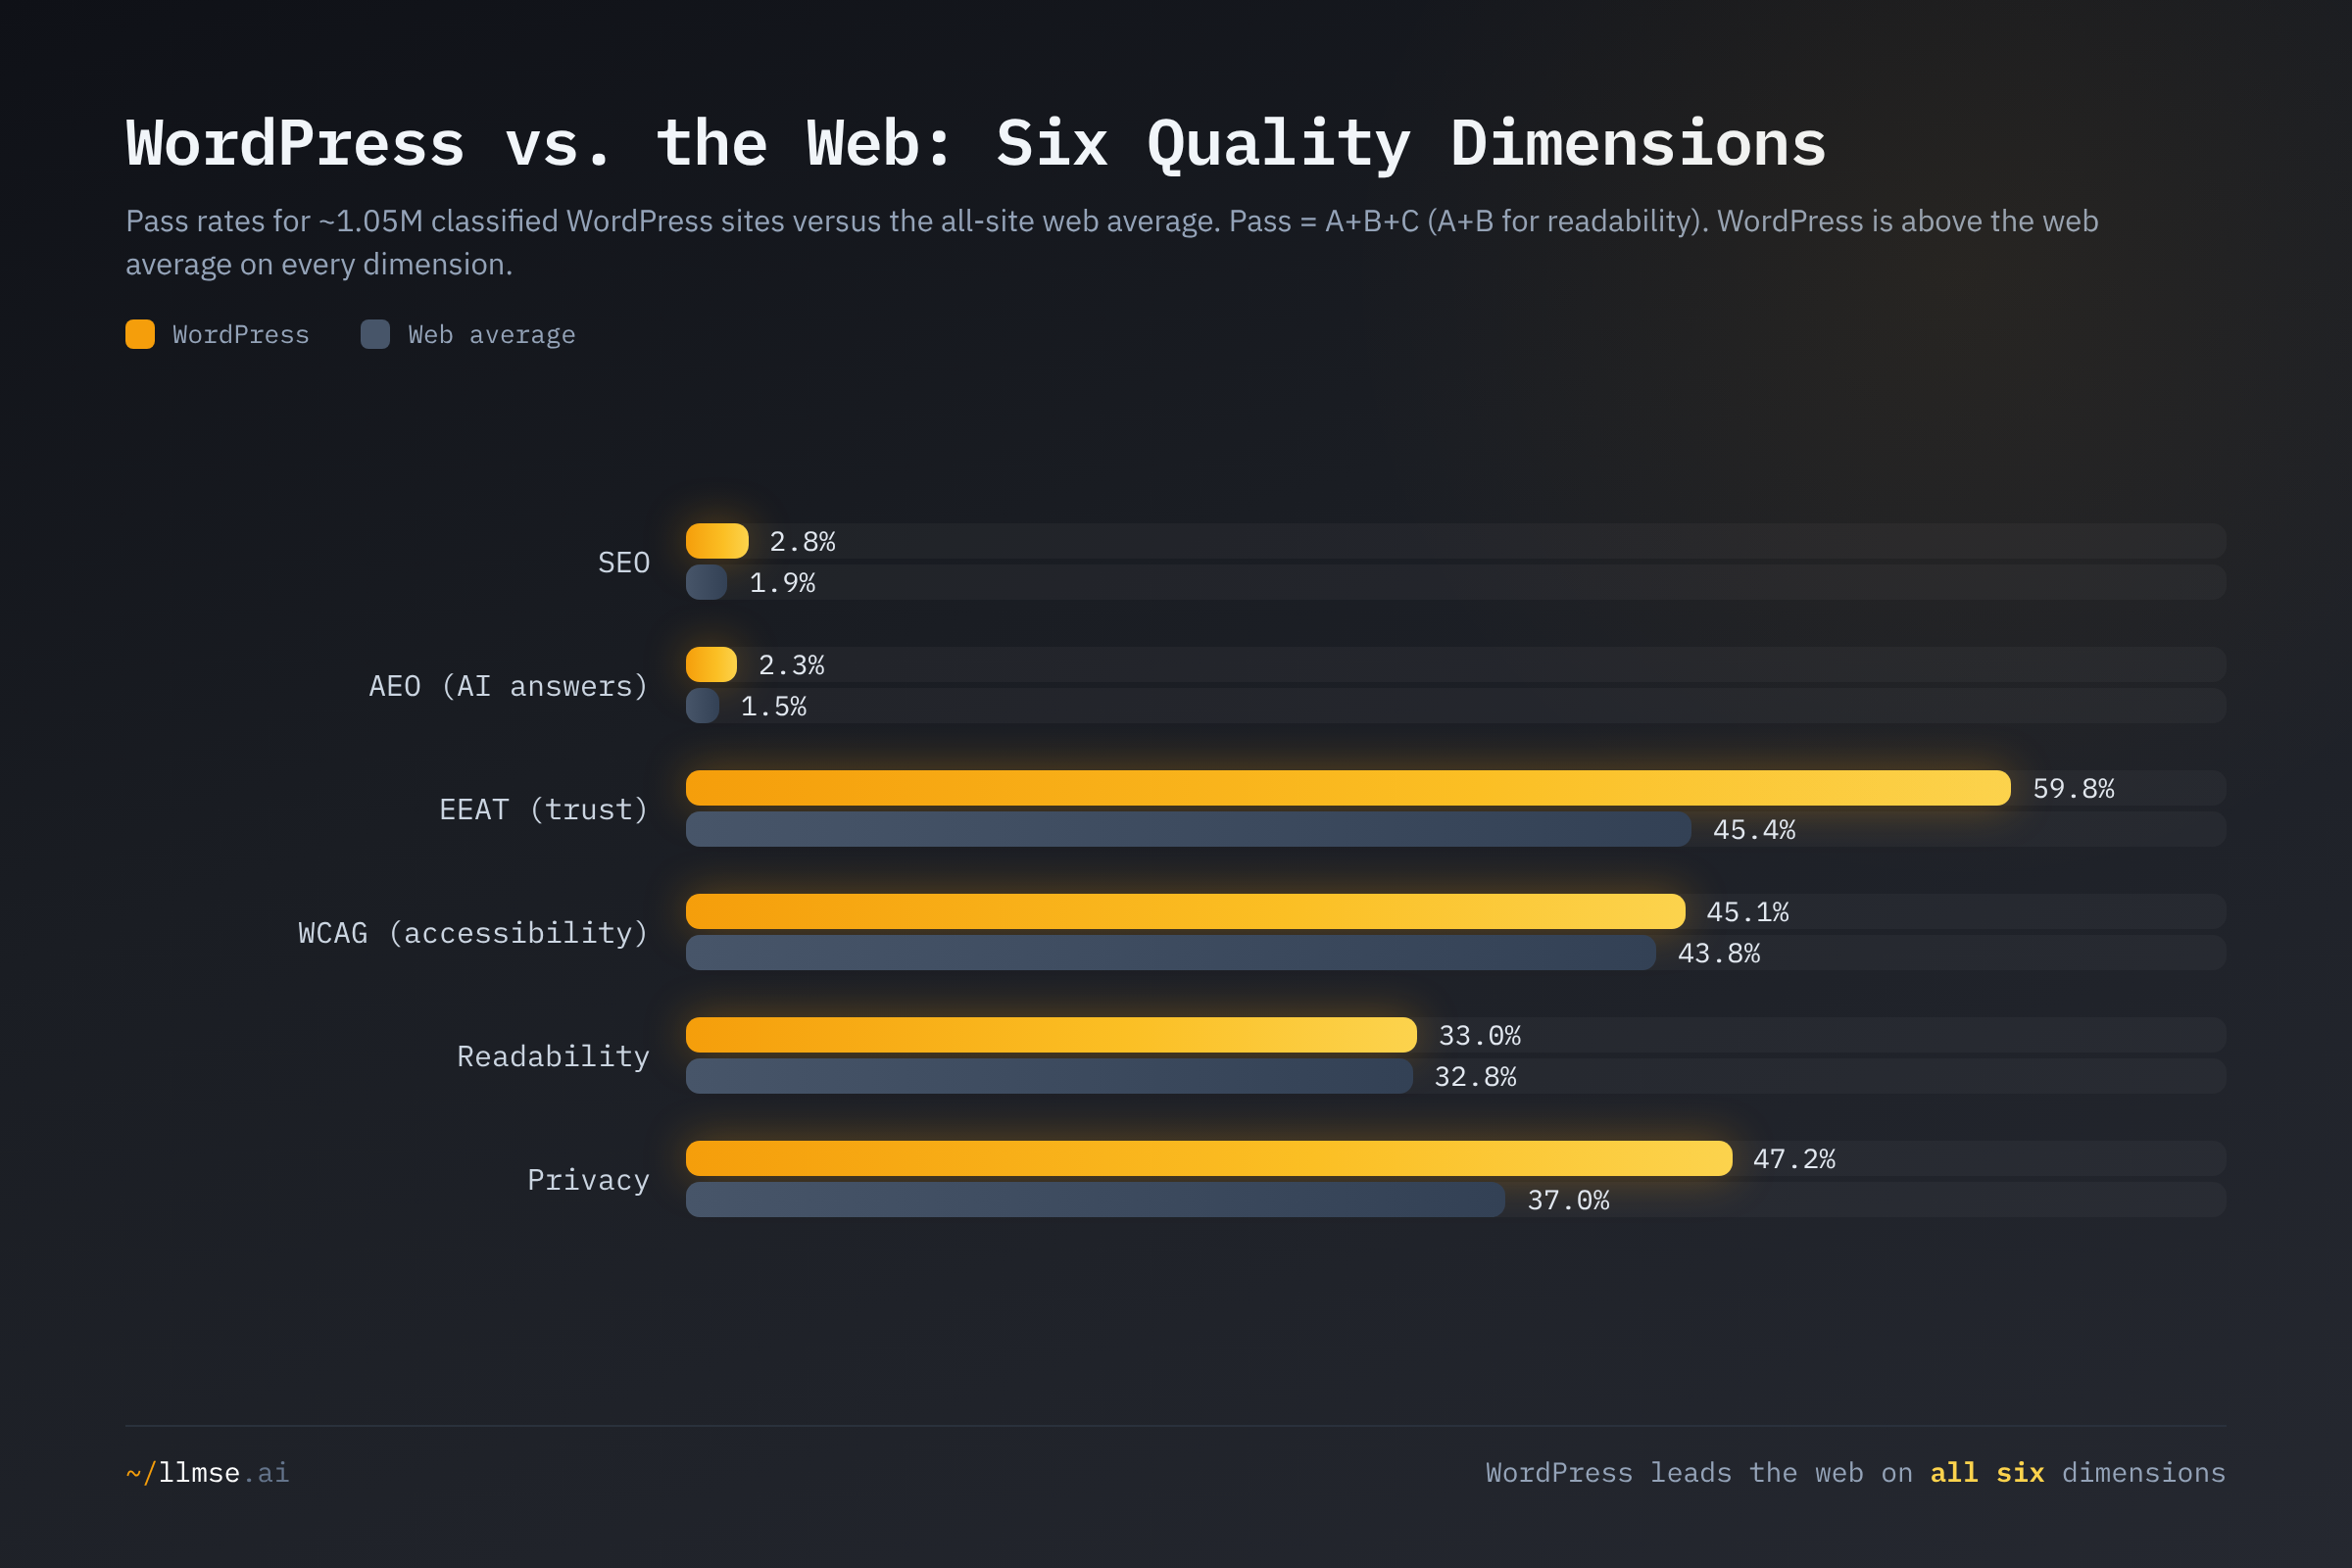
WordPress is above the web average on all six graded dimensions, and on brand safety. The largest gaps are on the dimensions a plugin ecosystem can automate: trust (EEAT, +14.4 points), privacy (+10.2 points), and discovery (SEO 1.5x, AEO 1.6x the web rate). The smallest gaps are on the dimensions a plugin cannot fake — accessibility (45.1% vs 43.8%) and readability (33.0% vs 32.8%) depend on themes and human writing, and there WordPress is barely ahead. This is the shape of a platform whose quality comes from bolted-on functionality, not from disciplined craft — which is exactly what the deep-dives confirm.
SEO: Above the Web, and Largely Automated
| Grade | WordPress | WordPress % | Web-wide % |
|---|---|---|---|
| A | 590 | 0.06% | 0.03% |
| B | 6,559 | 0.62% | 0.39% |
| C | 22,654 | 2.15% | 1.50% |
| D | 49,414 | 4.70% | 3.62% |
| F | 972,161 | 92.47% | 94.45% |
| Total | 1,051,378 |
WordPress passes technical SEO at 2.8% versus the 1.9% web average — about 47% more likely to pass than the typical site. On the stricter top-tier bar the original used, the lead is wider in relative terms: 0.68% of WordPress sites score A or B, against 0.43% web-wide — 58% above average (the original reported "69% above," a gap that has compressed as the index grew). Either way the absolute rates are tiny: more than 92% of WordPress sites still fail SEO outright, the same near-universal failure we see across every CMS and the whole web.
The plausible mechanism is automation, not effort. Yoast SEO alone runs on more than 13 million sites, with Rank Math and All in One SEO close behind; these plugins generate the meta tags, XML sitemaps, canonical URLs, and structured data that a hand-coded site has to author manually. WordPress owners are not optimizing for search so much as installing a plugin that does the baseline for them — which lifts the floor a point or two above the web without ever approaching "good."
The Cloudflare Effect: Where WordPress SEO Runs Hottest
The single most actionable pattern in the data is not about WordPress at all — it is about what sits in front of it. Splitting WordPress's SEO grades by the detected server reveals a gap that the CMS software cannot explain, because the software is identical across rows.
| Server | WordPress sites graded (SEO) | Pass (A+B+C) | Top-tier (A+B) |
|---|---|---|---|
| Cloudflare | 202,218 | 6.4% | 1.75% |
| LiteSpeed | 107,896 | 2.4% | 0.55% |
| Apache | 284,409 | 2.2% | 0.46% |
| nginx | 304,233 | 1.8% | 0.37% |
| WordPress average | 1,051,378 | 2.8% | 0.68% |
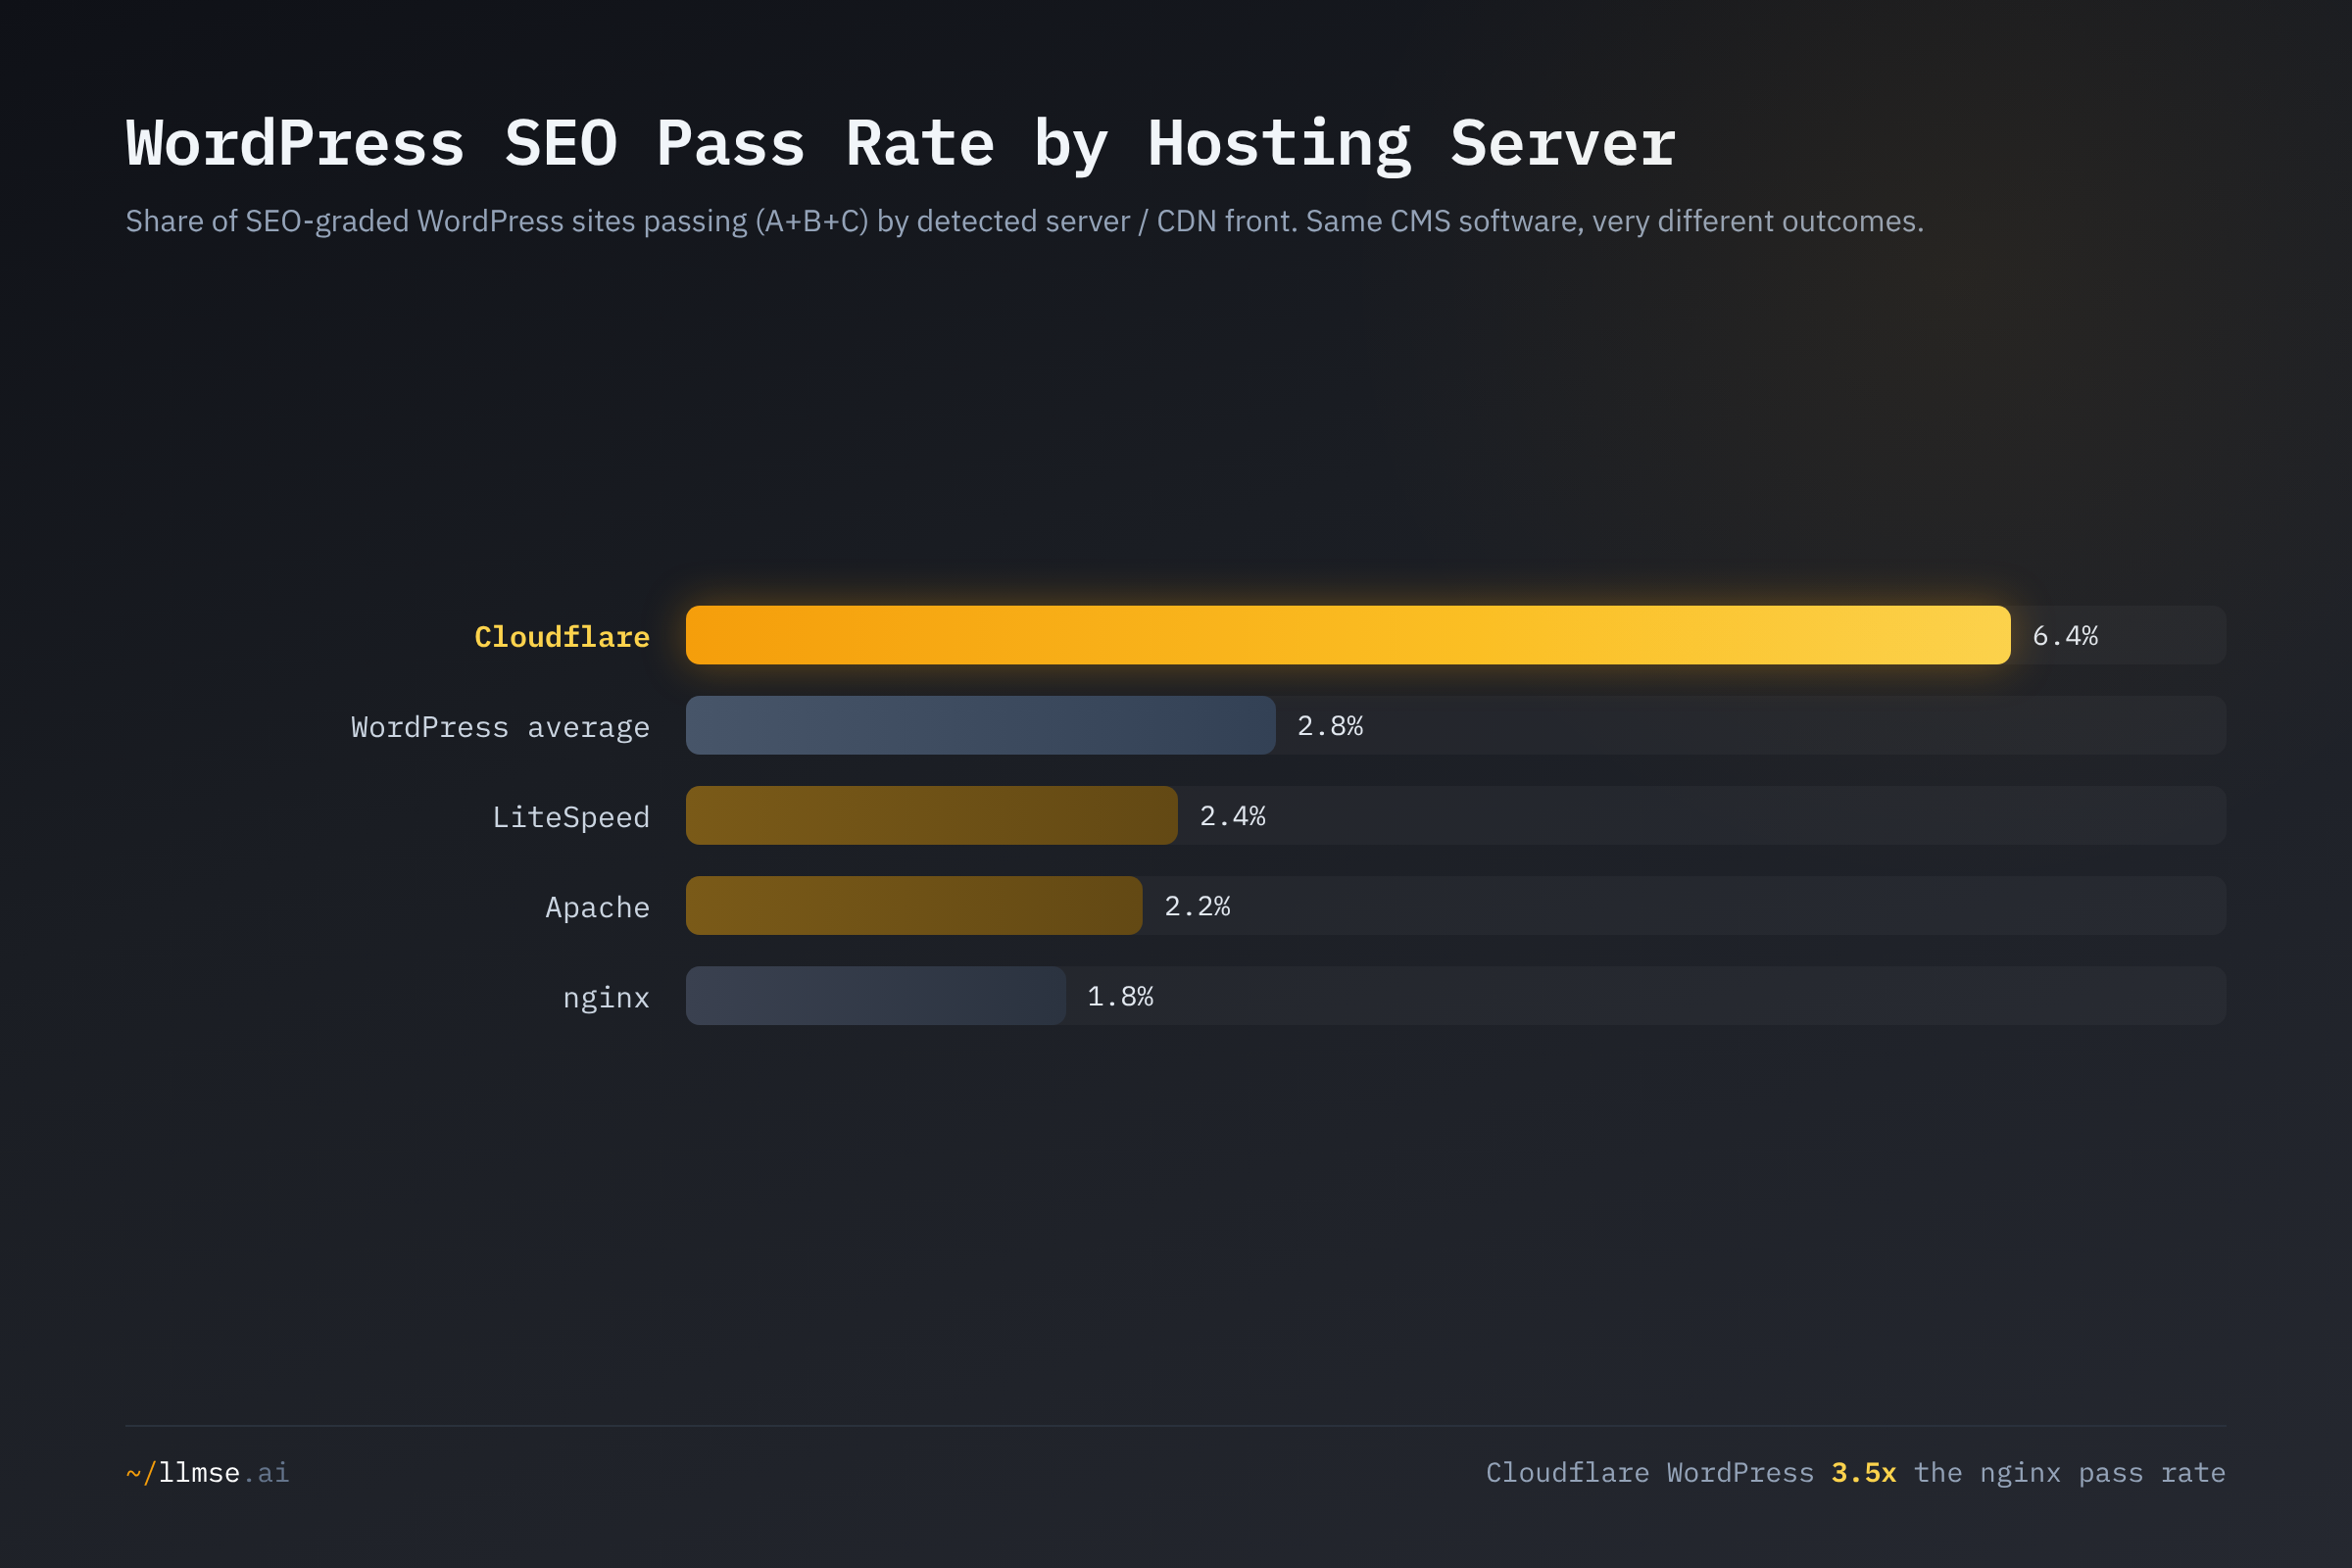
Cloudflare-fronted WordPress sites pass SEO at 6.4% — 3.5x the 1.8% rate of nginx-hosted WordPress running the same software. On the strict top-tier bar the multiple is even larger, 1.75% vs 0.37%, or 4.7x (down from the 7.3x the original reported, but still the widest server gap in the data). This is a correlation, not proof of causation: sites that choose Cloudflare may already be the more SEO-conscious operators, and selection alone could drive part of the gap. But the mechanism is plausible — Cloudflare's edge layer supplies automatic HTTPS, HTTP/2/3, Brotli compression, image optimization, and global caching, the page-experience signals Google folds into ranking — advantages that a WordPress site on raw nginx must replicate by hand. Apache (2.2%) edges nginx (1.8%), consistent with its .htaccess convenience for redirects, caching headers, and rewrites.
The Vietnamese and Turkish Outliers
WordPress's SEO rate is not evenly distributed across markets. Breaking the SEO grades down by content language shows the 2.8% average is pulled up by two hyper-optimized non-English markets.
| Language | WordPress sites graded (SEO) | Pass (A+B+C) | Top-tier (A+B) |
|---|---|---|---|
| Vietnamese | 11,017 | 19.8% | 6.0% |
| Turkish | 7,061 | 16.9% | 6.9% |
| Indonesian | 4,433 | 5.0% | 1.2% |
| French | 56,492 | 4.1% | 1.0% |
| German | 102,182 | 3.6% | 0.9% |
| Dutch | 47,274 | 3.2% | 0.7% |
| Spanish | 47,305 | 2.4% | 0.6% |
| English | 583,988 | 2.2% | 0.5% |
| Portuguese | 27,164 | 1.6% | 0.4% |
| Italian | 10,790 | 1.6% | 0.3% |
| Japanese | 31,906 | 1.0% | 0.1% |
| WordPress average | 1,051,378 | 2.8% | 0.7% |
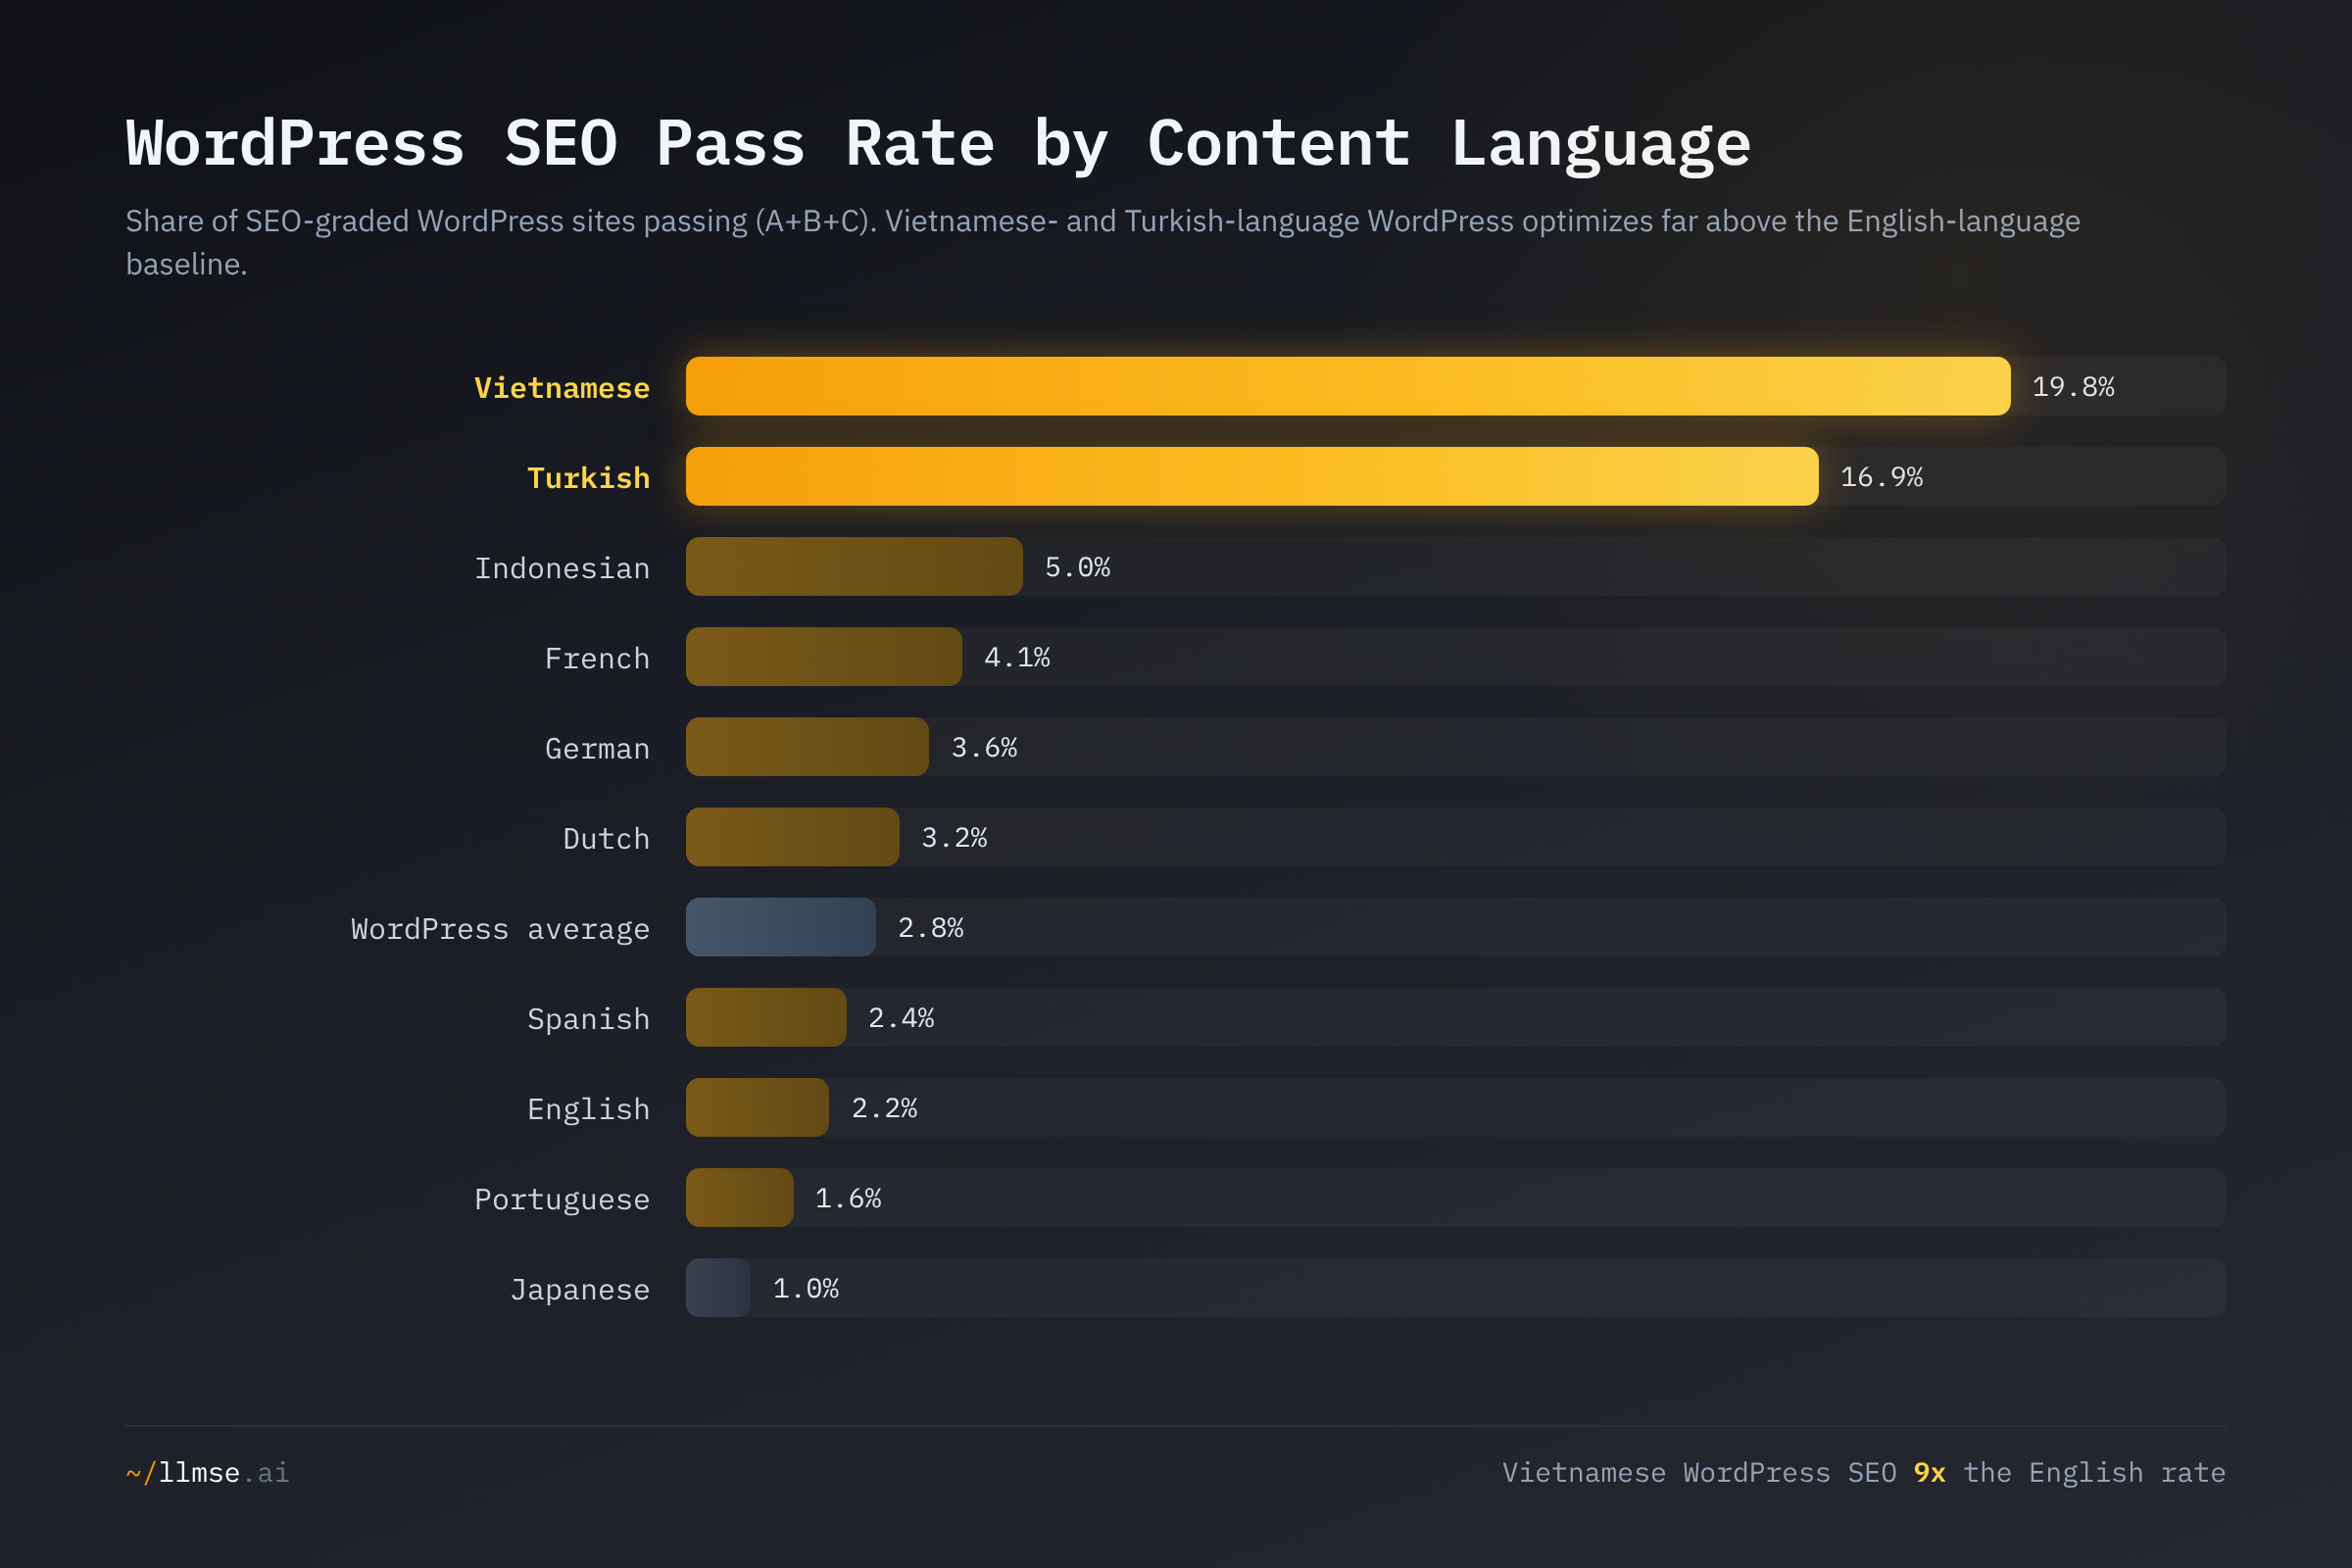
Vietnamese-language WordPress passes SEO at 19.8% and Turkish at 16.9% — roughly 9x and 8x the English-language rate, and on the strict A+B bar 13-15x it. This mirrors exactly the pattern we found in the gambling vertical, where Vietnamese and Turkish sites also optimized hardest, and the likeliest explanation is the same: in these markets WordPress has been adopted disproportionately by SEO-driven affiliate and digital-marketing operators rather than casual bloggers, and the local communities are organized around aggressive optimization. We state this as a correlation — language is a coarse proxy for market, and the rates describe optimization intensity, not legitimacy.
At the other end, Japanese WordPress posts the worst SEO of any major market at 1.0% — below even the all-web average. This is consistent with Japan's enterprise web culture, where high-quality sites tend to be custom-built and WordPress serves a smaller-business, less-optimized long tail.
EEAT: The Trust Engine
If SEO is where WordPress edges ahead, trust is where it pulls clear — and where the original's most-quoted claim now needs correcting.
| Grade | WordPress | WordPress % | Web-wide % |
|---|---|---|---|
| A | 69,740 | 6.6% | 5.5% |
| B | 255,524 | 24.3% | 16.0% |
| C | 302,478 | 28.8% | 23.9% |
| D | 285,691 | 27.2% | 47.3% |
| F | 136,825 | 13.0% | 7.3% |
| Total | 1,050,258 |
WordPress passes EEAT at 59.8% versus a 45.4% web average — 1.3x the web, not 2x. The original headline was that WordPress EEAT was "double the web average"; recomputed against the current index, that overstates it. Even on the strictest reading — counting only A and B grades, the top-tier bar the original actually used — WordPress leads the web 31.0% to 21.5%, a 1.44x edge. The signature finding survives; the "double" framing does not.
The structural tell is in the distribution, not the headline. Only 27.2% of WordPress sites land in the low-trust D tier, against 47.3% of the web — WordPress essentially empties out the bottom of the trust curve and piles sites into B and C. EEAT measures the signals Google's Search Quality Rater Guidelines reward — organizational identity, author credentials, contact information, editorial transparency — and WordPress's plugin ecosystem manufactures exactly those: schema-markup plugins emit Organization and Person data, author-bio plugins surface credentials, and contact-form plugins guarantee a contact path. Owners install these for function; the trust signal is a side effect. WordPress's trust advantage is real, broad, and almost entirely automated.
Trust by Category: Entertainment Leads, and the SEO Mirror Image
WordPress's trust performance is not uniform across what people build with it. Splitting the top-tier (A+B) EEAT rate by content category surfaces a clear leader and a clean paradox.
| Category | WordPress sites graded (EEAT) | EEAT pass (A+B+C) | EEAT top-tier (A+B) | SEO pass (A+B+C)* |
|---|---|---|---|---|
| Entertainment | 121,975 | 65.2% | 53.3% | 1.0% |
| Food & Drink | 19,425 | 68.5% | 37.3% | 3.9% |
| News & Media | 28,117 | 65.5% | 33.5% | 1.9% |
| Finance | 6,664 | 65.8% | 33.6% | 4.9% |
| Business & Industry | 329,551 | 63.7% | 32.5% | 2.6% |
| Education | 45,635 | 62.7% | 31.4% | 2.2% |
| Computer & Electronics | 18,613 | 59.4% | 28.4% | 3.3% |
| Health | 39,527 | 54.7% | 25.0% | 3.0% |
| WordPress average | 1,050,258 | 59.8% | 31.0% | 2.8% |
*SEO pass is computed over each category's SEO-graded population, which differs slightly from the EEAT-graded count shown.
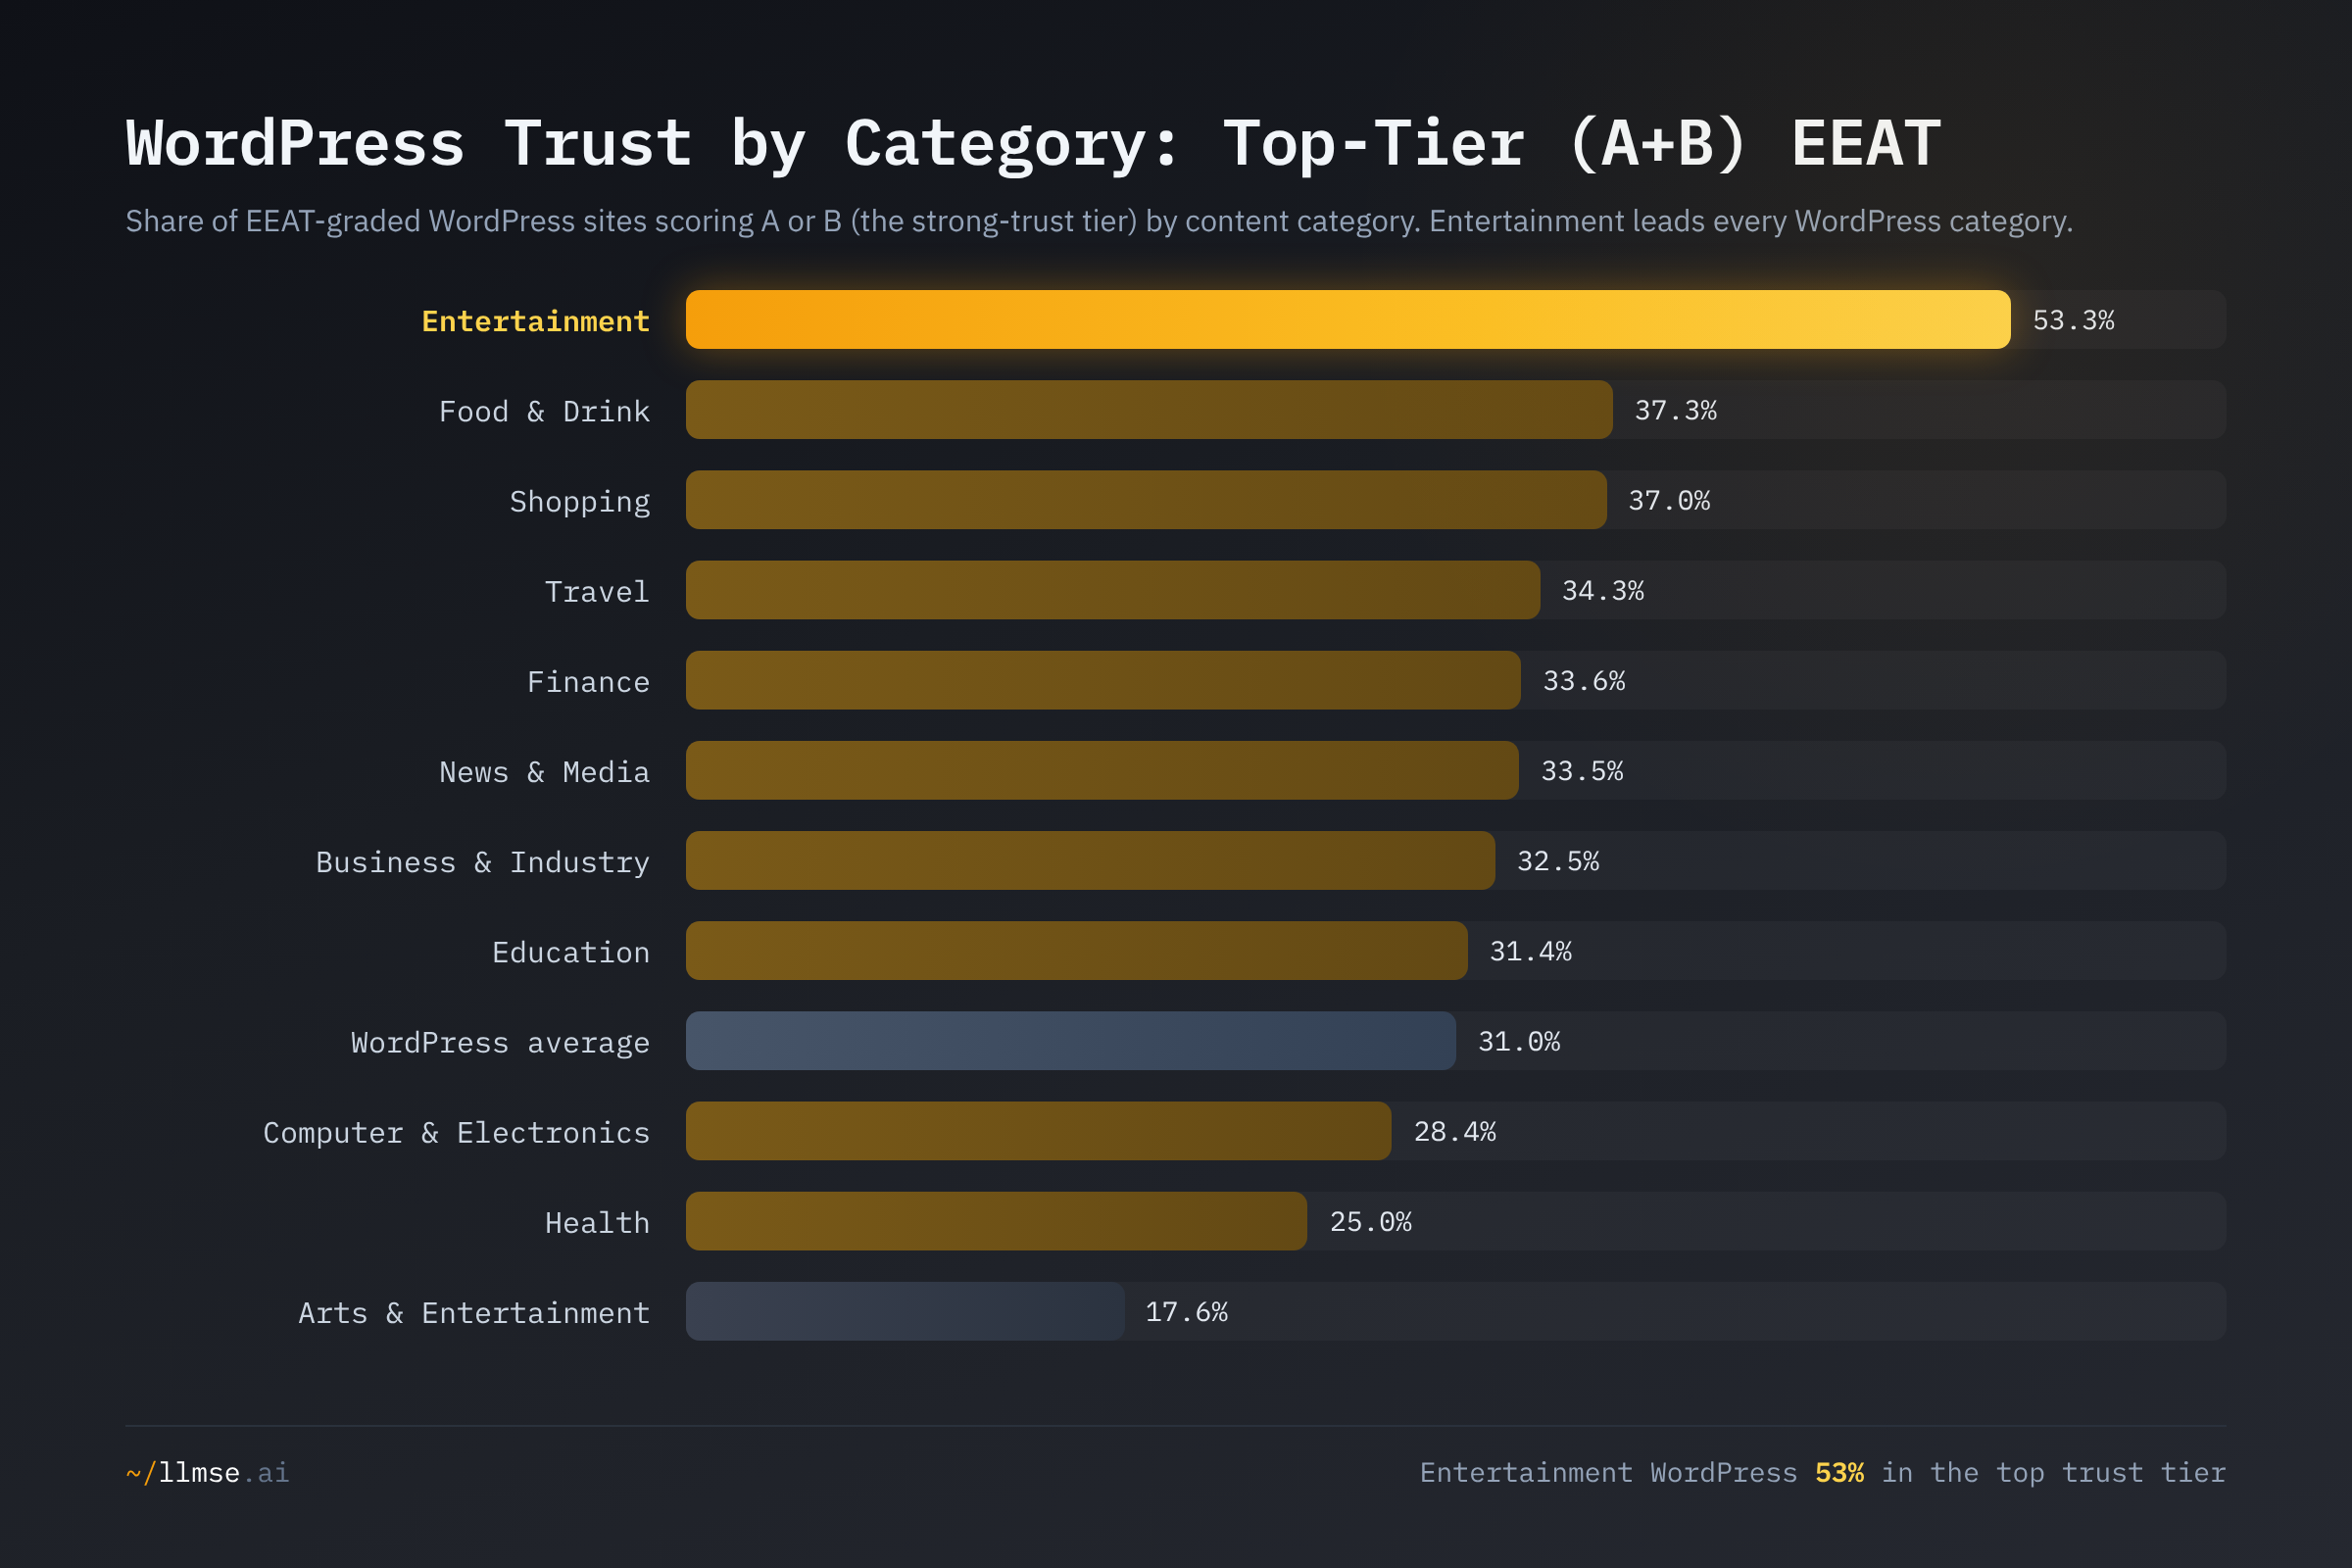
WordPress Entertainment sites are the trust champions, with 53.3% in the top A+B tier — 22 points above the WordPress average and the highest of any category. These are blogs, fan sites, creator sites, and review hubs that lean heavily on author profiles, social proof, and rich media — all EEAT-positive signals the plugin ecosystem makes trivial to add. Yet the same Entertainment sites have the worst SEO in the table at 1.0% — the mirror image of the trust result. Content-first WordPress sites accumulate the signals that read as trustworthy while neglecting the technical fundamentals that read as findable, and the discovery and trust axes come apart entirely.
The other end of the trust ranking is its own quiet finding: Health WordPress sites sit lowest at 25.0% top-tier EEAT, despite being the definitive "Your Money or Your Life" category where Google's helpful-content guidance demands the most credibility. The plugin ecosystem can install a trust badge; it cannot install medical expertise, and the grader appears to register the difference.
Accessibility, Readability, and Privacy: Quietly Above Average
The three remaining dimensions are where WordPress's lead is narrowest, and where the "automation, not craft" reading is clearest.
- WCAG accessibility: 45.1% vs 43.8% web-wide. Barely ahead. Accessibility depends on the theme's HTML — semantic structure, heading order, alt text, ARIA — which the open theme marketplace does not enforce. WordPress clears the bar by a hair precisely because no plugin can paper over a poorly coded theme. (Platform-controlled builders like Squarespace lead this dimension; see the CMS Quality Gap.)
- Readability: 33.0% vs 32.8% web-wide. The original's lone exception is now, just barely, a win — the refreshed baselines closed a sub-point gap. WordPress content clusters in the middle of the readability range: fewer catastrophic failures than the web, but few standout performers either. Writing quality is human, and the ecosystem cannot automate it.
- Privacy: 47.2% vs 37.0% web-wide. A 10-point lead, and the second-largest gap after trust. Consent-banner and cookie-policy plugins (a cottage industry since GDPR) install the visible privacy signals the grader checks — the same automation story as EEAT, applied to compliance.
Across all three, WordPress wins by the margin a plugin can deliver and no more. Where quality requires a human — accessible markup, clear prose — the lead shrinks to a rounding error.
The Paradox Explained
WordPress generates most of the web's plugin vulnerabilities and most of its own quality signals, and both facts trace to one design choice: an open plugin marketplace with minimal gatekeeping. Anyone can publish a plugin; most are maintained by small teams; security review is light. That is the vulnerability surface Patchstack measures — thousands of plugins, thousands of exploit vectors, 91% of 2025's disclosures living in exactly that third-party layer.
The same marketplace ships Yoast, Rank Math, schema and author-bio plugins, consent-management tools, and contact forms — software that automates the SEO, EEAT, and privacy signals competing platforms require custom development to produce. Vulnerability count and quality signals measure different things, and the open ecosystem inflates both at once. A WordPress site can run an unpatched plugin (a real risk) while that same plugin emits sitemaps, schema, and a consent banner (real quality signals). Both are true simultaneously.
This reframes WordPress's market dominance, too. Owning 41.9% of the web is usually read as inertia — WordPress wins because it is the default. The quality data suggests a complementary reading: the default option also clears the web's average quality bar on every dimension we grade, which is not what "race to the bottom" would predict. The attack surface and the quality floor are produced by the same extensible architecture. You cannot have one without the other.
What's at Stake
- The "WordPress is low quality" narrative is empirically wrong — at 1.06M sites in our index alone, scoring above the web average on every dimension, the platform's quality reputation lags its measured output. Decision-makers choosing a CMS on the basis of WordPress's security headlines are weighing only one side of the ledger.
- Hosting is a larger quality lever than the CMS — the 3.5x SEO gap between Cloudflare- and nginx-fronted WordPress dwarfs the gap between WordPress and the web. Where you run a site correlates with its discoverability more than which CMS you picked.
- WordPress's trust advantage is automated, which makes it shallow where it matters most — Health WordPress trails every other category on top-tier trust, because plugins can emit credibility markup but not credibility. In YMYL categories, an above-average EEAT score is not the same as an expert source, and AI answer engines that lean on EEAT-style signals risk over-trusting well-pluginned but thin pages.
- The security risk is concentrated in the same layer that delivers quality — 91% of disclosures are in plugins, the exact components that generate the SEO, trust, and privacy signals. Disabling plugins to reduce attack surface also strips the quality signals; the trade-off is structural, not incidental.
What Would Help
- WordPress site owners: your highest-leverage move is the front end, not another plugin. Moving from raw nginx to a Cloudflare-fronted setup correlates with a 3.5x higher SEO pass rate — more than any single SEO plugin delivers. Pair it with disciplined plugin updates, since the same layer is your attack surface. Check your own grades at llmse.ai/classify.
- Content and YMYL teams: treat automated trust signals as necessary, not sufficient. WordPress will hand you schema, author boxes, and contact forms that lift EEAT — but Health's category-low trust score shows the grader still distinguishes real expertise. Invest in credentials, citations, and editorial review the plugins cannot fabricate.
- Developers and theme authors: accessibility and readability are the unautomatable gaps. WordPress's narrowest leads (WCAG 45.1%, readability 33.0%) are precisely the dimensions plugins cannot fix. Accessible semantic markup and plain-language editing are where deliberate effort still moves the number.
- CMS decision-makers: stop treating vulnerability counts as quality verdicts. WordPress's 91%-of-disclosures statistic and its above-average quality on every dimension are two faces of one open architecture. Evaluate the trade-off explicitly rather than ruling the platform out on its security headlines. The cross-platform picture is in The CMS Quality Gap.
- AI answer engines and SEO platforms: weight provenance over plugin output. Because WordPress automates the exact signals EEAT and AEO reward, naive retrieval will over-surface well-pluginned WordPress content regardless of underlying expertise. Prefer authoritative sources within YMYL topics rather than whatever is best marked up.
This analysis was conducted using LLMSE, which has classified over 3.4 million websites across SEO, EEAT, AEO, WCAG accessibility, readability, GARM brand safety, and privacy dimensions. WordPress figures reflect 1,060,974 sites detected running WordPress in the index as of June 2026. To analyze your own site across every dimension in this post, visit llmse.ai/classify.