The Education Sector Web Quality Report: 123,000 Sites That Read Harder Than the Web They Serve
Update — 2026-06-29: Refreshed against LLMSE's current index of 3.4 million classified URLs (up from ~1.5M at first publication) and expanded to six graded dimensions, adding AEO (AI-answer optimization) and Privacy. The readability gap is intact and slightly wider — education reads harder than the web (23.3% pass vs 32.8%). But the original's claim that education trails the web on EEAT trust is now false: under the standard A+B+C pass definition and the much larger graded sample, education leads the web on trust (59.5% vs 45.4%). The hand-built CMS/server cross-tabs and the 91.9% female figure were dropped and replaced with reproducible category and subcategory analysis (84.1% female), and four new charts were added. The core thesis survives: education is at or above the web on every dimension except the one central to its mission — readability.
Education websites exist for one reason: to help people learn. Branding, recruitment, enrollment funnels — everything else is secondary to making knowledge accessible. So the single most important question to ask of an education website is not whether it ranks or converts. It is whether a person can read it.
On the rest of the scorecard, education does well. Across SEO, AI-answer optimization, trust signals, accessibility, and privacy, education sites land at or above the average website — in two cases comfortably above. This is not a sector that neglects its web presence. If anything, it over-indexes on the technical and trust signals that search engines reward.
The exception is the one that matters most. Education content is measurably harder to read than the average web page — and the gap is widest among the institutions with the most writing faculty, the most communications staff, and the largest marketing budgets. Colleges, universities, and postgraduate programs produce the least readable content in the entire sector.
We cross-referenced the ~123,000 sites LLMSE classifies under Education — K-12 schools, colleges and universities, online-learning platforms, assessment and testing services, adult and language learning — against six quality dimensions: SEO, AEO, EEAT (trust), WCAG accessibility, readability, and privacy. Every grade comes from LLMSE's automated analysis pipeline applied uniformly across the index, not a hand-picked sample of flagship campuses.
The headline finding: education passes a baseline readability check just 23.3% of the time, versus 32.8% web-wide — roughly 29% worse than the average website. The institutions whose job is teaching write some of the web's least teachable pages, and the prestige institutions write the worst of all.
The Data
We identified 123,551 domains classified under the Education category as of June 2026. Pass rates are computed over the population actually graded on each dimension — not every URL carries every grade — so the per-dimension denominators differ slightly.
| Dimension | Education sites graded | Education pass rate | Web average |
|---|---|---|---|
| SEO | 121,958 | 1.8% | 1.9% |
| AEO (AI answers) | 121,582 | 2.1% | 1.5% |
| EEAT (trust) | 121,894 | 59.5% | 45.4% |
| WCAG (accessibility) | 121,673 | 42.3% | 43.8% |
| Readability | 121,674 | 23.3% | 32.8% |
| Privacy | 121,525 | 40.9% | 37.0% |
| GARM brand safety (A) | 97,447 | 100% | 90.2% |
Education is at or above the web average on every dimension except readability, where it falls nearly ten points short. Brand safety is effectively perfect — every graded education site carries GARM's "A" (safe) grade, which is unsurprising for a category of benign, informational content.
The audience profile is striking. Of education sites carrying an inferred audience gender, 84.1% target a female audience (103,782 sites), 15.9% target all genders (19,653), and exactly one site is tagged male. This is among the most female-skewed categories in the index, consistent with the demographics of both the workforce (teaching is a majority-women profession) and the audience for educational content. The gender tag is an automated inference from site content, not a declared attribute, and should be read as a content signal rather than ground truth.
The sector is also less English-dominated than most: English accounts for 61.2% of education sites (75,673), followed by German (7.3%), Spanish (4.3%), French (4.0%), Dutch (2.9%), and Portuguese (2.3%) — a long multilingual tail that reflects education's inherently local character. Schools and universities serve regional populations in regional languages.
Subcategory Breakdown
Education's subcategories form a near-exact partition of the category (they sum to within one site of the total), so the shares below are meaningful.
| Subcategory | Sites | Share |
|---|---|---|
| College Education | 22,243 | 18.0% |
| Educational Assessment | 18,115 | 14.7% |
| Primary Education | 13,683 | 11.1% |
| Online Education | 13,366 | 10.8% |
| University Education | 8,790 | 7.1% |
| Undergraduate Education | 8,648 | 7.0% |
| Homeschooling | 8,202 | 6.6% |
| Standardized Testing | 5,950 | 4.8% |
| Early Childhood Education | 5,189 | 4.2% |
| Adult Education | 4,265 | 3.5% |
| Language Learning | 4,097 | 3.3% |
| Twelve smaller subcategories | ~10,900 | ~8.9% |
Higher education (College + University + Undergraduate + Postgraduate) is the largest block at roughly a third of the category; assessment and testing services together account for nearly one site in five.
Methodology
This post makes quantitative claims, so the definitions and limits matter.
- Grades and "pass". Each site is graded A-F by a dedicated automated analyzer (there is no E grade). "Pass" means A+B+C for SEO, AEO, EEAT, WCAG, and Privacy, and A+B for Readability (a Flesch Reading Ease score of roughly 50+, ≈ 8th-grade reading level or below). SEO grades technical fundamentals; AEO grades answer-extractability and AI-citation signals; EEAT grades experience/expertise/authoritativeness/trust signals; WCAG covers automated accessibility checks (~30-40% of WCAG 2.1 Level A — full conformance requires manual testing); Privacy grades consent gating, policy presence, and tracker behavior; GARM "safe" is the A grade only.
- Classification basis. Category and subcategory membership is by LLM classification; each grade is an independent automated analyzer. Where a check is heuristic — notably WCAG, which is static-HTML only — the coverage caveat above applies.
- Cross-references are computed as set intersections (Redis
ZINTERCARD) between the Education index (or a subcategory, language, or audience index) and each grade index. All counts are aggregate; no individual site is identified. - Known limits. Pass rates are over graded populations, which are smaller than the raw category size. The Readability grade uses Flesch scoring, which is calibrated for English, so it understates readability for the sector's substantial non-English tail — treat the absolute readability figure as indicative and the relative gap (education vs the whole web, measured the same way) as the robust finding. Several subcategories are small (Postgraduate ~1.3K, Secondary ~1.6K, Special Education ~1.1K, Homework & Study ~1.0K graded); their rates are directional. Russian-language sites are excluded from every aggregate.
- Why these numbers differ from the 2026-03 original. The graded population grew from ~1.5M to ~3.4M URLs, and early grades skewed toward higher-quality, more-visible sites, so most absolute pass rates drifted a few points as coverage broadened (web EEAT 48.4%→45.4%, readability 35.3%→32.8%). Two corrections follow directly. First, EEAT: the original reported education below the web on trust, but it compared an A+B cut on a small early sample; under the standard A+B+C definition and the full population, education is above the web (59.5% vs 45.4%). Second, the original's hand-built CMS and server cross-tabs (Drupal, Moodle, Medium, nginx/Apache) and the 91.9% female figure have been dropped in favor of reproducible category- and subcategory-level analysis; the refreshed gender split is 84.1% female.
The Scorecard
Plotting education against the all-category web average across every dimension produces a distinctive shape: a sector that meets or beats the web almost everywhere, with one conspicuous shortfall.
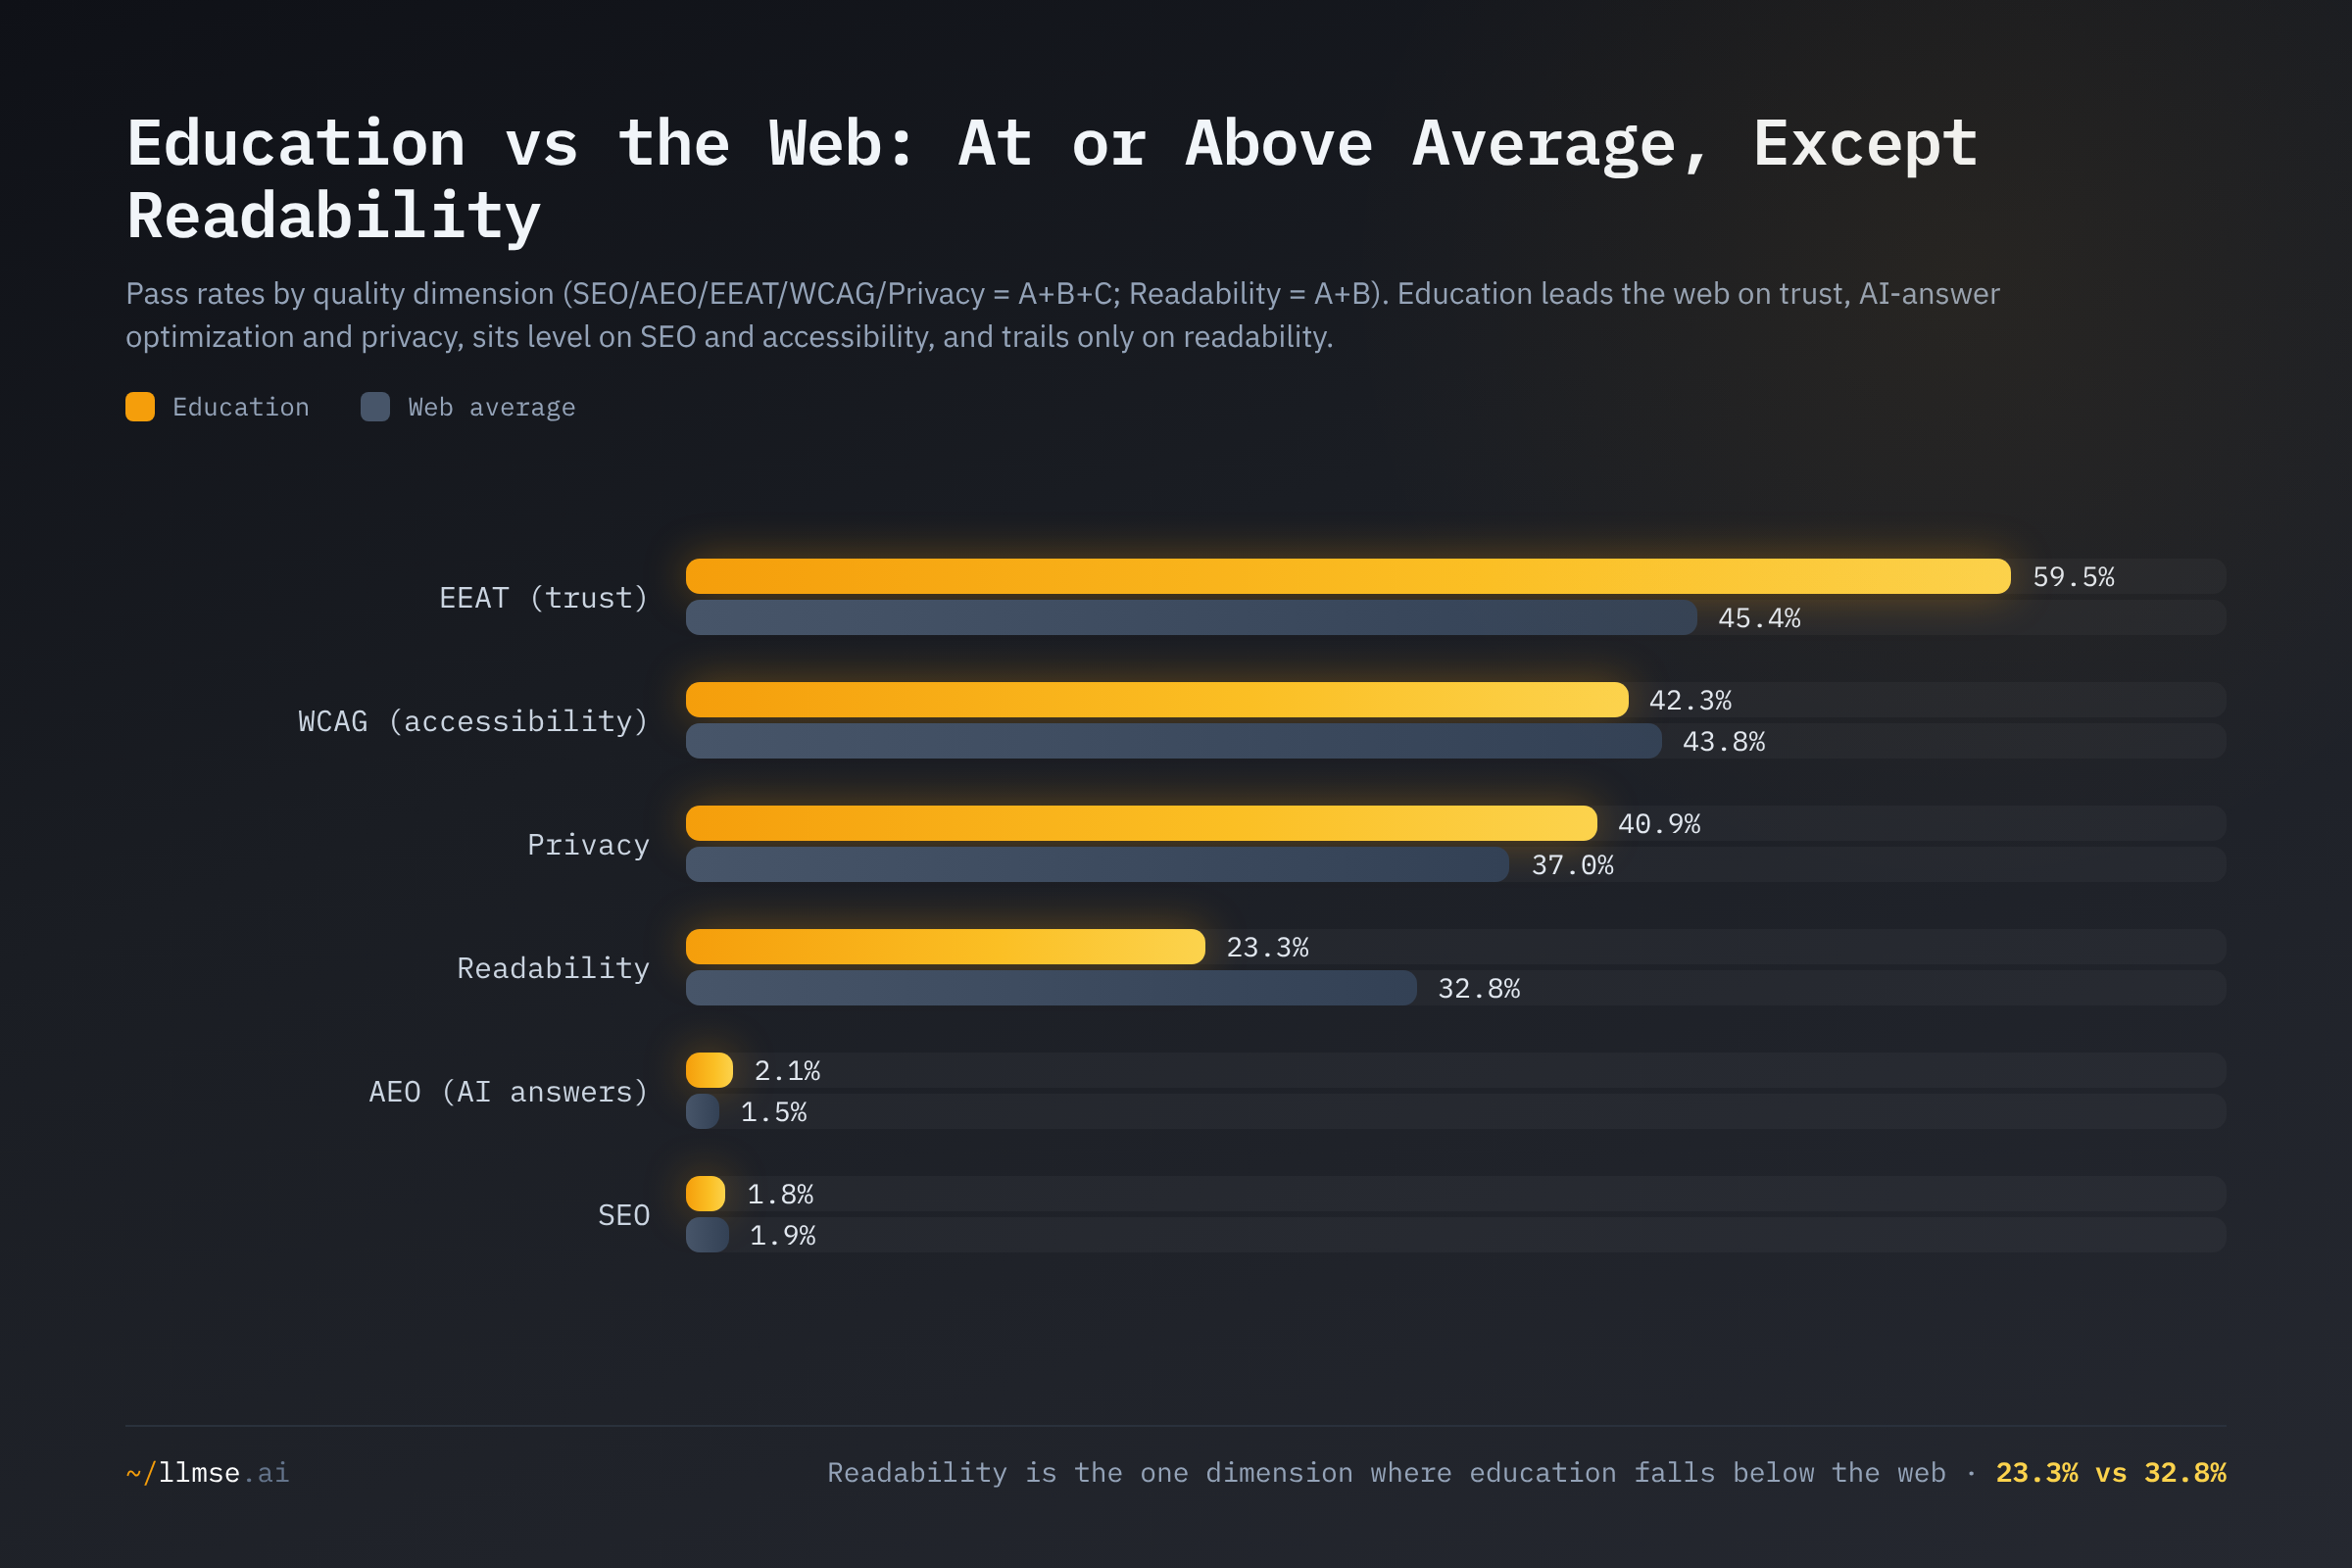
Education is at or above the web average on five of six dimensions, and below it on exactly one: readability. That is the tell. A sector that neglected its web presence would trail across the board; education instead clears the bar on discovery (SEO 1.8% ≈ web 1.9%, AEO 2.1% > web 1.5%), beats it on trust (EEAT 59.5% vs 45.4%) and privacy (40.9% vs 37.0%), and sits level on accessibility (42.3% vs 43.8%). The single dimension it fails is the one most central to its mission. The rest of this report card is the story of that gap — where it comes from, and why it is concentrated in the most prestigious corners of the sector.
This profile inverts the original report's framing. The 2026-03 version led with education as a laggard on trust and a standout on accessibility; the refreshed, full-population data shows the opposite emphasis — trust is now a strength, accessibility is merely average, and readability is the lone, durable weakness.
Readability: The One Thing Education Should Be Best At
This is the headline finding, and the one that matters most for an industry whose core product is comprehension.
| Grade | Education % | Web % |
|---|---|---|
| A (easiest, ≈8th-grade or below) | 12.4% | 19.7% |
| B | 10.9% | 13.1% |
| C | 33.8% | 30.7% |
| D | 23.5% | 14.6% |
| F (hardest) | 19.4% | 21.9% |
Readability pass rate (A+B): education 23.3%, web 32.8%.
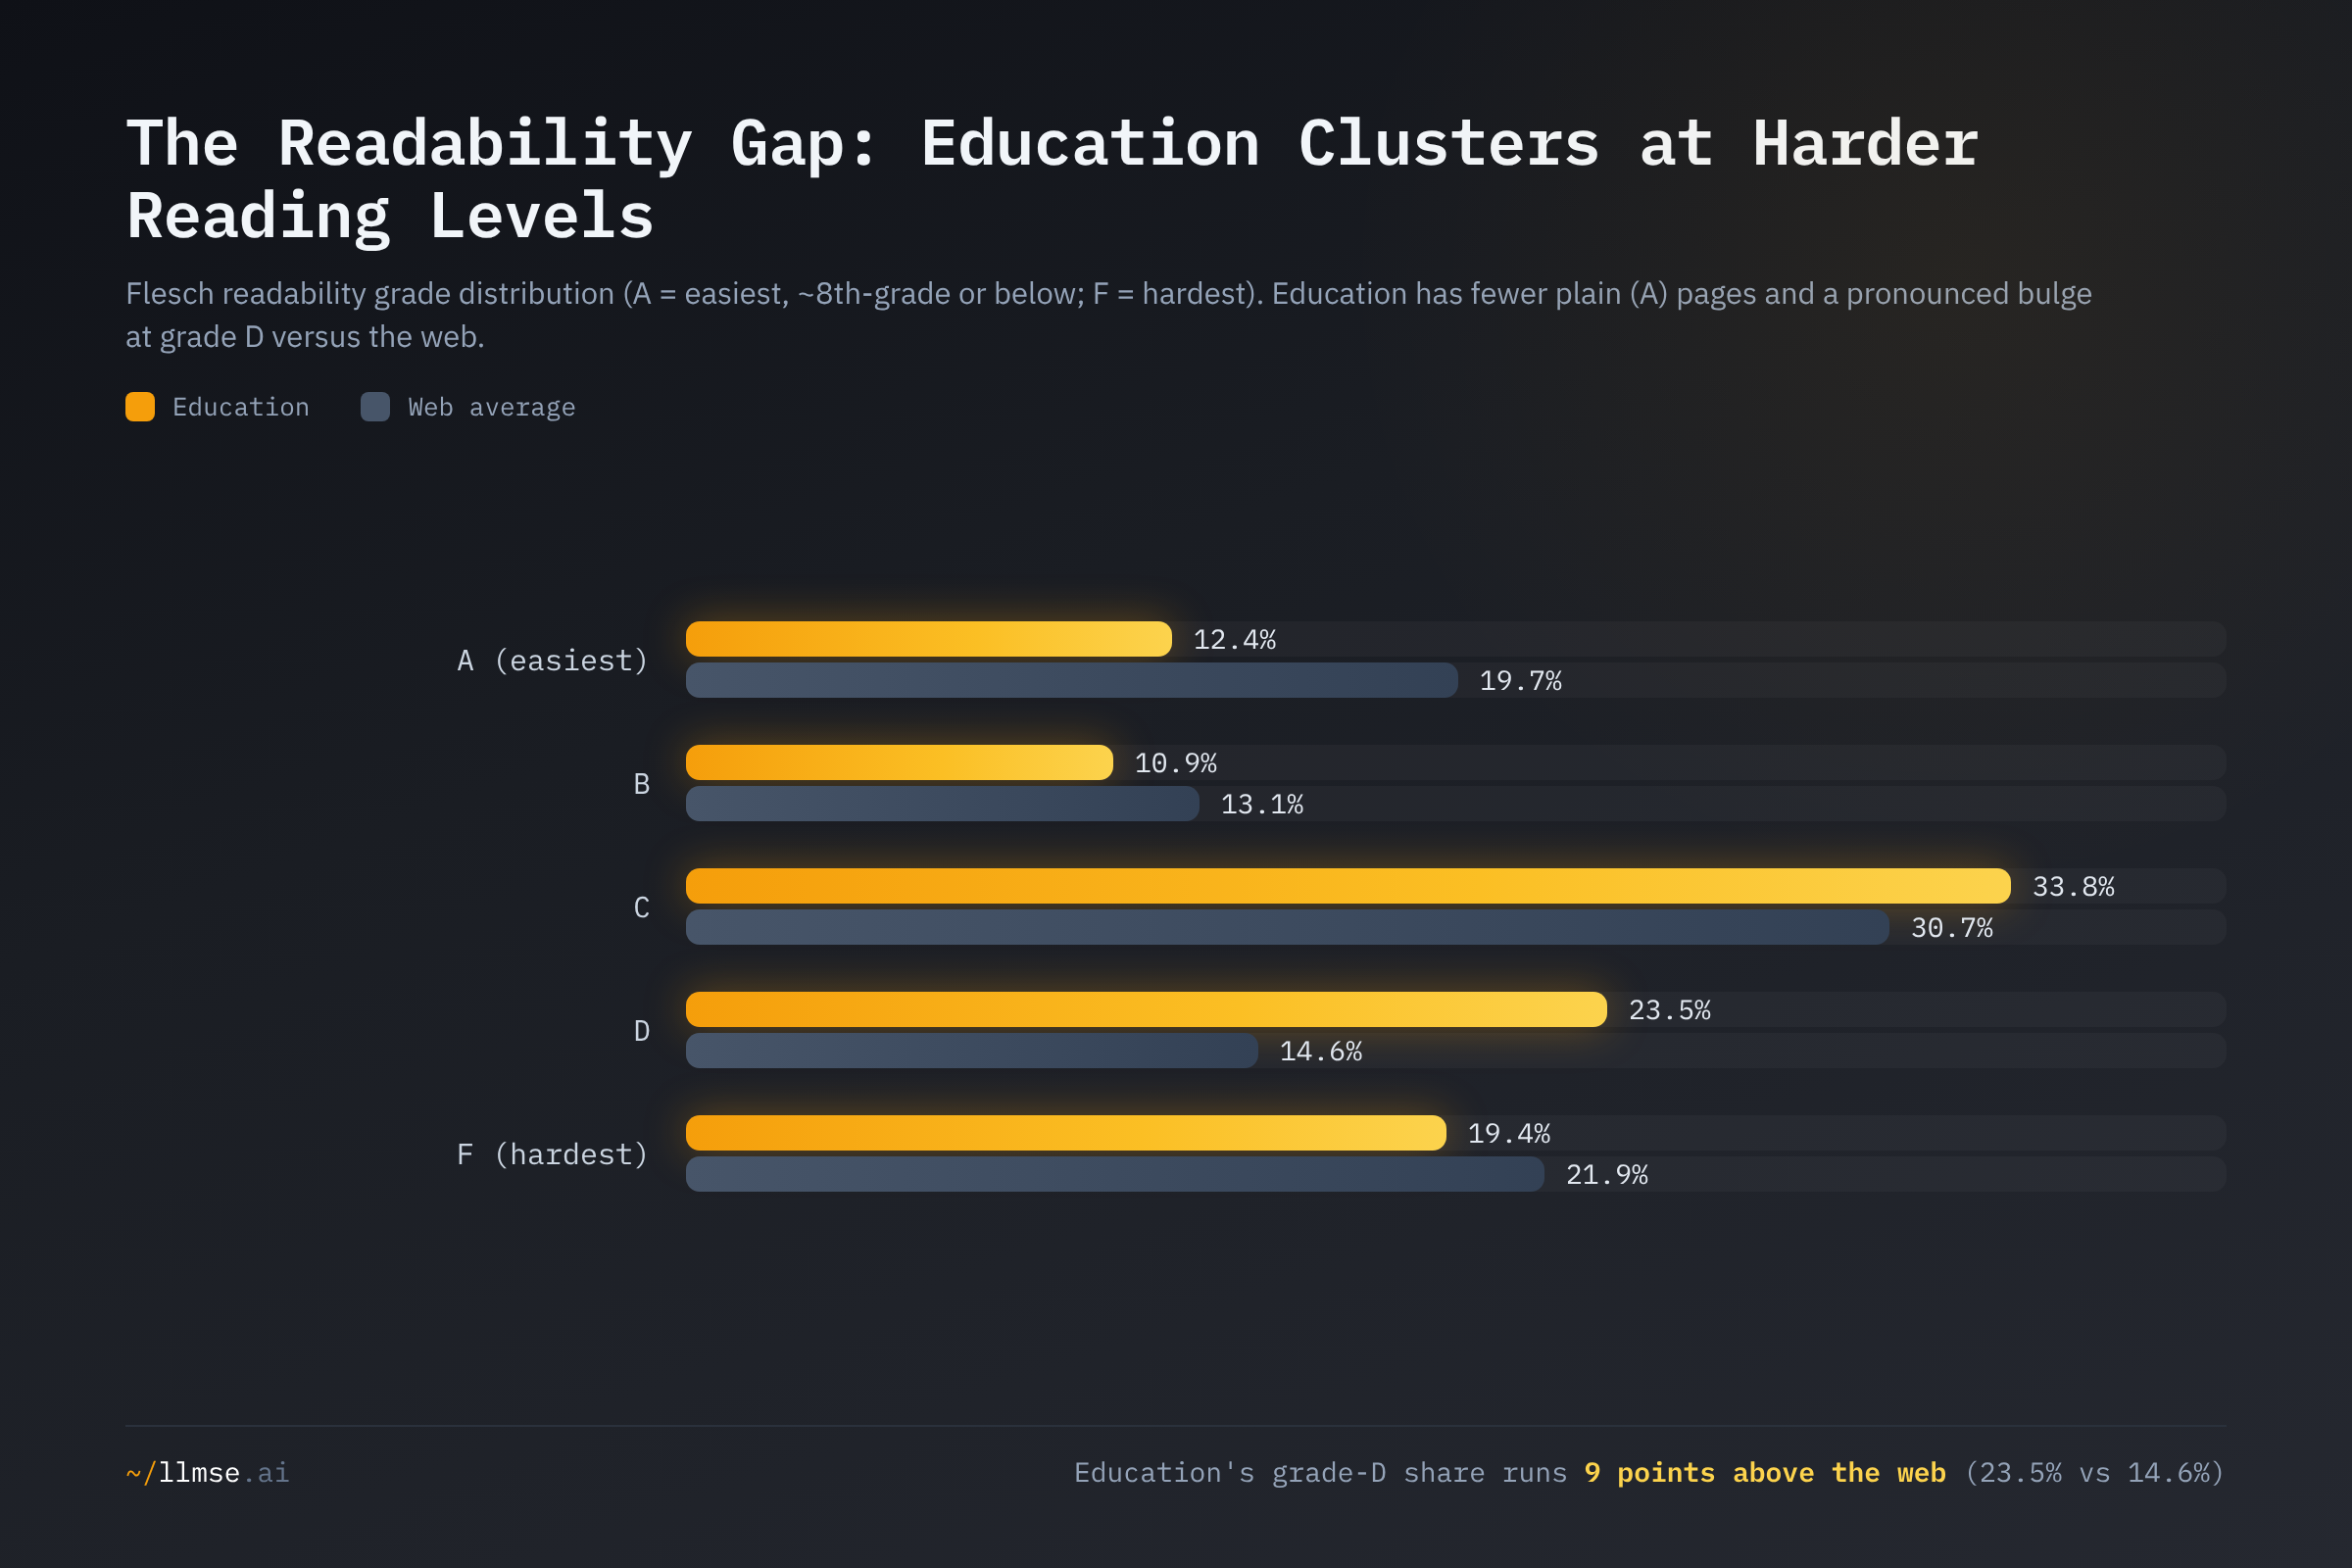
The shape of the gap is as telling as its size. Education has far fewer plain (A) pages — 12.4% versus the web's 19.7% — and a pronounced bulge at grade D: 23.5% of education content lands in the second-hardest band, against 14.6% web-wide. Education content doesn't just skew slightly harder; it clusters at college-and-above complexity, exactly the reading level that excludes the broadest audience.
That matters because the audience is not academic. The U.S. Department of Education's adult-literacy data finds that 54% of American adults read below a sixth-grade level — roughly 130 million people — far below the level most education sites are written at. Plain-language research and policy have pointed the same direction for years: the U.S. Plain Writing Act of 2010 requires federal agencies to write "clear Government communication that the public can understand and use," treating comprehension as a baseline public obligation rather than a stylistic nicety. None of that pressure reaches an admissions page or a financial-aid explainer. When a university's aid page is harder to read than the average website, the institution is filtering for reading ability before a student even applies — a barrier that falls hardest on first-generation, returning, and second-language learners.
We frame this as a correlation, not a verdict on any institution: Flesch scoring measures sentence and word complexity, not pedagogical quality, and academic subject matter is genuinely harder to simplify. But the comparison is like-for-like — every site on the web is scored the same way — and education comes out measurably behind.
Who Reads Hardest: The Prestige Penalty
Splitting readability by subcategory sharpens the paradox. The least readable content is not produced by under-resourced schools — it is produced by the most prestigious institutions in the sector.
| Subcategory | Sites (read.) | Readability (A+B) | EEAT (A+B+C) |
|---|---|---|---|
| Postgraduate Education | 1,339 | 8.8% | 69.0% |
| University Education | 8,665 | 11.3% | 63.8% |
| College Education | 21,396 | 12.4% | 72.4% |
| Professional School | 2,545 | 16.5% | 59.3% |
| Standardized Testing | 5,935 | 21.2% | 25.6% |
| Undergraduate Education | 8,549 | 21.6% | 58.8% |
| Secondary Education | 1,638 | 21.7% | 54.1% |
| Educational Assessment | 17,786 | 23.2% | 71.1% |
| Private School | 1,986 | 26.1% | 61.3% |
| Online Education | 13,174 | 27.9% | 55.8% |
| Early Childhood Education | 5,139 | 28.5% | 64.7% |
| Primary Education | 13,641 | 29.7% | 53.5% |
| Homeschooling | 8,195 | 34.3% | 35.3% |
| Adult Education | 4,186 | 35.5% | 68.8% |
| Homework & Study | 1,047 | 39.1% | 45.7% |
| Language Learning | 4,077 | 39.6% | 47.7% |
| Web average | — | 32.8% | 45.4% |
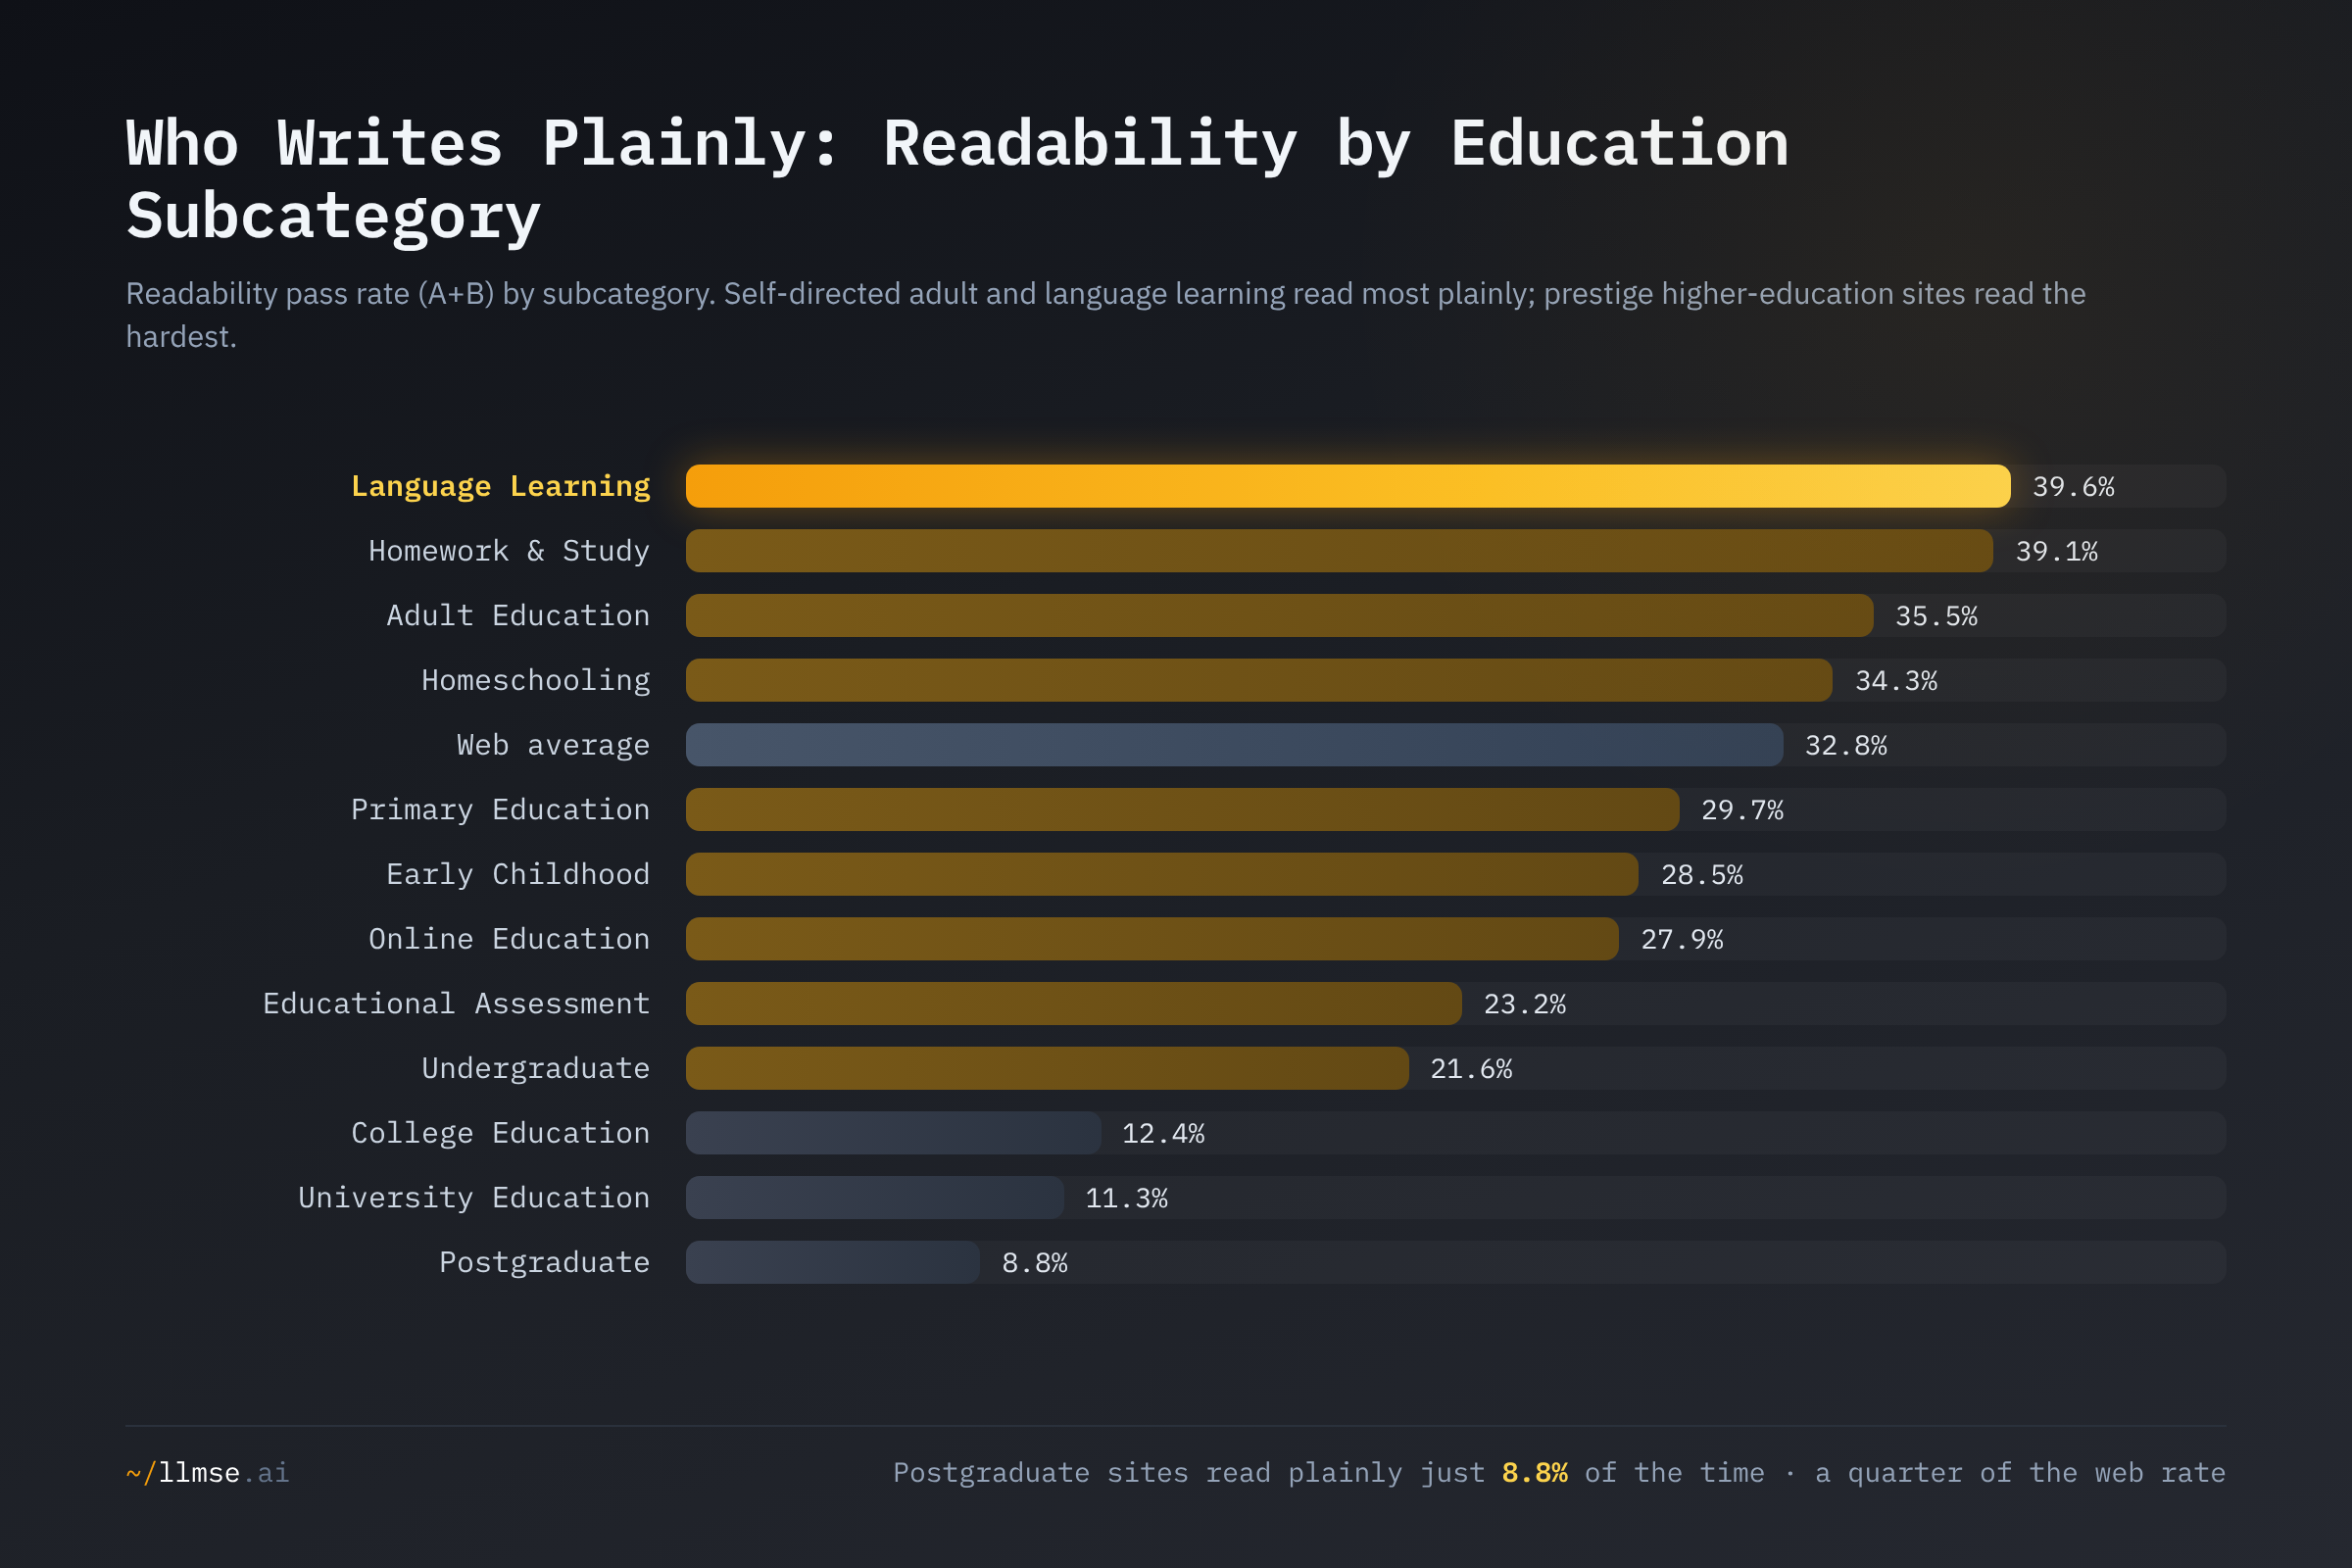
Postgraduate programs pass readability just 8.8% of the time, universities 11.3%, and colleges 12.4% — roughly a quarter to a third of the web average. Add Professional Schools (16.5%) and the pattern is unambiguous: campus-based higher education writes the hardest-to-read content in the sector. The institutions with the most communications staff and the largest marketing budgets produce the prose that fewest people can read.
At the other end sit the cohorts built for self-directed, non-traditional learners. Language Learning (39.6%), Homework & Study (39.1%), and Adult Education (35.5%) all read more plainly than the average website — because they have to. Their users are choosing to learn on their own, often in a second language, and content that reads at graduate level simply doesn't convert. K-12 sites land in the middle (Primary 29.7%, Early Childhood 28.5%), pulled toward clarity by the fact that their real audience is parents, not academics.
The contrast is the finding: where the reader is a captive admit navigating a bureaucracy, the prose is dense; where the reader can walk away, the prose gets clear.
EEAT, Corrected: Education Now Leads the Web on Trust
The original report card placed education near the bottom of the sector league on trust, below the web average. The full-population, standard-definition data reverses that.
| Grade | Education % | Web % |
|---|---|---|
| A | 7.9% | 5.5% |
| B | 21.2% | 16.0% |
| C | 30.4% | 23.9% |
| D | 32.5% | 47.3% |
| F | 8.1% | 7.3% |
EEAT pass rate (A+B+C): education 59.5%, web 45.4%.
Education carries a richer share of A, B, and C trust grades than the web and a much thinner band of D's (32.5% vs 47.3%). EEAT rewards exactly the signals education institutions naturally project: identifiable organizations, named authors and faculty, citations, and editorial transparency. Google's Search Quality Rater Guidelines treat this "experience, expertise, authoritativeness, and trust" signal as decisive for content that can affect people's decisions — and accredited schools, with their institutional identity and credentialed staff, clear that bar more often than the median website. The original's "education trails on trust" claim was an artifact of a small early sample and a non-standard pass cut; on the correct definition, trust is one of education's strengths, not a weakness.
But strong trust and weak readability coexist inside the same subcategories — and that is the deeper story.
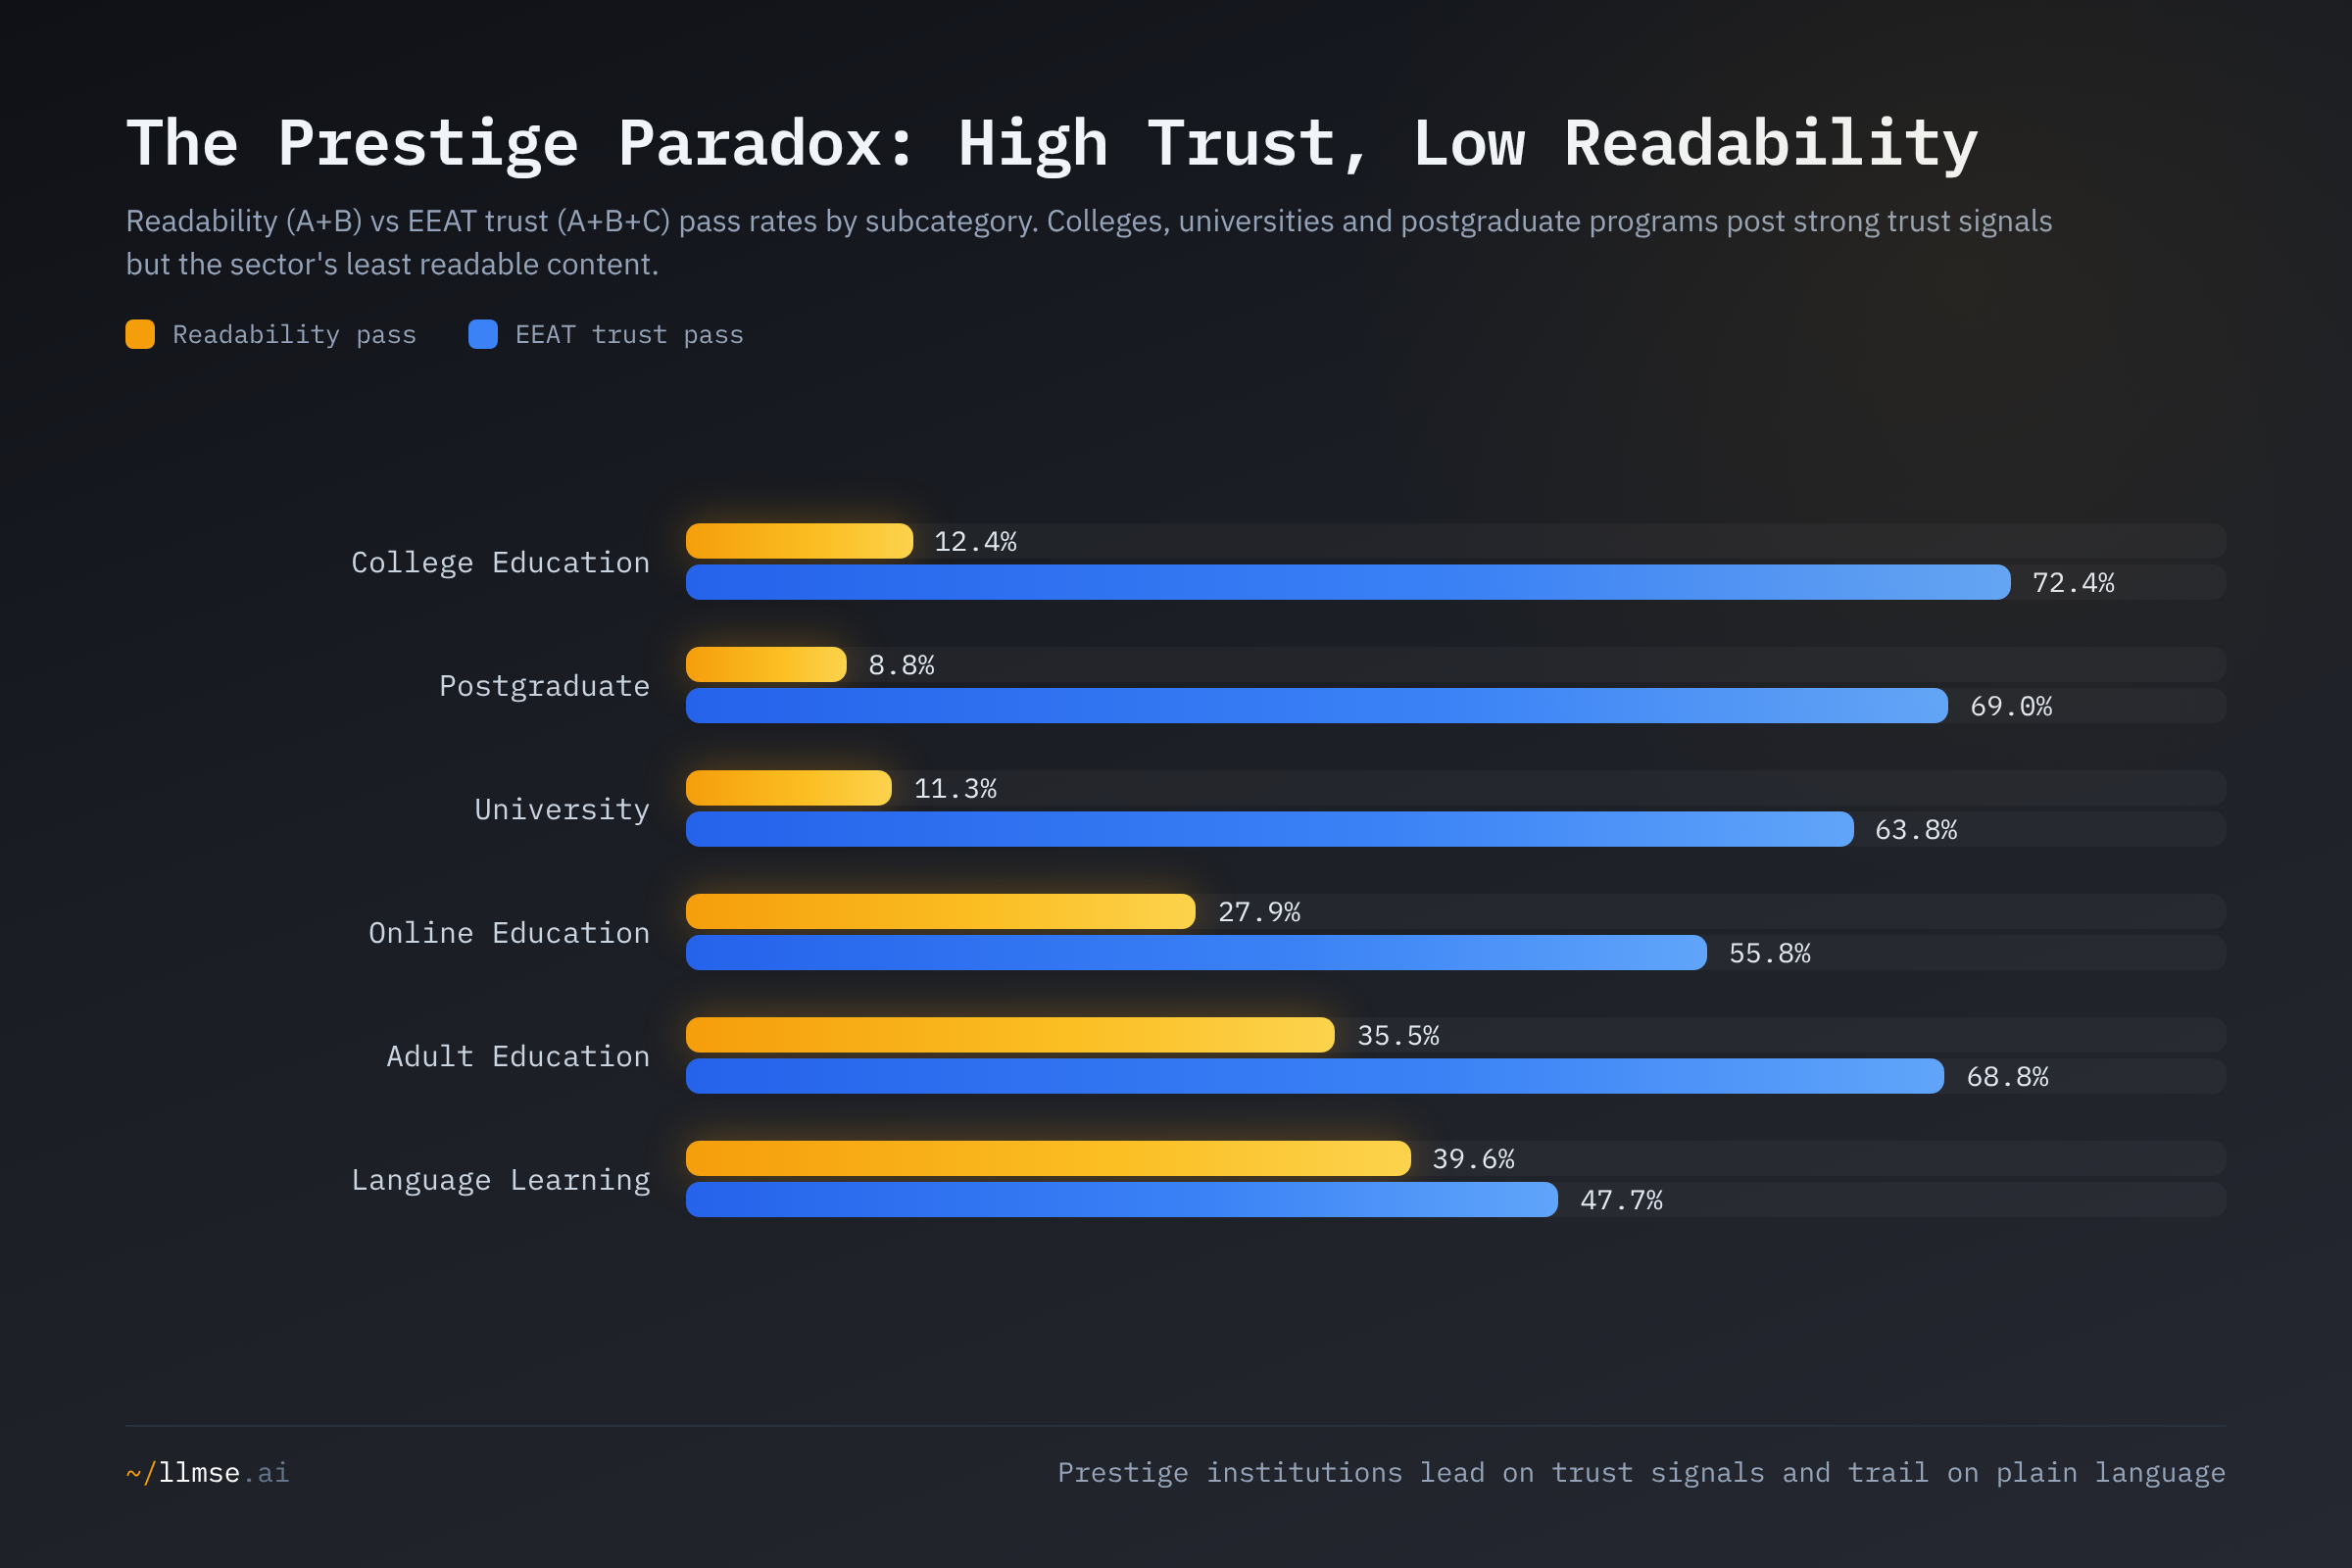
The prestige institutions that read worst are precisely the ones that score highest on trust. Colleges pass EEAT at 72.4% but readability at just 12.4%; postgraduate programs pair 69.0% trust with 8.8% readability; universities, 63.8% and 11.3%. These sites are authoritative, well-attributed, and institutionally credible — and almost no one can read them. The signals that satisfy a search-quality grader (named experts, citations, formal tone) pull in the opposite direction from the signals that satisfy a human reader (short sentences, plain words). Adult Education is the proof that the trade-off isn't inevitable: it posts strong trust (68.8%) and above-web readability (35.5%) at the same time. Academic prestige tends to buy trust at the cost of clarity; it doesn't have to.
Discovery, Accessibility, and Privacy: At or Above the Web
The remaining dimensions are quieter but consistent: education holds the line.
- SEO — 1.8%, essentially the web average (1.9%). Education optimizes about as well as everyone else, which is to say poorly in absolute terms — the web-wide baseline is itself near the floor. For the cross-sector picture, see the Cross-Industry Quality Report Card.
- AEO — 2.1%, above the web's 1.5%. Education content's structure — definitions, explainers, Q&A, course catalogs — maps reasonably well onto what AI answer engines extract and cite. The absolute rate is still low everywhere, but education starts ahead of the median.
- WCAG accessibility — 42.3%, level with the web's 43.8%. Education is not an accessibility standout, contrary to the original report's framing. That matters because the legal bar is rising. The U.S. Department of Justice's 2024 ADA Title II rule sets WCAG 2.1 Level AA as the standard for state and local government web content and "expressly lists public schools, community colleges, and public universities" as covered, with compliance deadlines phasing in through 2027 and 2028 by population size. LLMSE's static checks cover only a fraction of even Level A, so a site passing here can still be far from AA conformance — the gap between "average" and "compliant" is wider than the grade suggests.
- Privacy — 40.9%, above the web's 37.0%. Education sites handle student and applicant data and tend to carry the consent banners and policies the privacy grade looks for.
The throughline holds across all four: education is a competent, slightly-above-average operator on the technical and compliance dimensions — and an underperformer only on plain language.
What's at Stake
- Readability is an equity problem, not a style problem. With 54% of U.S. adults reading below a sixth-grade level, education content written at college-and-above complexity (the modal grade for higher-ed sites) systematically excludes the prospective students, parents, returning adults, and second-language learners who most need to understand admissions, aid, and program information. The gatekeeping happens before anyone applies.
- The prestige penalty inverts the funnel. The institutions with the most resources to write clearly — colleges, universities, postgraduate programs — write the least readably (8.8-12.4% pass). Their high trust scores mean these pages will be found and surfaced; their low readability means they will not be understood. Being authoritative and incomprehensible is the worst combination for a recruitment page.
- Online learning is now the majority experience, and clarity scales with it. Per NCES, 61% of U.S. undergraduates took at least one distance-education course as of the latest reported term. Online Education sites pass readability at only 27.9% — below the web average — so as instruction moves online, a comprehension barrier moves with it into the primary channel.
- Accessibility is a compliance clock, not a finished achievement. Education's WCAG rate merely matches the web, while the ADA Title II rule requires public schools and universities to reach WCAG 2.1 AA by 2027-2028. "Average" is not "compliant," and the heuristic grade overstates how close the sector is.
What Would Help
- University and college web teams: readability-test every public-facing page. Admissions, financial aid, course catalogs, and student-services pages should be scored for reading level and rewritten toward an A grade (≈8th-grade or below). The 8.8-12.4% pass rates for postgraduate, university, and college sites are the clearest, cheapest fix on this scorecard — and the one with the most direct effect on access. Audit your own pages at llmse.ai/classify.
- Content teams and instructional designers: separate the academic register from the public one. A research-faculty page can be dense; an admissions page cannot. Adult Education proves a site can be both highly trusted (68.8% EEAT) and plainly written (35.5% readability) at once. Treat plain language for prospective-student content as a requirement, not a downgrade of rigor.
- Public-sector education web teams (.edu, districts, community colleges): start the ADA Title II work now. Education's WCAG rate only matches the web, while the 2024 DOJ rule mandates WCAG 2.1 AA on a 2027-2028 timeline. Because automated checks catch a minority of failures, plan for manual testing and remediation, not a green automated score.
- EdTech and online-learning platforms: build readability in like you build accessibility in. Online Education (27.9%) trails the self-study cohorts that design for non-traditional learners. As distance education becomes the majority undergraduate experience, platform-level plain-language tooling and content templates would lift comprehension across thousands of courses at once.
- AI answer engines and researchers: weight authoritative education sources, and watch the comprehension gap. Education's above-web AEO and trust scores make it a strong candidate for citation in AI answers (AEO). When summarizing education content for a general audience, answer engines should simplify the prose that institutions don't — surfacing the authority while closing the readability gap the sites leave open. Every figure here is reproducible by cross-referencing LLMSE's grade, category, and subcategory indices.
This analysis was conducted using LLMSE, which has classified over 3.4 million websites across SEO, EEAT, AEO, WCAG accessibility, readability, GARM brand safety, and privacy dimensions. Education figures reflect 123,551 classified education sites in the index as of June 2026. To analyze your own site across every dimension in this report, visit llmse.ai/classify.