European Accessibility Act Readiness: One Year In, EU Websites Are No More Accessible Than the Rest of the Web
Update — 2026-06-29: Refreshed against LLMSE's current index of 3.4 million classified URLs (up from ~1.4M at first publication), with the EU-language sample roughly quadrupled (German alone grew from 66K to 289K graded sites) and the dimension set expanded to six — adding AEO (AI-answer optimization) and Privacy. WCAG pass is now reported on the standard A+B+C basis used across LLMSE (the original used A+B), so absolute rates look higher even though the underlying ranking barely moved. The core thesis holds and sharpens: one year into enforcement, EU sites pass WCAG at 42.7% versus a 43.8% global-web average — still no measurable accessibility premium — and the North-South divide persists (Finland 53.9%, Bulgaria 27.5%). One claim from the original was reversed by the larger sample: the EU no longer trails the web on EEAT (trust); it now leads it slightly (47.7% vs 45.4%). Hand-built CMS-by-market and per-sector accessibility tables that could not be reproduced read-only were dropped.
The European Accessibility Act (Directive (EU) 2019/882) became enforceable on 28 June 2025. Websites and apps that provide consumer services to the EU — e-commerce, banking, transport, telecommunications, e-books — must now meet the EN 301 549 accessibility standard, which incorporates the W3C's WCAG 2.1 Level AA success criteria for web content. The Directive leaves penalties to each member state — they must be "effective, proportionate and dissuasive" — so the exposure ranges from France's roughly €50,000 per infraction to Germany's up to €100,000 and Italy's €40,000 or 5% of turnover.
The backdrop is grim. The 2025 WebAIM Million — an automated scan of the top one million home pages — found detectable WCAG 2 failures on 94.8% of them, an average of 51 errors per page, with low-contrast text alone affecting 79.1% of pages. Accessibility is the single most widely failed quality dimension on the web, and the EAA is the most consequential attempt yet to force the issue. One year in, the obvious question is whether it is working.
We mapped accessibility across ~947,000 sites publishing in 21 official EU languages in LLMSE's index and cross-referenced them against six quality dimensions — WCAG accessibility, SEO, AEO (AI-answer optimization), EEAT (trust signals), readability, and privacy — using the same automated graders applied to the rest of the web. We then compared the EU aggregate against the all-web baseline and ranked member states against each other, using content language as a country proxy.
The headline: one year into enforcement, EU sites pass automated WCAG checks at 42.7% — marginally below the 43.8% global web average, not above it. There is no measurable EAA accessibility premium yet. And the EU average hides a stark North-South divide: Finnish-language sites pass at 53.9%, Bulgarian-language sites at 27.5% — a near-2x gap that tracks which countries regulated accessibility before Brussels did.
The Data
We identified roughly 947,000 URLs publishing primarily in one of 21 official EU languages. Language is detected from HTML lang attributes and content analysis; it is a proxy for market, not a precise national boundary (German spans Germany, Austria, and parts of Belgium and Luxembourg; Dutch spans the Netherlands and Belgium; Portuguese is shared with Brazil). Irish and Maltese are official EU languages but had too few graded sites (240 and 6) to report and are excluded. Russian is excluded entirely under sanctions, and is not an EU language.
| Language (market) | EU-language URLs | WCAG graded | Share of EU |
|---|---|---|---|
| German | 288,701 | 287,472 | 30.5% |
| French | 130,775 | 129,637 | 13.8% |
| Dutch | 116,986 | 116,426 | 12.4% |
| Spanish | 98,897 | 97,978 | 10.4% |
| Portuguese | 69,783 | 69,241 | 7.4% |
| Polish | 49,797 | 49,483 | 5.3% |
| Czech | 34,534 | 34,393 | 3.6% |
| Italian | 24,956 | 24,569 | 2.6% |
| Danish | 24,767 | 24,046 | 2.6% |
| Swedish | 22,928 | 22,844 | 2.4% |
| Hungarian | 21,614 | 21,533 | 2.3% |
| Romanian | 13,191 | 13,102 | 1.4% |
| Finnish | 10,278 | 10,235 | 1.1% |
| Slovak | 8,742 | 8,696 | 0.9% |
| Greek | 7,098 | 7,026 | 0.7% |
| Lithuanian | 6,025 | 5,985 | 0.6% |
| Croatian | 5,215 | 5,183 | 0.6% |
| Bulgarian | 4,322 | 4,292 | 0.5% |
| Estonian | 3,576 | 3,532 | 0.4% |
| Latvian | 2,405 | 2,395 | 0.3% |
| Slovenian | 2,358 | 2,348 | 0.2% |
German alone accounts for 30.5% of the EU-language web in our index, reflecting Germany's position as the bloc's largest digital economy. Nearly every indexed EU site has enough content for an automated WCAG evaluation, so the graded population closely tracks the raw counts. The sample has grown roughly four-fold since this post first ran (German went from 66K to 287K graded sites), which broadens coverage well beyond the flagship sites early crawls favoured.
Methodology
This post makes quantitative cross-country comparisons, so the definitions and limits matter.
- Grades and "pass." Each site is graded A-F by a dedicated automated analyzer (there is no E grade). "Pass" means A+B+C for WCAG, SEO, AEO, EEAT, and Privacy, and A+B for Readability (a Flesch Reading Ease score of roughly 50+, ≈ 8th-grade level or below). WCAG grades automated, static-HTML accessibility checks covering roughly 30-40% of WCAG 2.1 Level A — missing alt text, unlabeled form fields, broken heading order, missing page titles and language declarations, and similar machine-detectable defects. Full conformance, including the contrast and keyboard criteria EN 301 549 requires, needs manual testing this grade does not perform.
- Classification basis. Language is assigned from
langattributes and content analysis; each grade is an independent automated analyzer applied uniformly across the index, not a curated sample of famous sites. - Cross-references are computed as set intersections (Redis
ZINTERCARD) between a language index (e.g.lang-Finnish) and a grade index (e.g.wcag-A). All counts are aggregate; no individual site is identified. Country labels are language proxies, as noted above. - Why LLMSE's pass rates look higher than WebAIM's. WebAIM counts a page as failing if it has any detectable error, which is why 94.8% "fail." LLMSE assigns a graded bucket where a C still passes, so a 42.7% A-C pass rate and WebAIM's ~5% error-free rate describe the same web at different thresholds: most sites have some defect, but fewer than half are bad enough to land in D or F. Treat the LLMSE figure as a relative severity score, not a conformance certificate.
- Known limits. Readability uses Flesch scoring, which is calibrated for English and penalizes agglutinative languages (Finnish, Hungarian) and long-sentence languages regardless of actual clarity — so we report EU readability only at the aggregate level and avoid cross-language readability rankings. Counts are a live snapshot and drift as classification continues. Sample sizes below a few thousand graded sites (Estonia, Latvia, Slovenia) carry wider error bars and are flagged where relevant.
- Why these numbers differ from the 2026-03 original. Three changes. First, the graded index grew from ~1.4M to ~3.4M URLs and the EU sample roughly quadrupled; early grades skewed toward higher-quality, more-visible sites, so broadening coverage pulled most absolute rates down. Second, WCAG pass is now reported on the A+B+C basis used everywhere else in LLMSE (the original used A+B), which raises the headline numbers — Finland's 40.2% became 53.9% mostly because of this definitional change. Third, the much larger EEAT sample reversed the original's "EU trails the web on trust" finding (the EU now leads slightly), and small-sample, hand-curated CMS-by-market and per-sector accessibility tables that cannot be reproduced read-only were dropped rather than carried forward.
The Scorecard
Plotting the EU aggregate against the all-web average across all six dimensions shows where the bloc actually stands.
| Dimension | EU pass | Web average | Difference |
|---|---|---|---|
| SEO (technical) | 2.5% | 1.9% | +0.6pp |
| AEO (AI answers) | 0.6% | 1.5% | −0.9pp |
| EEAT (trust) | 47.7% | 45.4% | +2.3pp |
| WCAG (accessibility) | 42.7% | 43.8% | −1.1pp |
| Readability | 31.9% | 32.8% | −0.9pp |
| Privacy | 40.6% | 37.0% | +3.6pp |
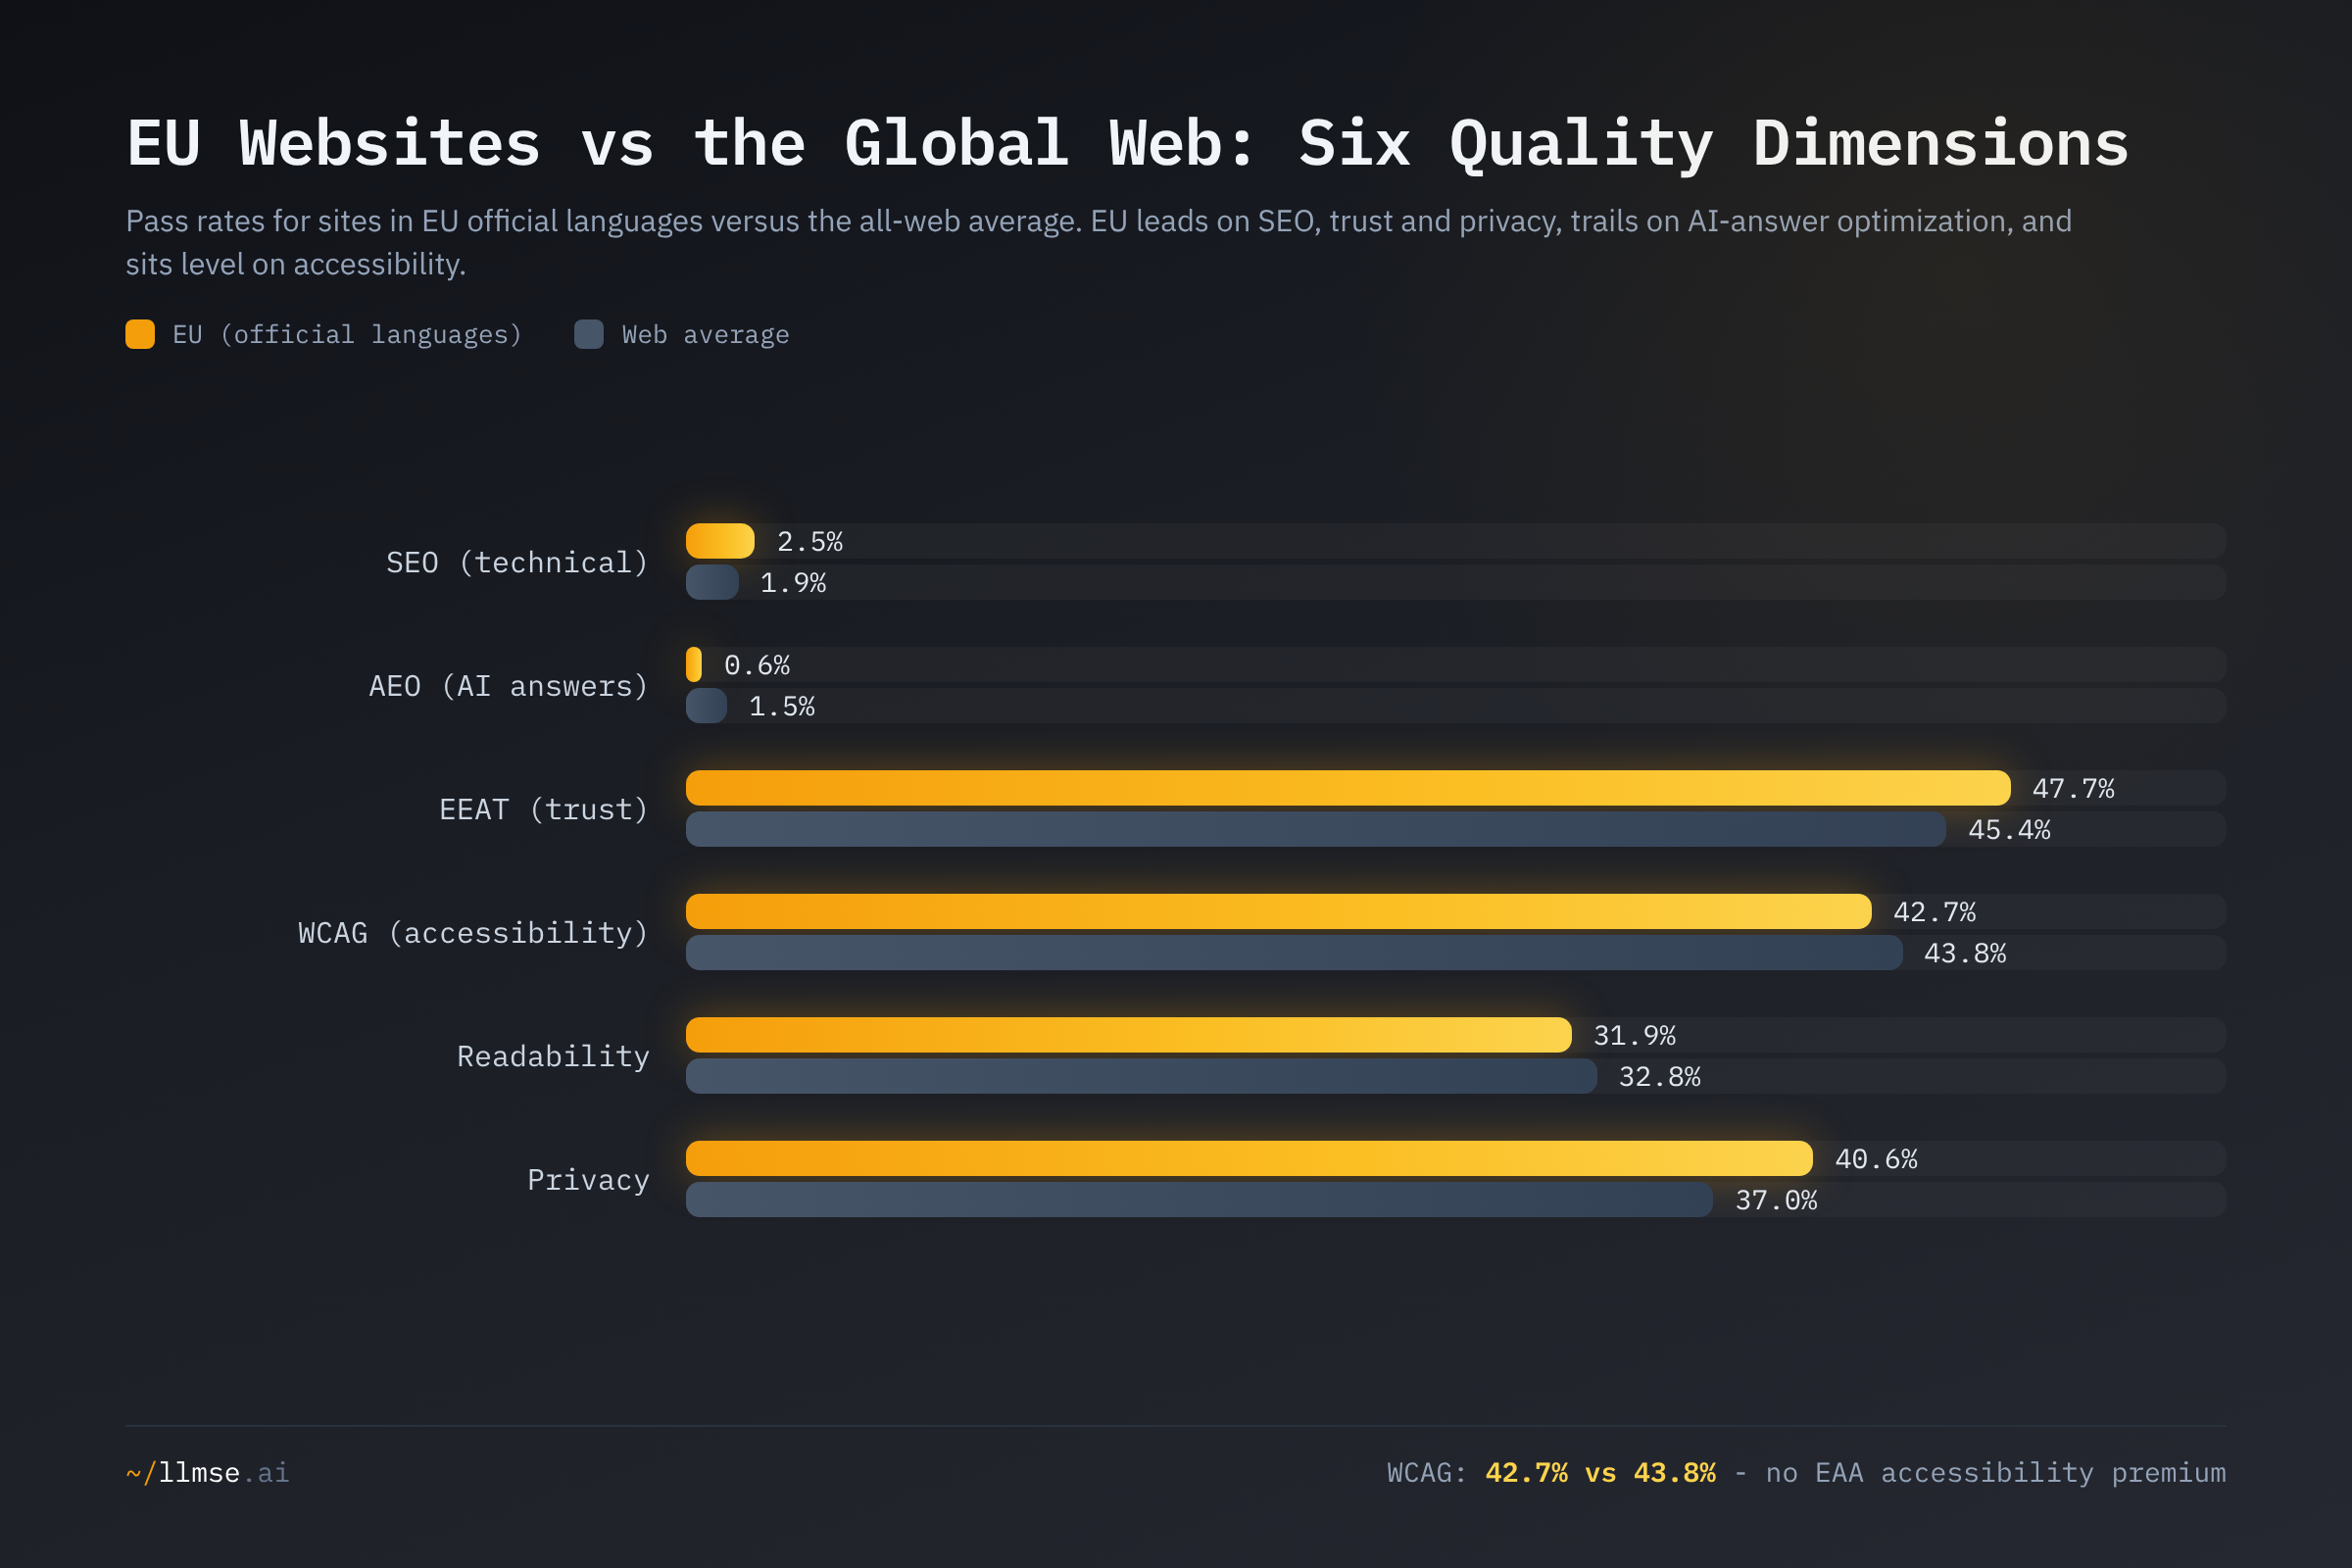
The EU is above the web on the signals that govern trust and commerce — SEO (+0.6pp), EEAT (+2.3pp), and privacy (+3.6pp) — and at or below it on everything else. The privacy lead is the largest, consistent with the GDPR's decade-long head start on consent banners and policy disclosures. But the two dimensions where the EU lags are the telling ones. On AEO it passes at just 0.6% against a 1.5% web average — the EU is markedly behind on optimizing content for AI answer engines, the discovery channel that matters most for the next decade (see The Cross-Industry Quality Report Card for how low AEO runs everywhere). And on accessibility — the one dimension the EAA was written to move — the EU is fractionally below the global web. A year of binding law has not produced an accessibility advantage.
Accessibility: The North-South Divide
The flat EU average fractures into dramatically different national realities. Ranking each member state by WCAG pass rate (content language as country proxy) produces a clean geographic gradient.
| Country (language) | WCAG graded | Pass (A-C) | F rate |
|---|---|---|---|
| Finland (Finnish) | 10,235 | 53.9% | 25.8% |
| Germany (German) | 287,472 | 48.7% | 33.3% |
| Sweden (Swedish) | 22,844 | 46.5% | 36.2% |
| Netherlands (Dutch) | 116,426 | 44.6% | 36.9% |
| Denmark (Danish) | 24,046 | 43.8% | 33.2% |
| France (French) | 129,637 | 43.0% | 38.1% |
| Czechia (Czech) | 34,393 | 42.2% | 42.5% |
| Poland (Polish) | 49,483 | 41.8% | 38.3% |
| Estonia (Estonian) | 3,532 | 38.7% | 30.1% |
| Slovenia (Slovenian) | 2,348 | 37.5% | 46.1% |
| Portugal (Portuguese) | 69,241 | 37.1% | 47.5% |
| Hungary (Hungarian) | 21,533 | 36.7% | 46.0% |
| Slovakia (Slovak) | 8,696 | 36.4% | 48.2% |
| Spain (Spanish) | 97,978 | 35.1% | 48.0% |
| Greece (Greek) | 7,026 | 35.0% | 49.3% |
| Italy (Italian) | 24,569 | 32.4% | 51.0% |
| Croatia (Croatian) | 5,183 | 28.0% | 57.1% |
| Romania (Romanian) | 13,102 | 28.0% | 55.0% |
| Bulgaria (Bulgarian) | 4,292 | 27.5% | 57.4% |
| Latvia (Latvian) | 2,395 | 27.3% | 58.3% |
| Lithuania (Lithuanian) | 5,985 | 18.6% | 14.6% |
| Web average | 3,345,107 | 43.8% | 38.0% |
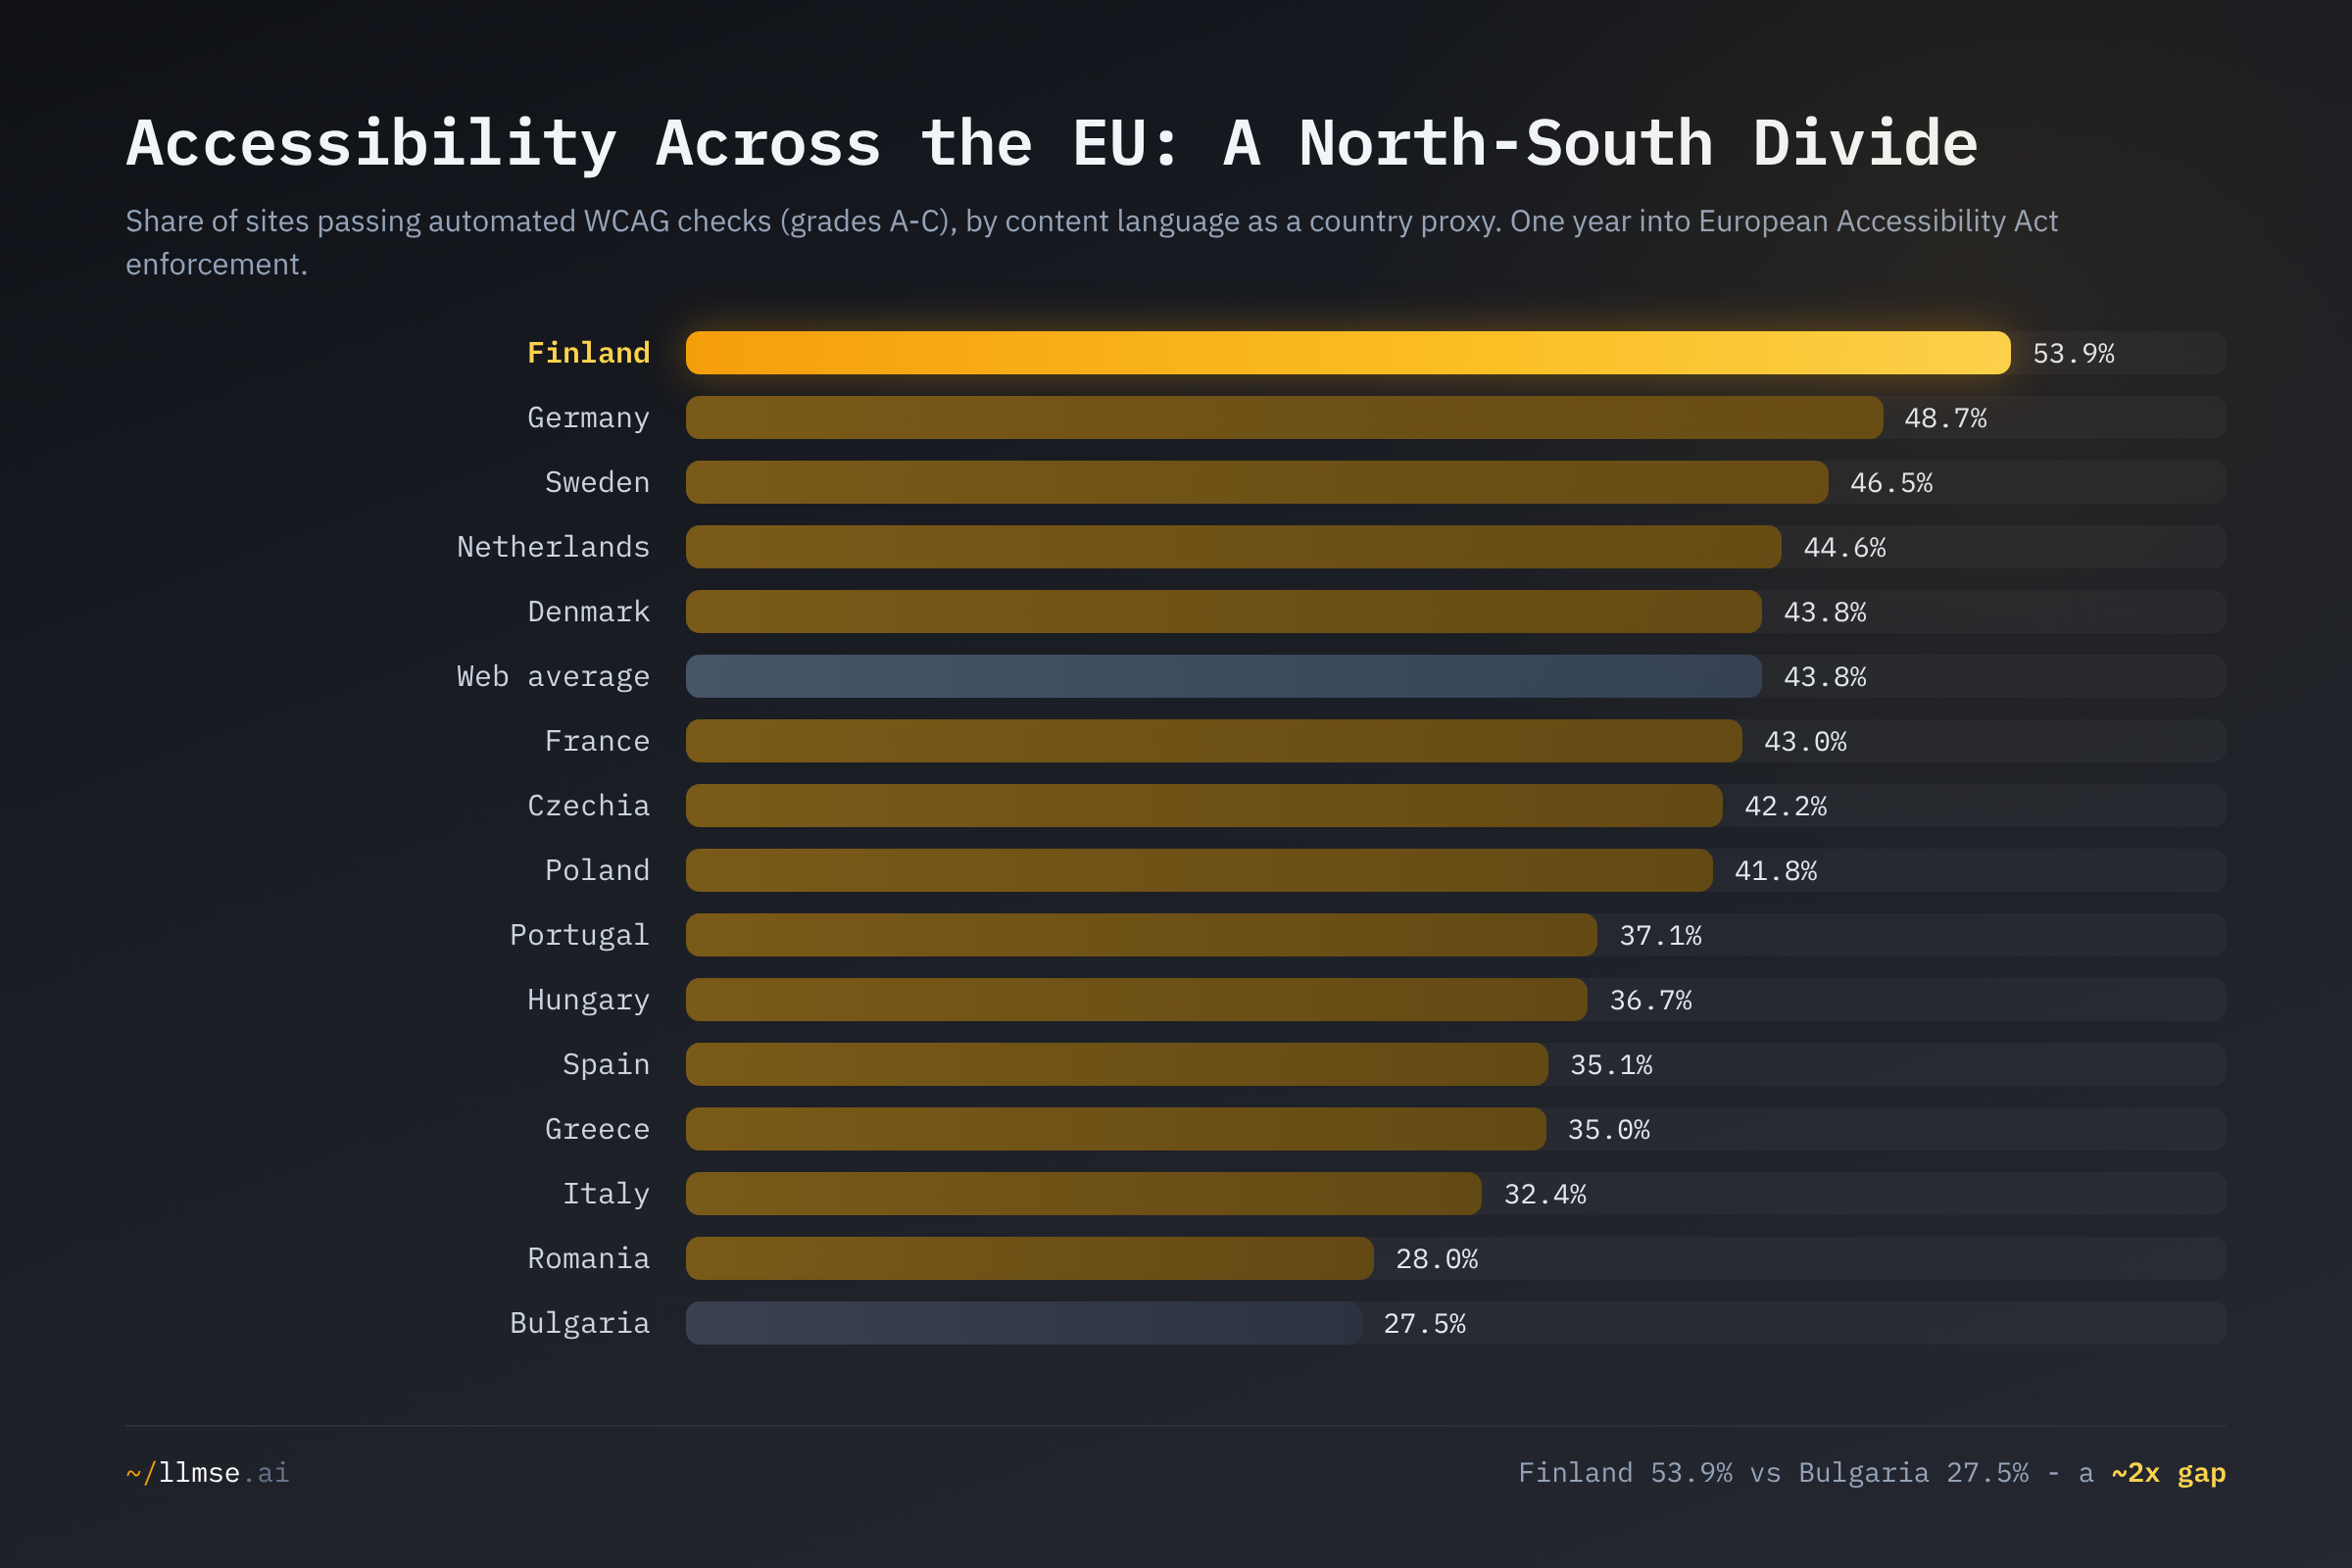
Finland leads the EU at 53.9%, the only member state a full ten points above the global web average. Finland's lead is not accidental: it mandated public-sector web accessibility through the Act on the Provision of Digital Services (306/2019), in force from April 2019 and explicitly built on EN 301 549 and WCAG 2.1 AA — more than six years before the EAA's enforcement date. Early regulation seeded an early compliance culture. Germany (48.7%), Sweden (46.5%), the Netherlands (44.6%), and Denmark (43.8%) round out a Northern-and-Western tier that all clears the web average.
Bulgaria trails the bloc at 27.5%, with a 57.4% F rate — more than half of Bulgarian sites fail accessibility outright. Latvia (27.3%), Romania (28.0%), and Croatia (28.0%) sit alongside it, a Southeastern-and-Baltic cluster passing at barely half Finland's rate. Lithuania's 18.6% is an outlier and should be read with caution: its failure rate is the lowest of any EU language (14.6%), because two-thirds of graded Lithuanian sites pile into grade D rather than F — a distribution artifact that depresses the A-C pass rate without the outright-failure profile of the genuine laggards. Setting it aside, the trailing edge is unambiguously Southeastern Europe and the Baltics.
The gradient maps closely to which countries regulated accessibility before the EAA. Finland, Germany, France, and the Nordics had national accessibility laws and enforcement bodies predating 2025; for Bulgaria, Romania, Croatia, and the Baltics, the EAA is largely the first binding web-accessibility requirement. This is a correlation, not a proven cause — broadband penetration, digital-economy maturity, and the supply of accessibility specialists all move together — but the pattern is consistent across every tier.
No Accessibility Premium: The EU Looks Like the Rest of the Web
If the EAA had begun reshaping the market, the EU's accessibility-grade distribution should be pulling ahead of the global web's. It is not.
| WCAG grade | EU share | Web share |
|---|---|---|
| A (best) | 13.3% | 14.4% |
| B | 11.4% | 10.2% |
| C | 18.1% | 19.3% |
| D | 18.2% | 18.2% |
| F (fail) | 39.1% | 38.0% |
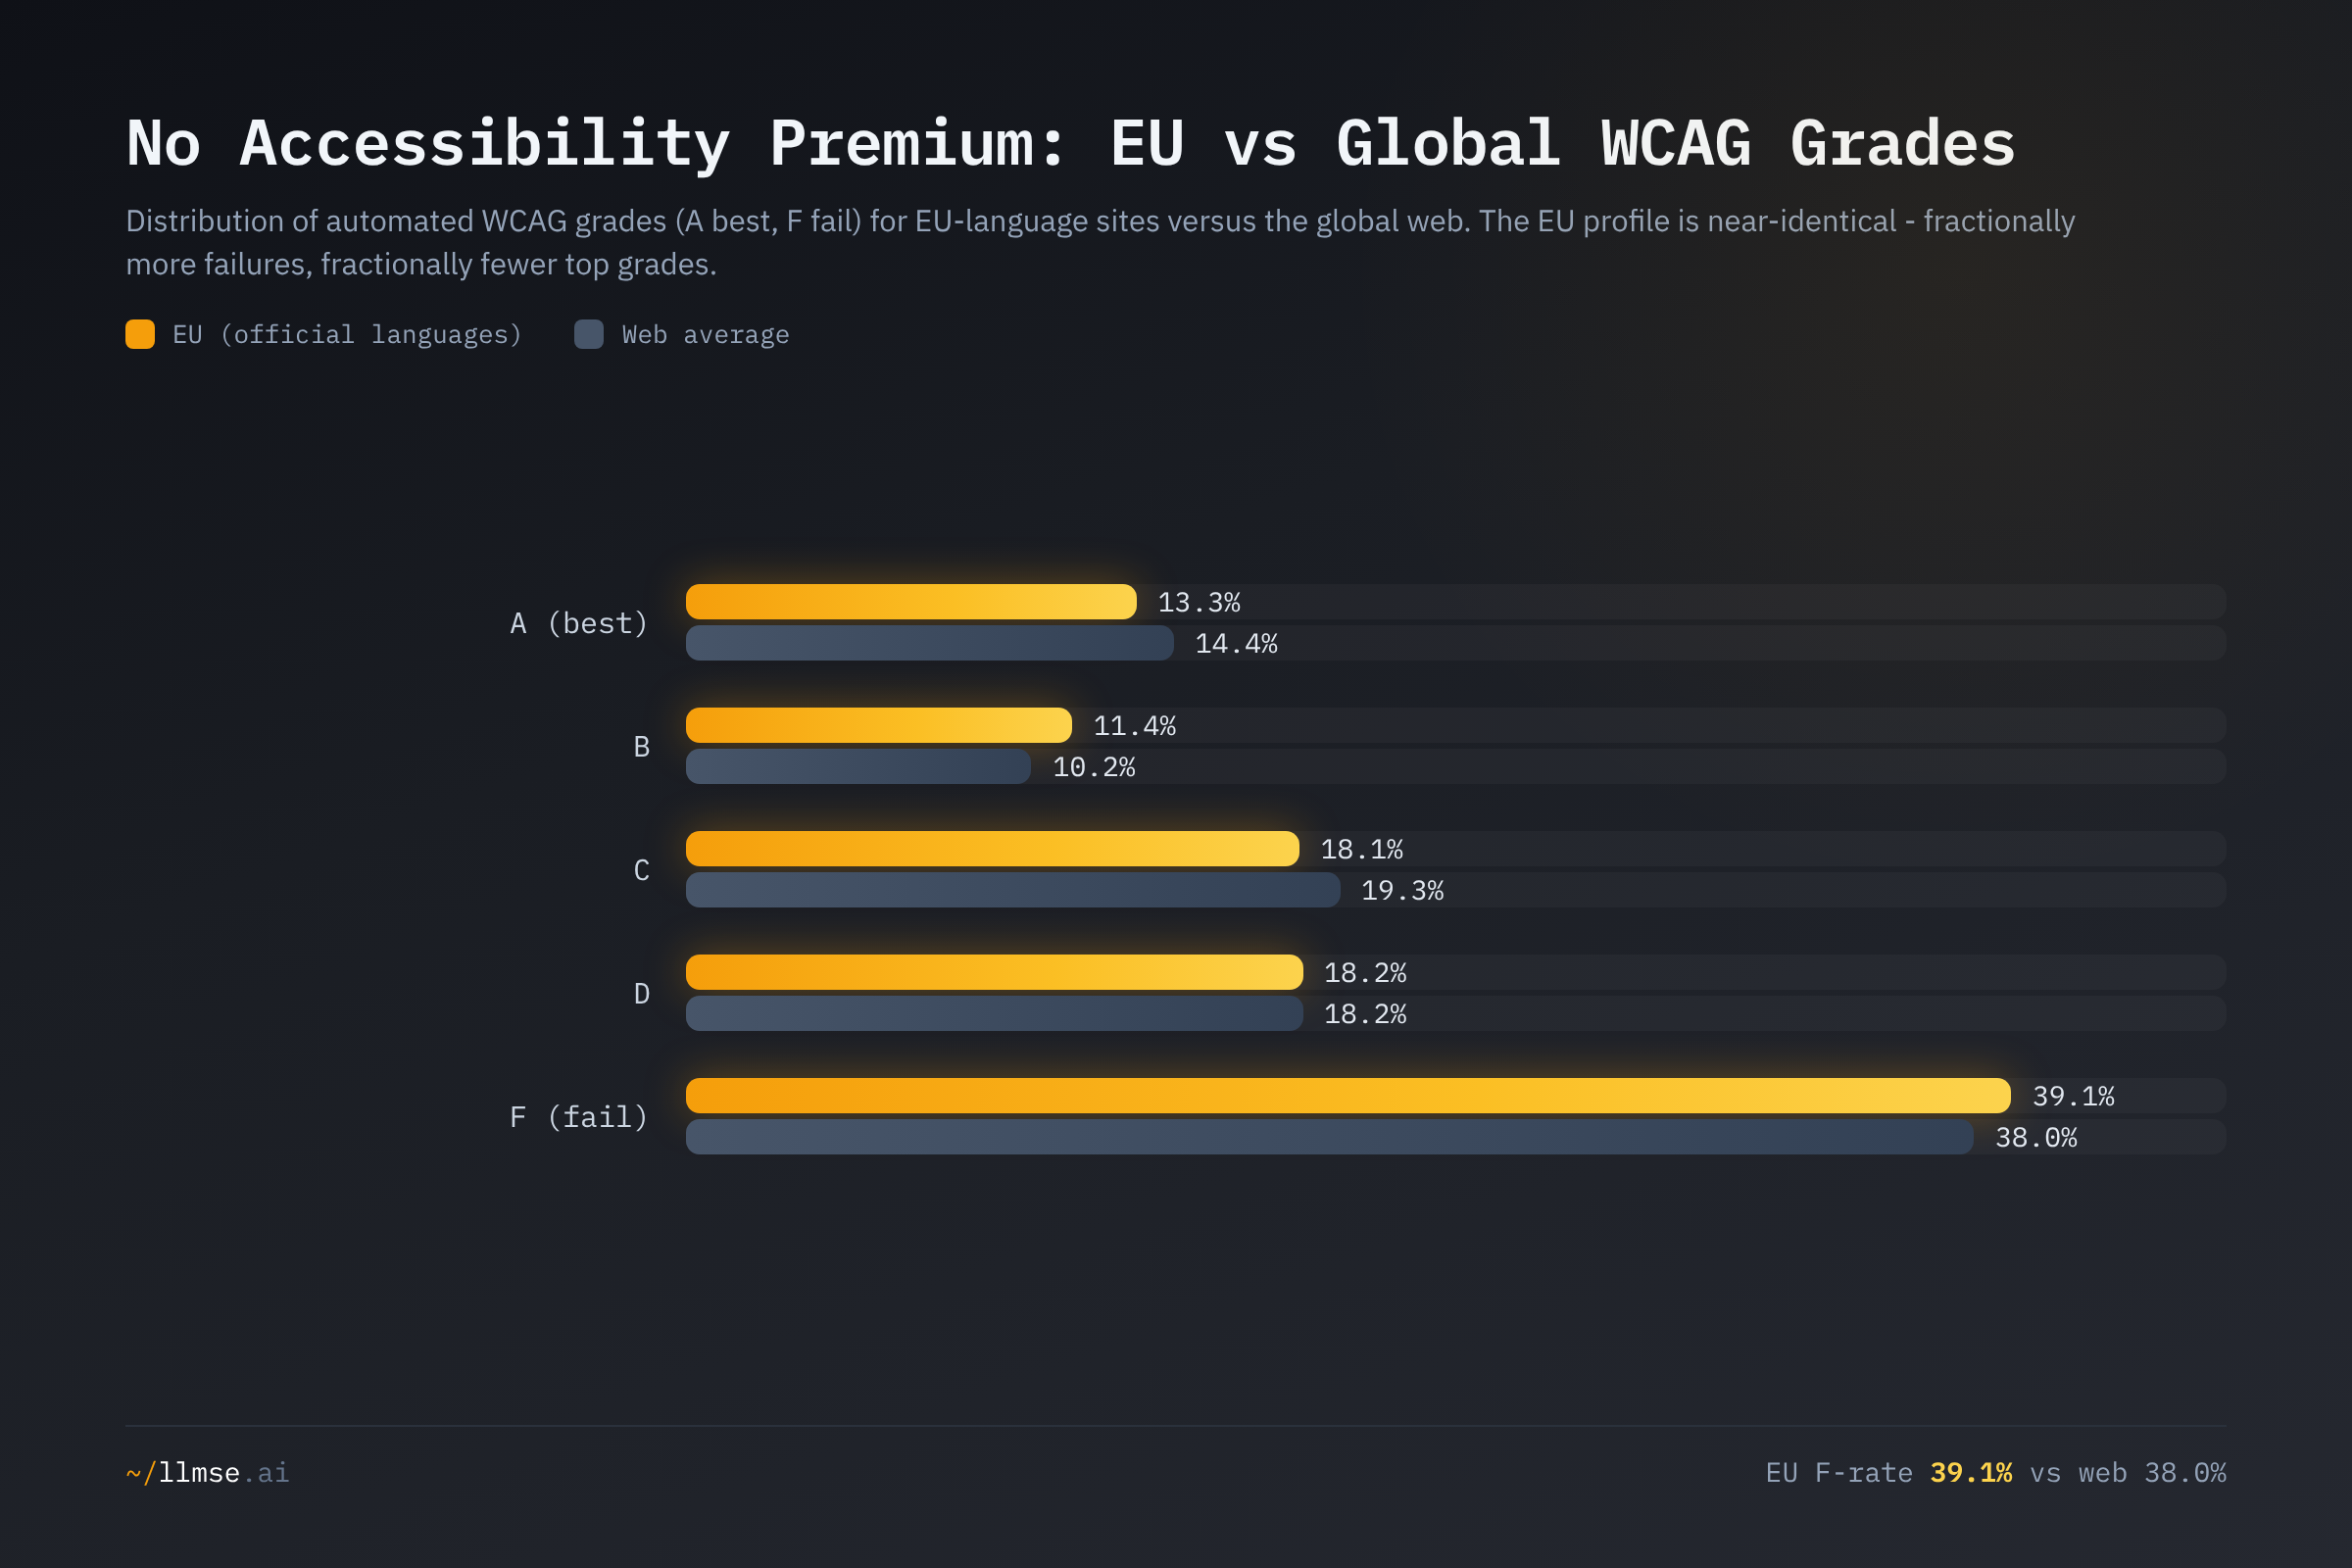
The EU and global distributions are statistically indistinguishable — and where they differ, the EU is marginally worse, with fractionally fewer top grades (13.3% A vs 14.4%) and slightly more outright failures (39.1% F vs 38.0%). A year into the most ambitious accessibility law in the world, EU-facing websites in aggregate look exactly like the websites that are not subject to it.
This is consistent with the WebAIM Million's longitudinal finding: across the top million home pages, the share with detectable WCAG failures fell only 1.1 points (from 95.9% to 94.8%) over the year the EAA took effect, and just 3.1 points over six years. Accessibility moves slowly even under legal pressure, because the defects are baked into templates, component libraries, and CMS themes that turn over on multi-year cycles. The EAA set a deadline; it did not, in its first year, move the aggregate. The realistic read is that change, if it comes, will show up first in the regulated consumer sectors (e-commerce, banking, transport) and in countries with active enforcement — not in a bloc-wide average dominated by the long tail of small sites no regulator has yet contacted.
Discovery and Trust: Where the EU Actually Leads
Accessibility is the EU's weak dimension, but the same sites are unusually strong on the signals that drive search and trust. EU sites pass technical SEO at 2.5% against a 1.9% web average — and the leaderboard is revealing.
| Country (language) | SEO pass | EEAT pass |
|---|---|---|
| Finland (Finnish) | 4.2% | 41.1% |
| Sweden (Swedish) | 3.9% | 35.3% |
| France (French) | 3.5% | 50.7% |
| Germany (German) | 2.9% | 41.1% |
| Netherlands (Dutch) | 2.5% | 59.1% |
| Poland (Polish) | 2.4% | 42.1% |
| Spain (Spanish) | 2.0% | 54.0% |
| Romania (Romanian) | 1.8% | 61.6% |
| Bulgaria (Bulgarian) | 1.3% | 57.0% |
| Web average | 1.9% | 45.4% |
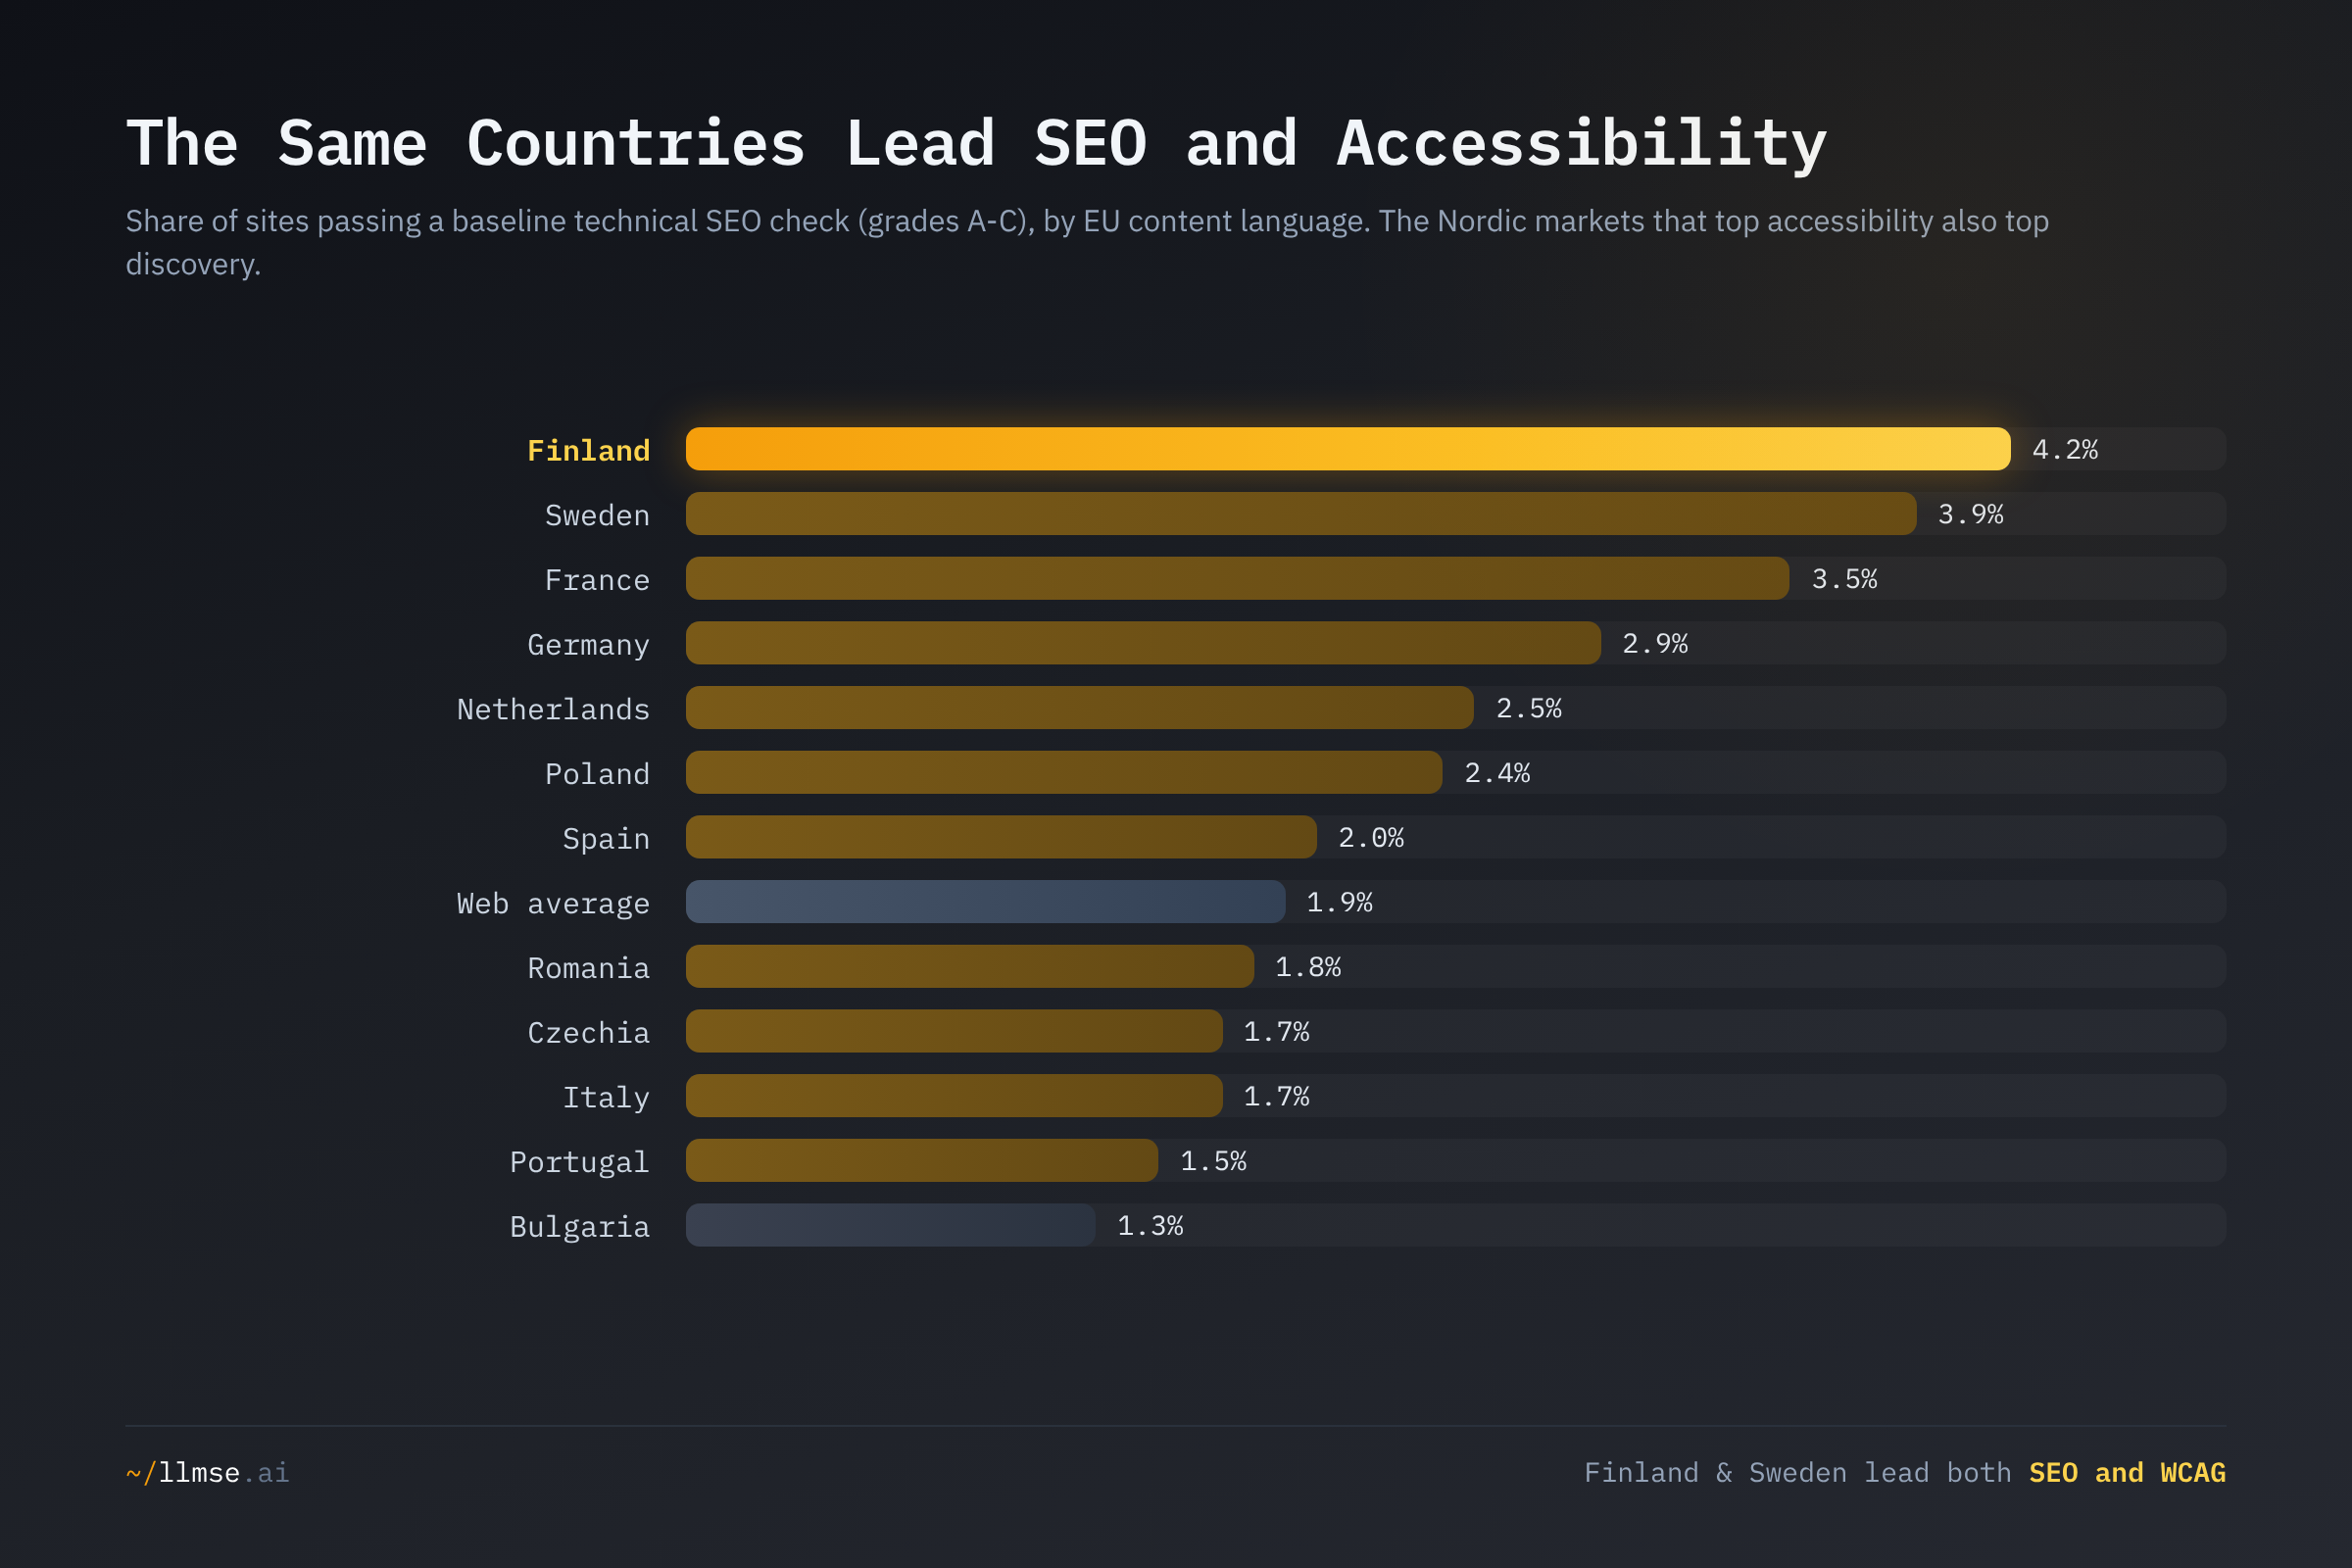
Finland (4.2%) and Sweden (3.9%) lead technical SEO — the same two countries that top the accessibility ranking. This is not coincidence: technical SEO and automated WCAG share structural requirements (semantic HTML, valid heading hierarchy, descriptive titles, alt text), so the engineering discipline that produces one tends to produce the other. Bulgaria (1.3%) trails on SEO just as it does on accessibility.
Trust runs the other way, and that is the most striking reversal from the original analysis. The first version of this post reported the EU 33% below the web on EEAT; the far larger sample shows the opposite — EU EEAT now sits at 47.7% versus a 45.4% web average. More interesting is that EEAT and accessibility are inversely distributed across the bloc. The Northern markets that lead accessibility (Finland 41.1% EEAT, Sweden 35.3%, Denmark 34.4%) trail on trust signals, while the Southeastern markets that trail accessibility lead on trust — Romania posts the EU's highest EEAT (61.6%) on a 28.0% WCAG rate, and Bulgaria reaches 57.0% EEAT against 27.5% WCAG. The plausible reading is that these are independent investments: structured author and organization data, contact and policy disclosures (which EEAT rewards) are a different engineering effort from accessible markup, and different markets have prioritized different halves. It is a descriptive pattern, not a causal claim, but it holds consistently enough to undercut the idea of a single "web quality" axis.
The Enforcement Gap
The data exposes the central tension in EAA enforcement: the countries with the weakest accessibility are the ones with the least pre-existing enforcement infrastructure. Grouping member states into tiers by WCAG pass rate makes the gap concrete.
| Tier | Countries | Weighted WCAG pass | Pre-EAA posture |
|---|---|---|---|
| Tier 1 | Finland, Germany, Sweden, Netherlands, Denmark, France | 46.4% | National accessibility law and enforcement bodies predate the EAA |
| Tier 2 | Czechia, Poland, Estonia, Slovenia, Portugal, Hungary, Slovakia, Spain, Greece | 37.7% | Transposing the EAA onto limited prior frameworks |
| Tier 3 | Italy, Croatia, Romania, Bulgaria, Latvia, Lithuania | 28.9% | EAA is largely the first binding web-accessibility requirement |
Tier 1 sites pass at 46.4%, Tier 3 at 28.9% — a 1.6x spread. Tier 1 countries had laws, supervising authorities, and a market of accessibility consultants in place; for them the EAA largely codifies an existing baseline. Tier 3 countries are meeting binding web-accessibility requirements for the first time, with thinner enforcement capacity and a smaller specialist supply to draw on. Because penalties are set nationally rather than harmonized, the countries furthest from compliance are also, in several cases, the ones with the lightest fines and the least active market surveillance. The risk is a two-speed accessibility Europe: the already-accessible North consolidates its lead, while the lagging South and East stay non-compliant because the enforcement that would force change is weakest exactly where it is needed most.
What's at Stake
- The EAA's first-year accessibility dividend is, in aggregate, zero. At 42.7% EU versus 43.8% web, sites facing the toughest accessibility law in the world are no more accessible than those that are not. The deadline has passed; the market has not yet responded, and supervising authorities now have to convert a paper requirement into measurable change.
- A near-2x national divide means uneven legal exposure. A consumer-facing site in Bulgaria (27.5% pass, 57.4% F) is far likelier to be non-compliant than one in Finland (53.9%) — yet the EAA applies identically across the single market. Cross-border sellers inherit the obligation regardless of where they are based, so the laggard markets carry concentrated compliance risk.
- The EU is optimizing for yesterday's discovery channel and neglecting tomorrow's. EU sites beat the web on technical SEO (2.5% vs 1.9%) but trail badly on AEO (0.6% vs 1.5%). As AI answer engines displace blue links, EU content risks losing visibility it cannot easily buy back — the same structural gap explored in the cross-industry report card.
- Accessibility is a fixable, template-level problem. The WebAIM Million shows six error types — low contrast, missing alt text, missing form labels, empty links and buttons, missing language declarations — account for 96% of detected failures. These are exactly the defects LLMSE's automated grade catches, and exactly the ones that propagate through CMS themes. Fixing them at the platform level would move millions of sites at once.
What Would Help
- EU market-surveillance authorities: target enforcement where compliance is lowest, and measure it. Bulgarian (27.5%), Latvian (27.3%), Romanian (28.0%), and Croatian (28.0%) sites need proactive, automated WCAG monitoring at scale — not case-by-case complaint handling. Structural and digital-transformation funds should attach accessibility-compliance conditions to disbursement in Tier 3 markets.
- CMS and platform vendors: ship accessible defaults. Because the dominant failures are template-level (contrast, alt text, form labels, language declarations), the highest-leverage fix is upstream. A theme that passes EN 301 549's web criteria out of the box would lift every site built on it — the cheapest path to bloc-wide compliance.
- Site owners in regulated sectors: audit against the dimension you are weakest on, with manual testing. LLMSE's automated grade covers only 30-40% of Level A; EAA conformance requires the keyboard, contrast, and screen-reader criteria only manual testing reveals. Run an automated baseline at llmse.ai/classify, then commission a manual audit before relying on a passing grade.
- EU content and SEO teams: close the AEO gap before search shifts under you. EU sites' 0.6% AEO pass rate is well below the 1.9% global SEO discipline they already demonstrate. Adding extractable answers, structured data, and citations — see /market/aeo — converts existing technical competence into AI-answer visibility.
- Tier 1 governments and standards bodies: export what worked. Finland's 53.9% pass rate is the residue of regulating in 2019, not 2025. The EU should fund structured knowledge transfer — training programs, shared tooling, model procurement clauses — from the Nordic and Western markets that lead to the Southeastern and Baltic markets that lag.
This analysis was conducted using LLMSE, which has classified over 3.4 million websites across SEO, EEAT, AEO, WCAG accessibility, readability, GARM brand safety, and privacy dimensions. EU figures reflect ~947,000 sites publishing in 21 official EU languages, with pass rates computed over the population graded on each dimension as of June 2026. Russian-language sites are excluded under sanctions. To analyze your own site across every dimension in this post, visit llmse.ai/classify.