The ADA Title II Deadline Slipped to 2027: Two-Thirds of Government, Education, and Health Sites Still Fail WCAG
Update — 2026-06-29: Refreshed against LLMSE's current index of 3.4 million classified URLs (up from ~1.6M at first publication) and expanded from five graded dimensions to six (adding AEO and Privacy). Two things reshaped the story. First, the framing: the April 24, 2026 compliance deadline this post originally counted down to was extended to April 26, 2027 by a DOJ interim final rule four days before it took effect — and HHS extended its parallel Section 504 health deadline a week later. So this is now a retrospective on how unready the public-serving web actually was. Second, a correction: the original reported Health leading on trust (EEAT 37.8%); on the larger, broader index Health posts the lowest EEAT of the three sectors (22.5% A+B), and Law & Government leads (30.4%). Education is also no longer the distinct accessibility laggard — all three sectors now fail at nearly the same ~39% F-rate. Most pass rates fell a few points as coverage broadened. Four charts were added; the per-CMS and per-subcategory tables were replaced with reproducible sector-level aggregates. The core thesis — two-thirds-plus of the public-serving web fails basic accessibility — holds, and the two deadline extensions are the clearest external confirmation of it.
The largest digital-accessibility mandate in U.S. history was supposed to take effect on April 24, 2026. It didn't.
Four days before it landed, the Department of Justice extended the deadline a full year, to April 26, 2027. Its ADA Title II web rule — which requires state and local governments serving 50,000 or more people to make their websites conform to WCAG 2.1 Level AA — survived intact; only the clock reset. The Department's stated reason was blunt: remediation tools, including generative AI, "do not yet reliably automate" the work at scale, school districts and universities reported they could not meet the date, and "no one is bound to do what is impossible." Two weeks later, the Department of Health and Human Services did the same with its parallel Section 504 rule for federally funded health care, pushing its May 2026 deadline to May 11, 2027.
Two regulators, two last-minute one-year reprieves, the same admission underneath: the public-serving web was nowhere near ready. The interesting question is no longer "how many days are left." It is how unready, exactly, and where.
We re-analyzed 220,554 websites across Law & Government, Education, and Health — the three sectors most directly covered by these rules — using LLMSE's automated WCAG analysis, then cross-referenced trust (EEAT), discovery (SEO/AEO), readability, and privacy grades from the same pipeline applied uniformly across an index of 3.4 million classified URLs. Coverage is now near-complete: 217,388 of those sites (98.6%) carry a WCAG grade, up from a thin 19% sample at first publication.
The headline is the same one that forced both extensions: two-thirds-plus of the public-serving web fails even a floor accessibility check. Just 28.1% of graded government, education, and health sites earn a clean WCAG pass (grade A or B); nearly 40% score an outright F. And the sectors are statistically indistinguishable — the old finding that Education was uniquely worst was an artifact of small early samples.
The Data
The three sectors below are LLMSE's Law & Government, Education, and Health categories — the consumer-facing public web that Title II and Section 504 reach. Every grade comes from LLMSE's automated analysis pipeline, not a hand-picked sample of flagship agencies.
| Sector | Indexed sites | WCAG graded | Coverage |
|---|---|---|---|
| Law & Government | 19,566 | 19,246 | 98.4% |
| Education | 123,551 | 121,673 | 98.5% |
| Health | 77,437 | 76,469 | 98.8% |
| Combined | 220,554 | 217,388 | 98.6% |
The graded population has grown roughly nine-fold since first publication (from 23,887 to 217,388 WCAG-graded sites), and coverage rose from under a fifth of the indexed sectors to essentially all of it. That matters: the original numbers rested on a few hundred to a few thousand graded sites per subcategory, where a handful of well-built flagship sites could swing a rate by ten points. The figures here rest on the near-complete population, and they are lower and flatter as a result.
Methodology
This post makes quantitative comparisons, so the definitions and limits matter.
- Grades and "pass." Each site is graded A-F by a dedicated automated analyzer (there is no E grade). For accessibility and trust this post uses the strict bar — grade A or B — as its headline "pass," matching the original analysis: it best separates sites that clearly clear a check from the rest. (Under the broader A+B+C convention some LLMSE posts use, WCAG pass rates are higher — the web average is 43.8% — but the sector ordering is unchanged.) SEO, AEO, and Privacy "pass" means A+B+C; Readability "pass" means A+B (a Flesch Reading Ease score of roughly 50+, ≈ 8th-grade level or below).
- What WCAG covers here. LLMSE's WCAG grade is built from static-HTML automated checks (missing alt text, form labels, heading hierarchy, page title and language attributes, empty links/buttons, ARIA usage, duplicate IDs, skip navigation, table headers, landmarks, zoom blocking, and similar) that approximate 30-40% of WCAG 2.1 Level A. Full WCAG 2.1 Level AA — the standard both rules require — adds color contrast, text resizing, consistent navigation, and error prevention, much of which needs manual testing. A site that fails these automated checks will fail a Level AA audit, so these grades are a floor, not a ceiling.
- Classification basis. Sector membership is by LLM classification; each grade is an independent automated analyzer.
- Cross-references are computed as set intersections (Redis
ZINTERCARD) between a sector index and each grade index. All counts are aggregate; no individual site is identified. - Known limits. Pass rates are over the population actually graded on each dimension; the per-dimension denominators differ slightly (e.g. 19,246 sites carry a WCAG grade in Law & Government, 19,285 an EEAT grade). The Readability grade uses Flesch scoring, calibrated for English, so it understates readability for sectors with non-English content — treat it as indicative. Counts are a live snapshot and drift as classification continues. Russian-language sites are excluded from all breakdowns.
- Why these numbers differ from the original. The graded population grew from ~1.6M to ~3.4M URLs, and these three sectors went from ~19% WCAG coverage to ~99%. Early grades skewed toward higher-quality, more-visible sites, so most pass rates fell a few points as coverage broadened (combined public-sector WCAG A+B 33.6%→28.1%; web-wide WCAG A+B 28.7%→24.6%). The rankings built on the thinnest early samples moved the most — which is exactly why the "Education is worst" and "Health leads trust" claims did not survive. The original's curated CMS, server, and subcategory cross-tables are not reproducible read-only at the sector level and have been dropped in favor of the aggregate analysis below; platform-level accessibility is covered separately in WCAG Accessibility by Industry and Platform and The CMS Quality Gap.
The Scorecard
Pass rates by sector, against the all-category web average. The standout (best) cell in each column is bolded.
| Sector | Sites | WCAG A+B | WCAG F | EEAT A+B | SEO | Readability | Privacy |
|---|---|---|---|---|---|---|---|
| Law & Government | 19,566 | 29.4% | 39.2% | 30.4% | 3.0% | 17.3% | 48.0% |
| Education | 123,551 | 29.0% | 39.4% | 29.1% | 1.8% | 23.3% | 40.9% |
| Health | 77,437 | 26.5% | 38.9% | 22.5% | 2.8% | 25.5% | 52.7% |
| Web average | 3.4M | 24.6% | 38.0% | 21.5% | 1.9% | 32.8% | 37.0% |
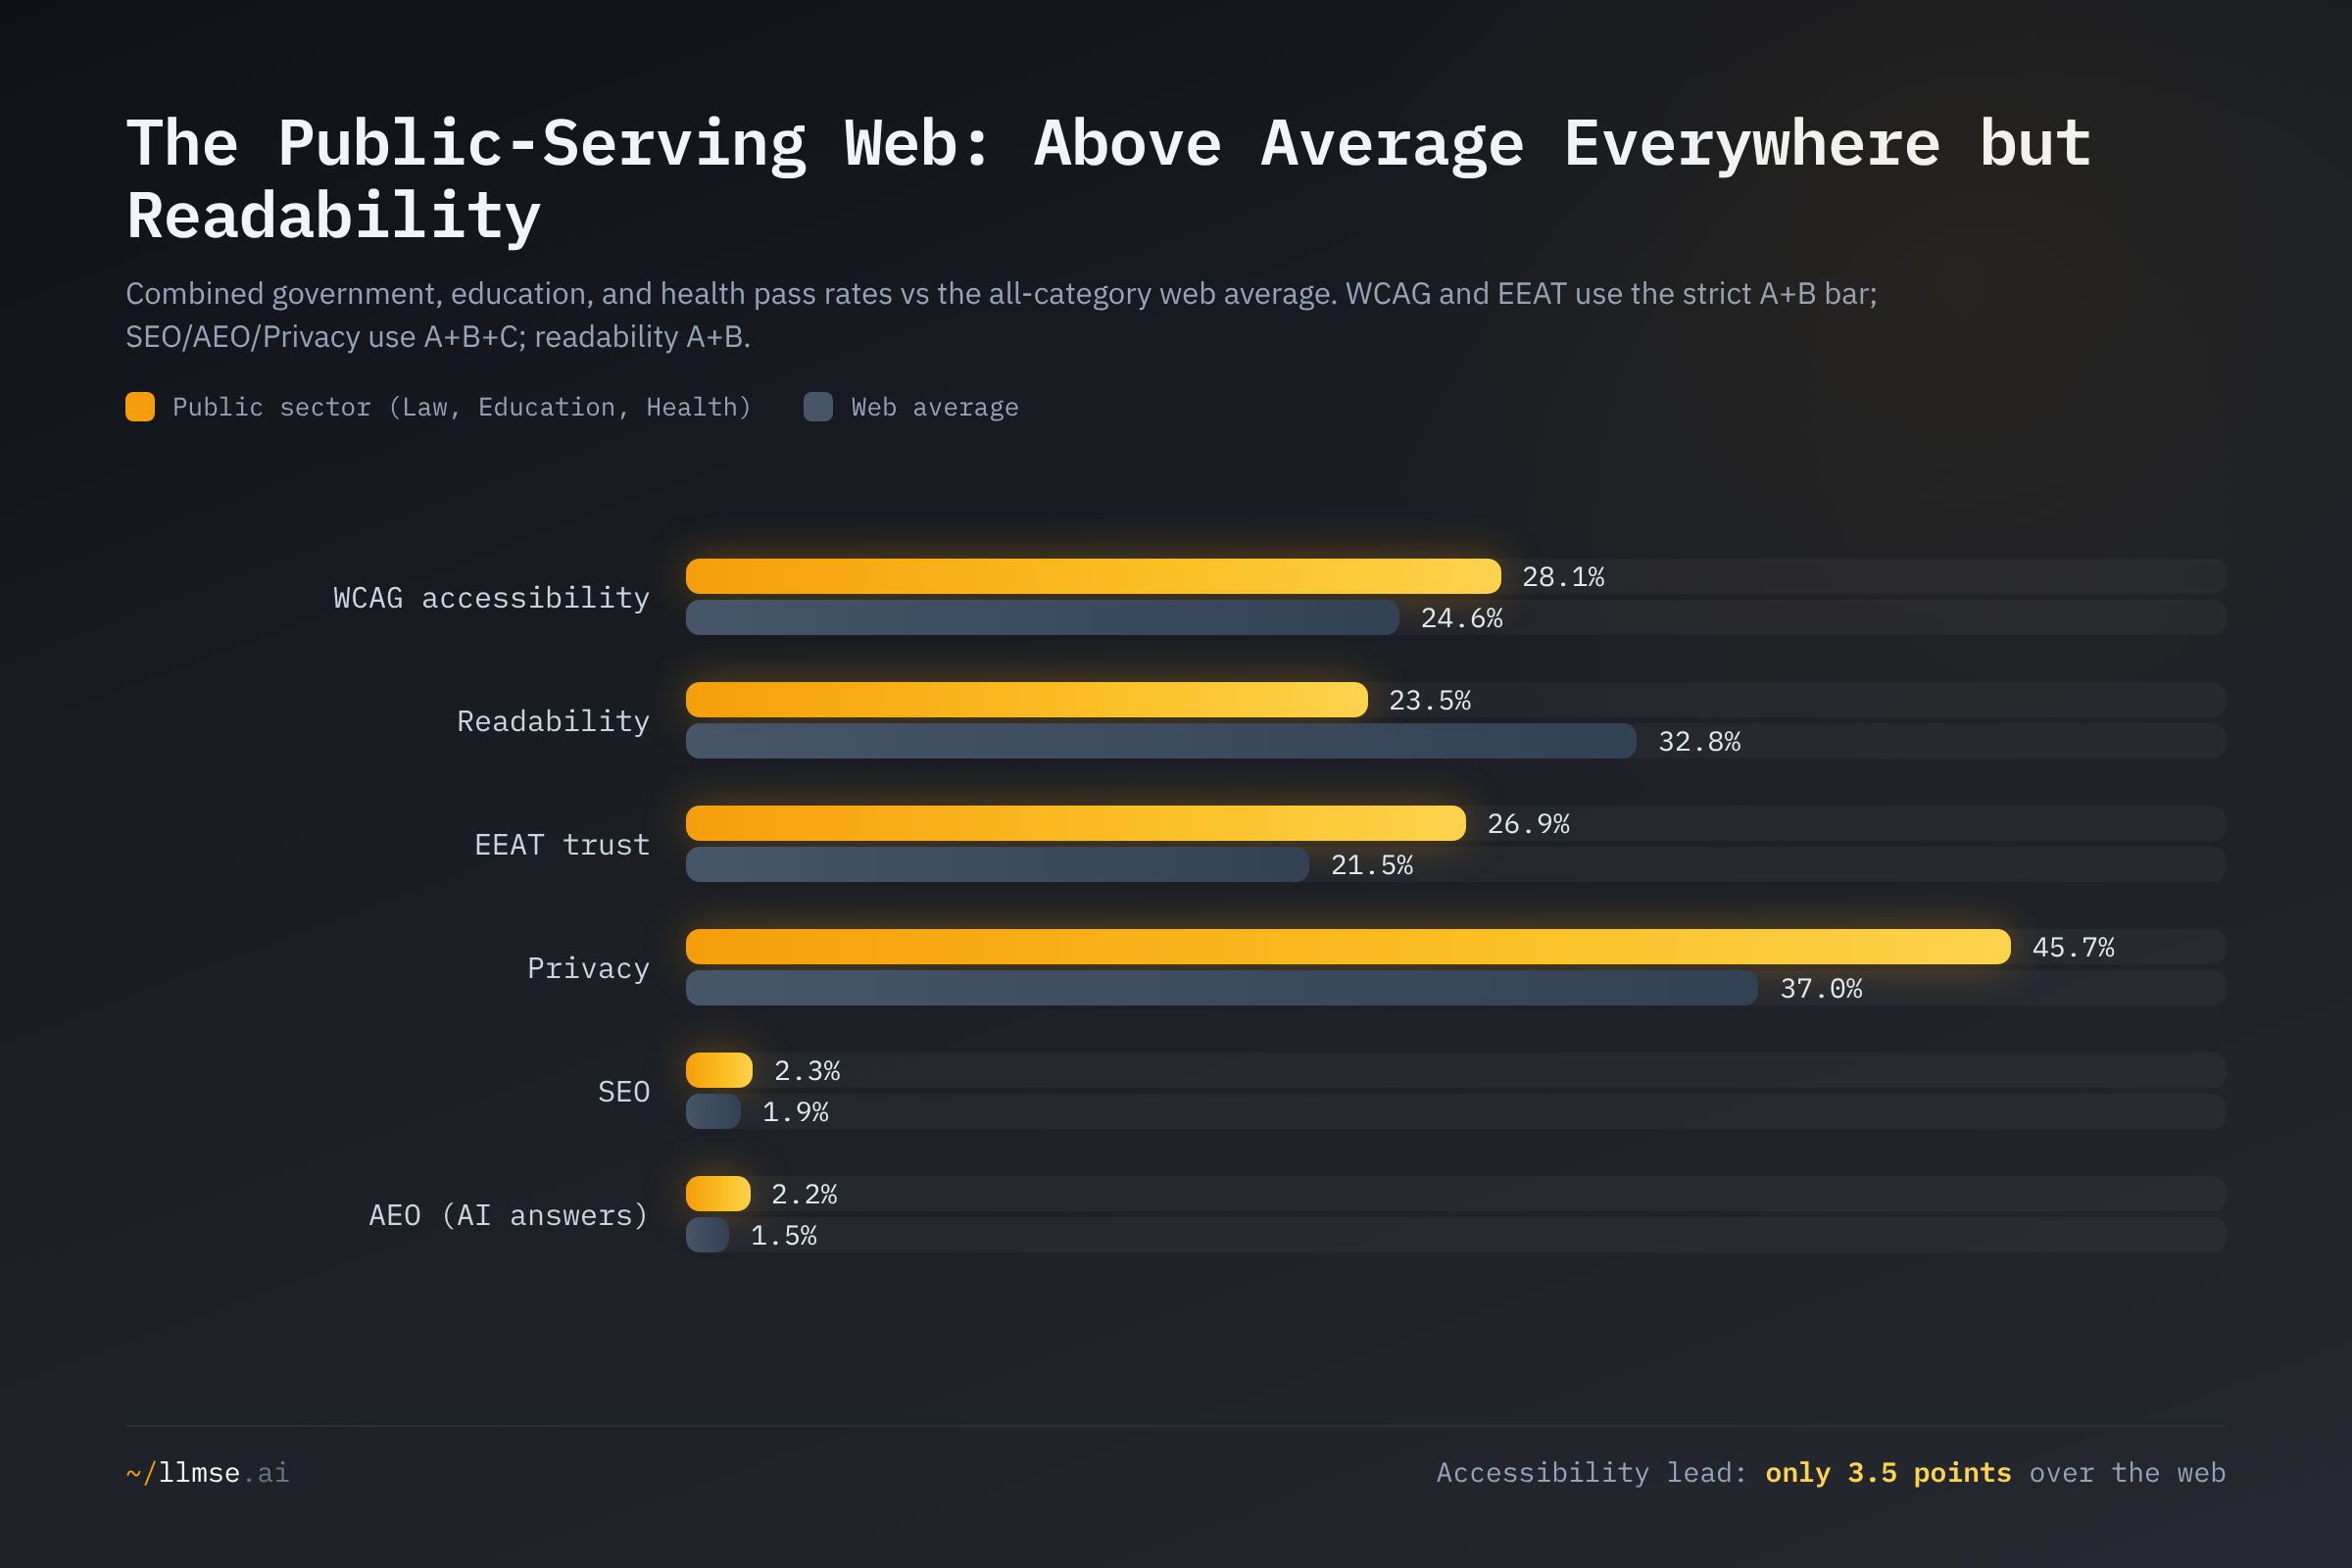
Pooled across all three sectors, the public-serving web beats the web average on five of six dimensions — and the one it leads by the slimmest margin is the one the law is about. Combined WCAG A+B sits at 28.1% against a 24.6% web average: a 3.5-point edge that still leaves 71.9% of these sites failing a floor accessibility check. The sector clears the web comfortably on privacy (45.7% vs 37.0%) and trust (26.9% vs 21.5%), edges it on discovery (SEO 2.3% vs 1.9%), and falls well below it on the one dimension no regulation directly rewards — readability (23.5% vs 32.8%). The public web is, in aggregate, slightly better than average at being navigable and slightly worse than average at being understandable — and nowhere near a passing grade on either.
Accessibility: A Last-Minute Reprieve, Not a Pass
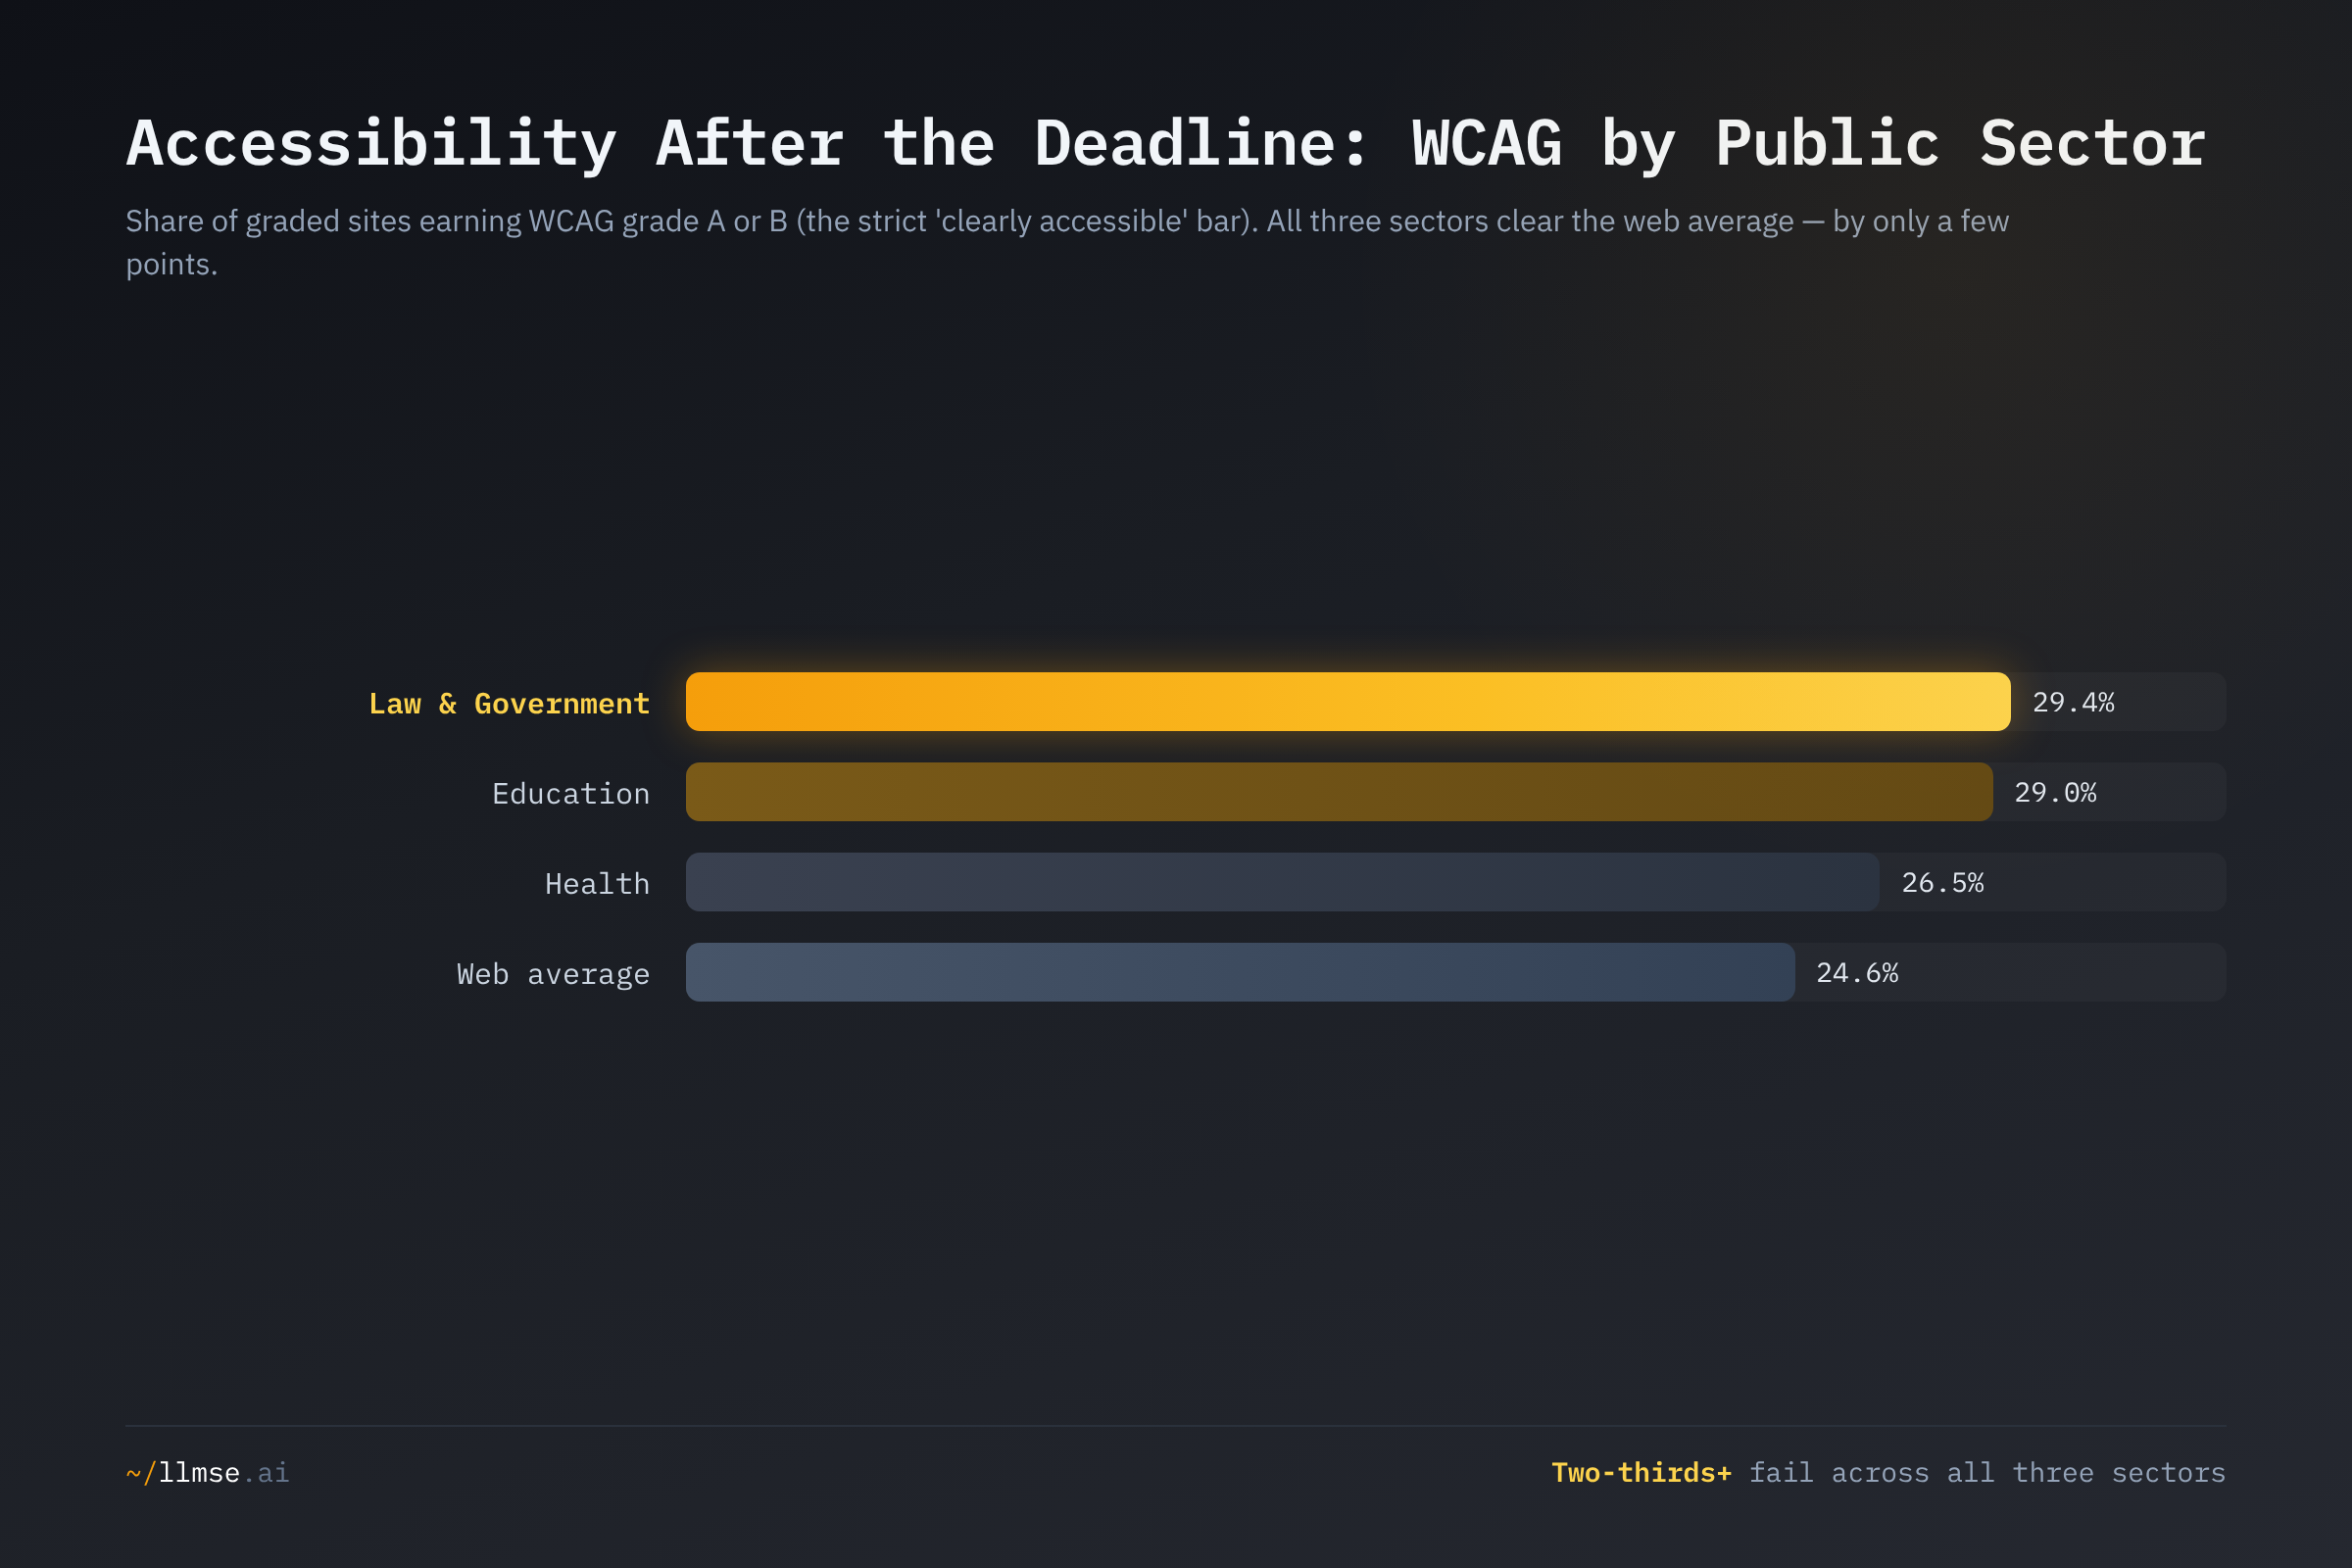
Both 2026 deadlines moved for the same reason: the sites are not ready, and the data quantifies it precisely. On the strict A+B bar, Law & Government leads at 29.4%, Education sits at 29.0%, and Health trails at 26.5% — a 2.9-point spread across three sectors and roughly 218,000 sites. These are not three different stories. They are one story told three times.
The original's standout finding — that Education was uniquely the worst — does not survive the larger dataset. On the near-complete population the three F-rates are nearly identical: Education 39.4%, Law & Government 39.2%, Health 38.9%. Whatever separated them in the early sample was sampling noise. The honest summary is that government, education, and health fail accessibility at the same rate, a hair under two in five sites scoring the lowest possible grade.
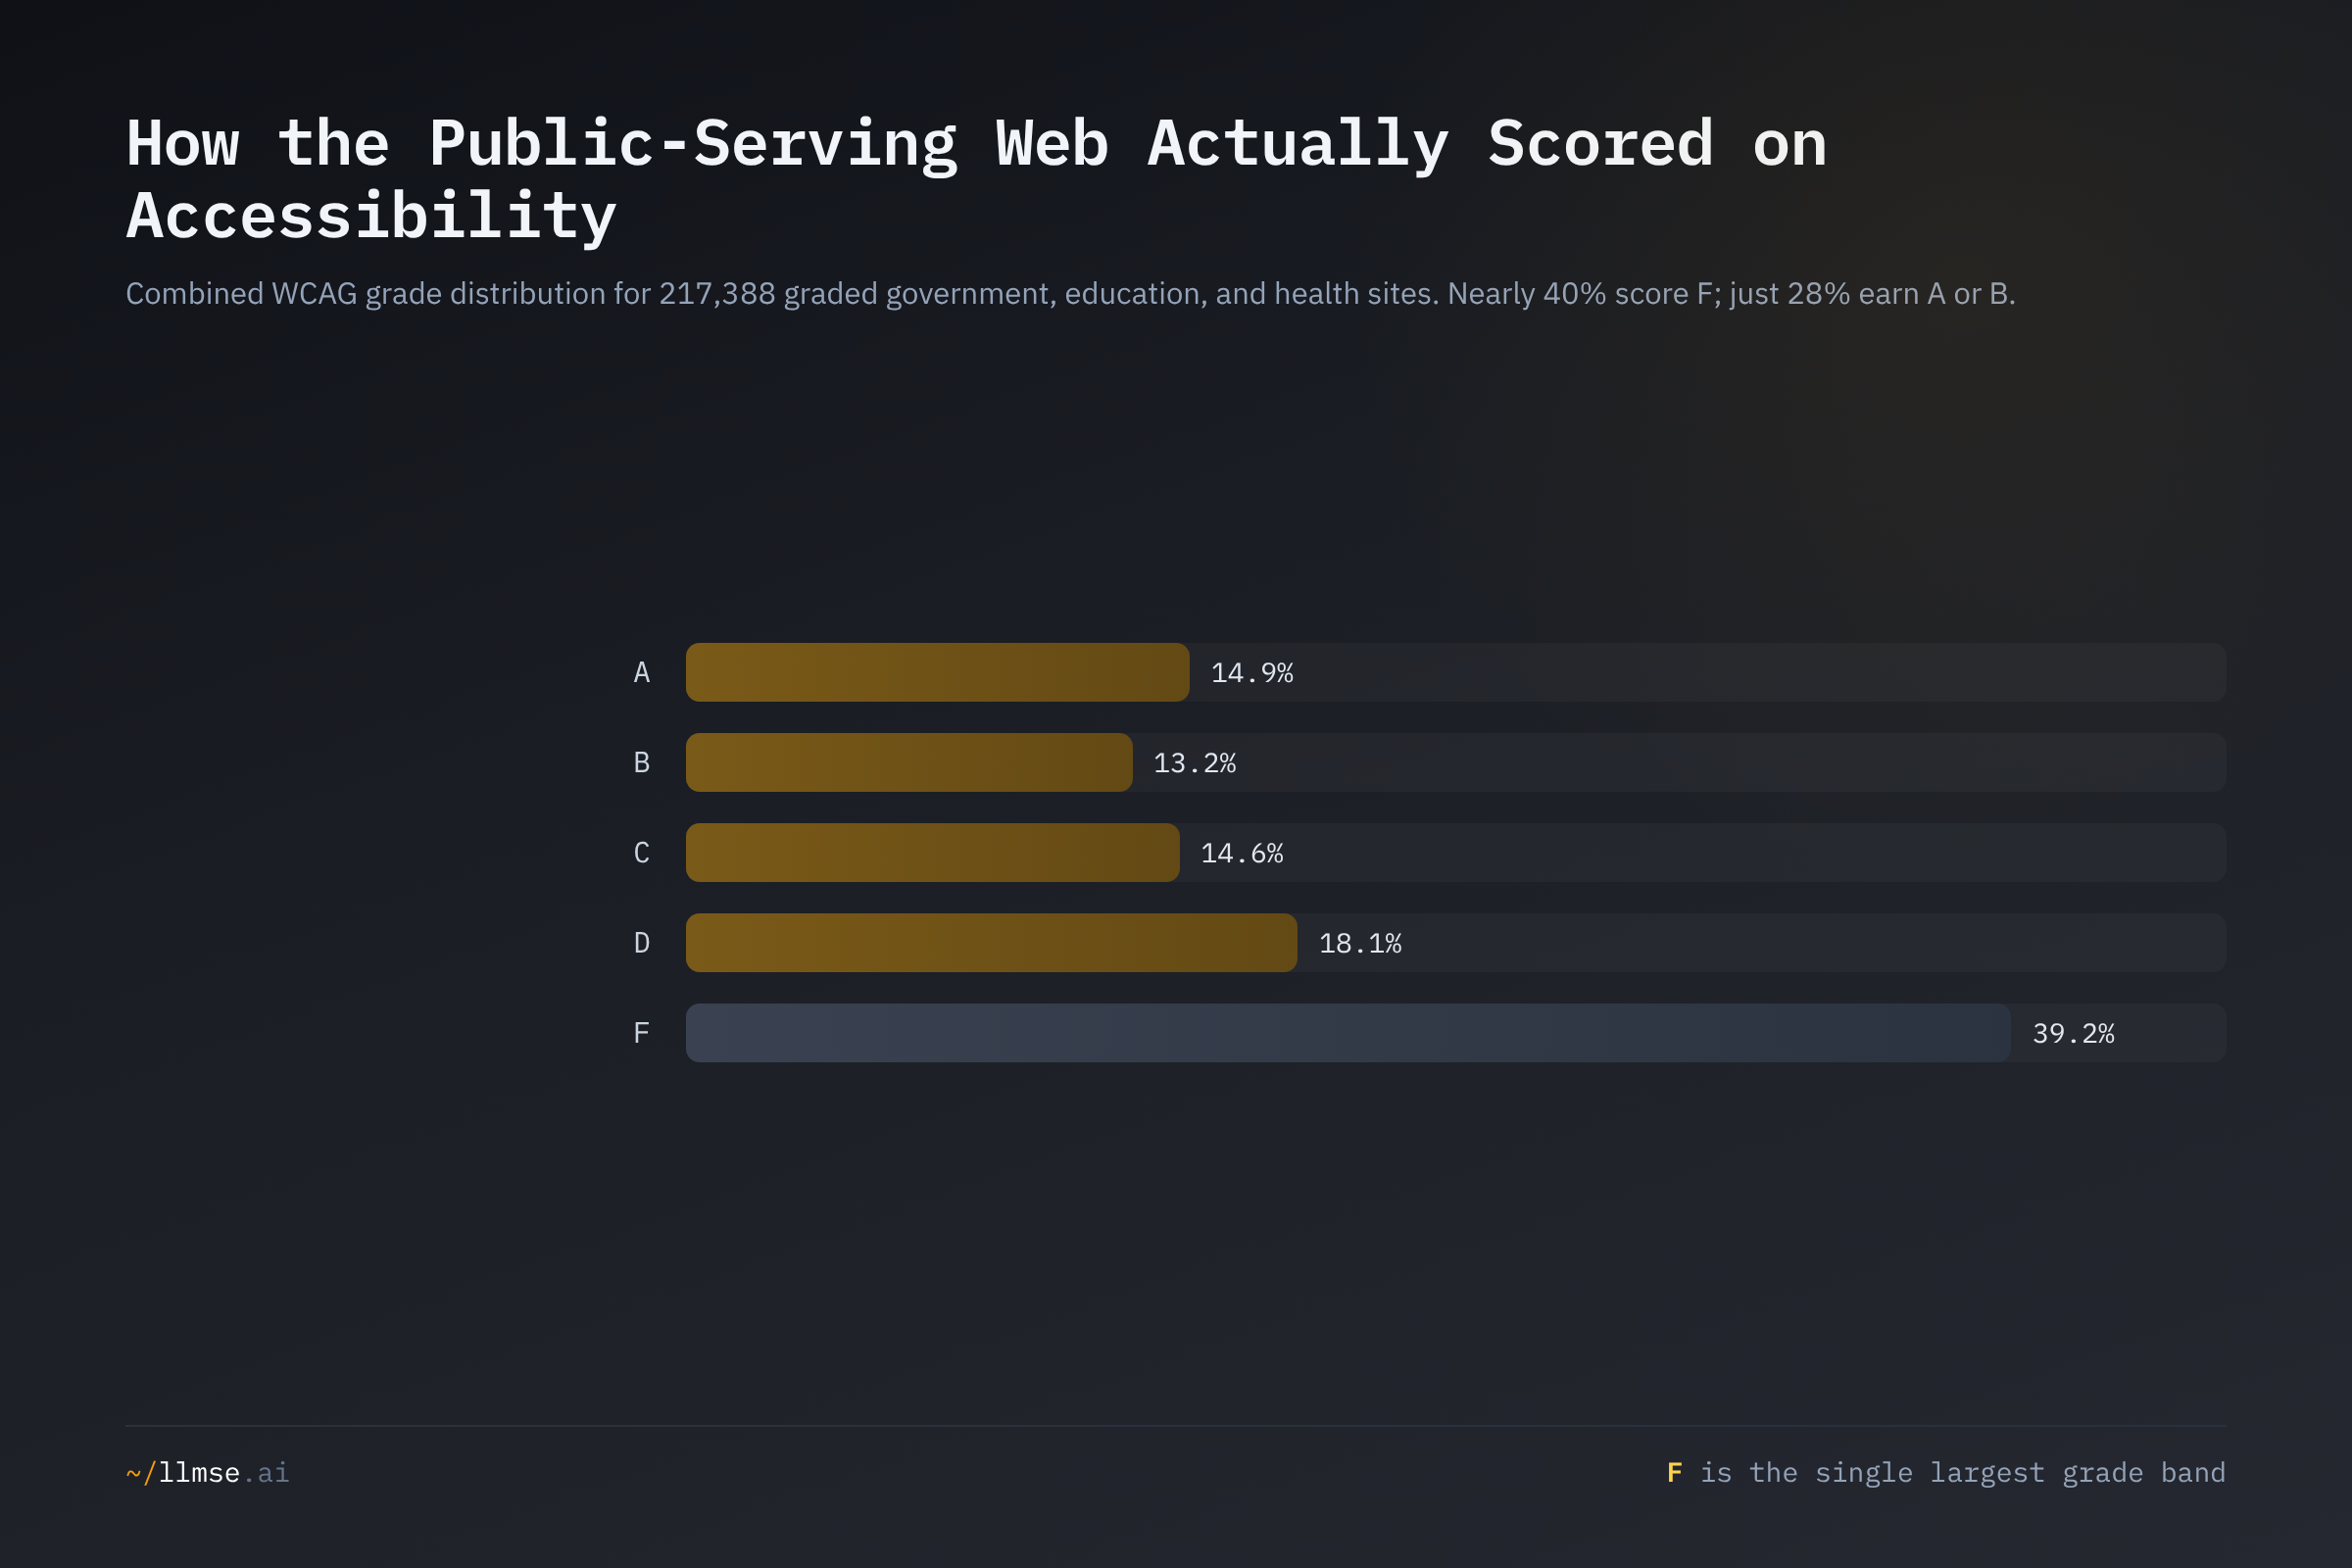
The shape of the distribution is the finding. F is the single largest grade band by a wide margin — 39.2% of all graded public-sector sites — while the clean-pass A and B bands together account for just 28.1%. Roughly 124,000 of these sites score D or F on automated checks alone. This is consistent with the broadest external benchmark available: WebAIM's 2026 Million report, an automated scan of the top one million home pages, found detectable WCAG failures on 95.9% of pages (up from 94.8% a year earlier — a reversal of six years of slow improvement), and measured government home pages at 42.4 errors per page and education at 48.9. Different method, same verdict: automated accessibility failure is the default state of the public web, and it is getting slightly worse, not better, even as the legal stakes rise. Because our grade reflects only ~30-40% of WCAG 2.1 Level A while the rules require Level AA, the true non-conformance rate is higher than the 72% these grades show.
Trust, Corrected: Health Trails, It Doesn't Lead
The original reported Health leading these sectors on trust at 37.8% EEAT. On the current index that is reversed: Health posts the lowest EEAT of the three at 22.5% (A+B), Education sits at 29.1%, and Law & Government leads at 30.4%. The reversal holds under either definition — on the broader A+B+C bar Health is still last (54.7%) and Law & Government still first (65.0%) — so this is a genuine correction, not a definitional artifact. The earlier figure rested on a few thousand graded health sites; the 76,686 graded today tell a different story.
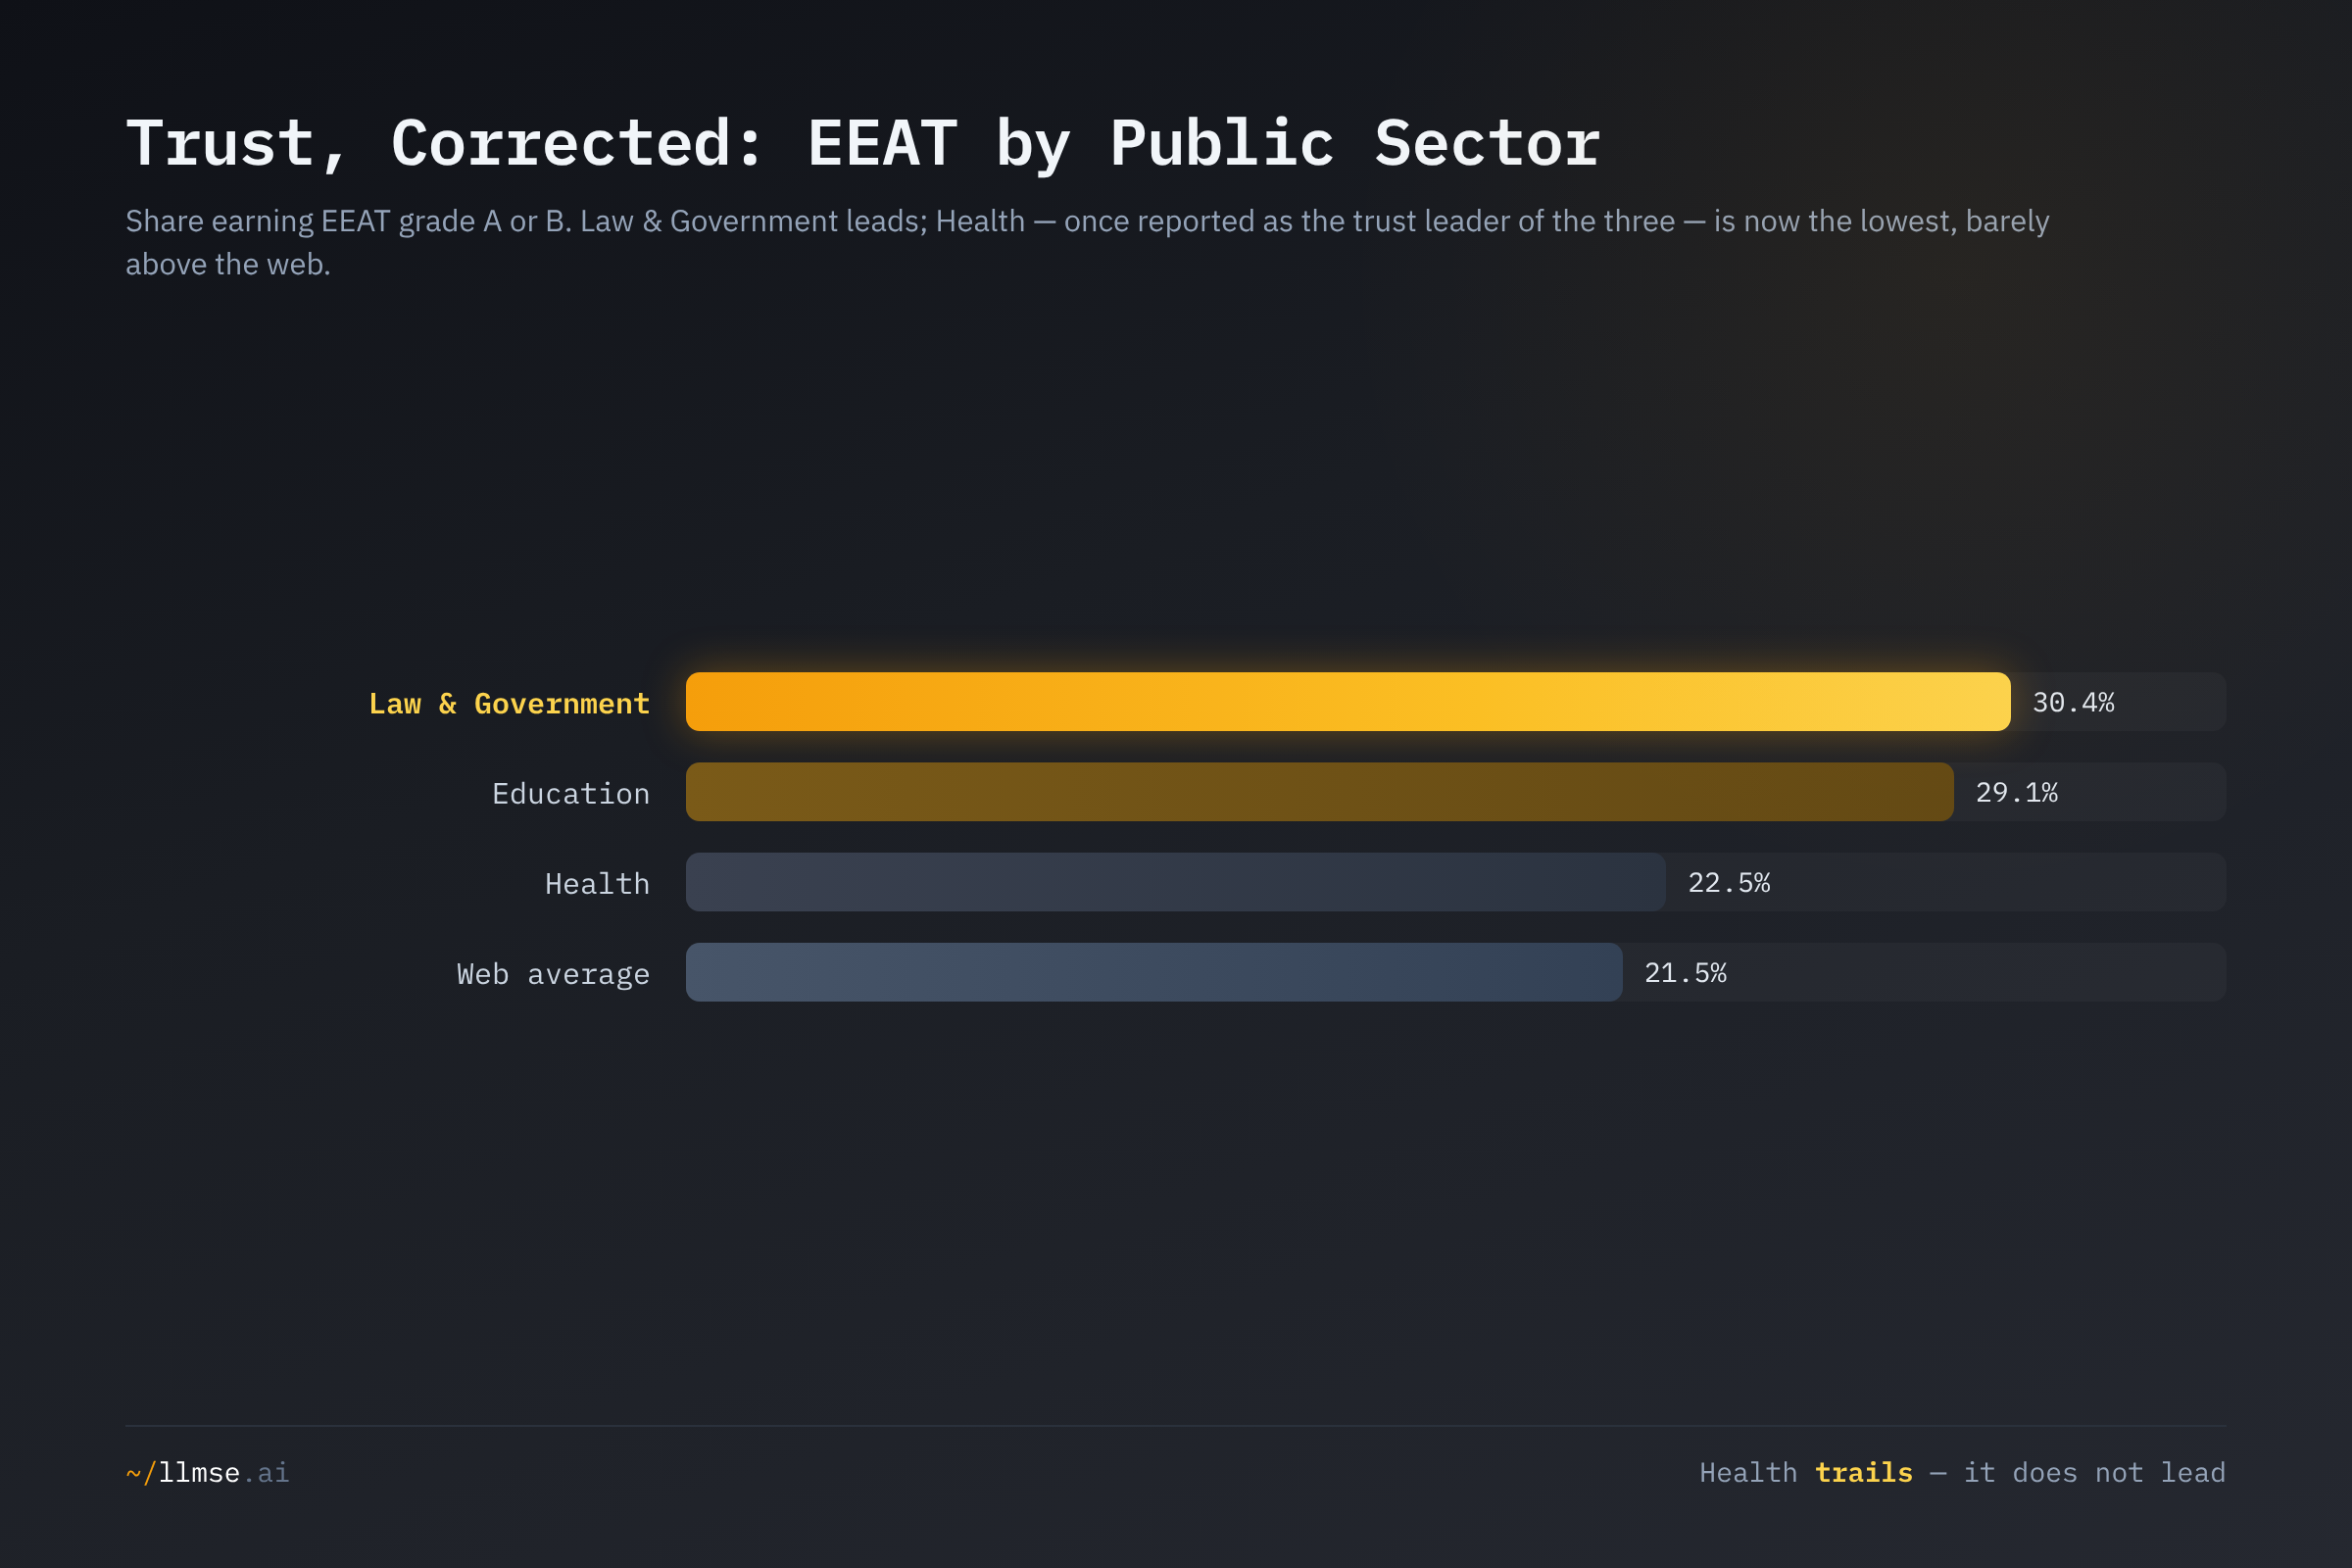
Law & Government's trust lead is consistent with its content type. EEAT measures organizational identity, authorship, editorial transparency, and citation behavior — signals that official government and legal sites carry almost by default (named agencies, statutory references, contact and accountability disclosures). Health is more heterogeneous: the category mixes hospitals and public-health departments with a long tail of clinics, supplement and product sites, and thin directory pages that disclose little about who stands behind them. Google's Search Quality Rater Guidelines single out health as the definitive "Your Money or Your Life" topic, where weak trust signals are penalized hardest — yet on the aggregate data health is precisely where those signals are thinnest among the public sectors. The trust gap compounds the accessibility gap: a health page that is both hard to navigate and weak on credibility fails the users least able to absorb the cost.
The Readability Wall: Government Writes the Web's Least Comprehensible Pages
If accessibility is about whether a page can be operated, readability is about whether it can be understood — and here the public sector is worst of all. Law & Government passes readability at just 17.3%, the lowest of the three sectors and barely half the 32.8% web average. Education (23.3%) and Health (25.5%) are also well below the web. Across all three, plain comprehension is the exception.
This is the same pattern the Cross-Industry Quality Report Card found at full scope: Law & Government is the least-readable corner of the entire web, despite posting one of the better accessibility rates. The page is technically navigable; the sentences are not parseable. Legal, regulatory, and bureaucratic prose is written for specialists, not for the public that depends on it — and the U.S. Plain Writing Act of 2010 exists precisely to close that gap. Sixteen years on, the aggregate data shows it has not. Note the paradox in the scorecard profile above: Law & Government leads the public sector on accessibility, trust, and discovery yet writes its least comprehensible content. A building-permit application can be screen-reader-navigable and still incomprehensible to the citizen filling it out — and no accessibility audit will catch that, because plain language is not a WCAG success criterion.
The one place the public sector quietly does well is discovery: Law & Government leads on SEO at 3.0%, above the 1.9% web average, with Health at 2.8%. Search visibility for a government service translates into public access rather than revenue, but the incentive to be found is real, and government and health content competes for high-intent informational queries. Even so, these rates are low in absolute terms — fewer than one public-sector site in thirty passes a baseline technical-SEO check, and AI-answer optimization (AEO) is lower still at roughly 2.2% combined. As AI answer engines mediate more public-service queries, content that isn't extractable won't be surfaced.
What's at Stake
- The obligation didn't disappear — it moved. Both DOJ (now April 26, 2027) and HHS (now May 11, 2027) extended by exactly one year, and the WCAG 2.1 AA standard is unchanged. The extensions buy time, not amnesty; the ~124,000 public-sector sites currently scoring D or F still have to clear a far higher bar than the one they fail today.
- No sector is ready, and none is the outlier. Government, education, and health fail at nearly identical ~39% F-rates. Remediation planning that targets "the worst sector" is mis-scoped — the gap is uniform across the public-serving web, so the effort has to be too.
- Health carries a double gap. Health posts both the lowest accessibility A+B rate (26.5%) and the lowest trust EEAT of the three (22.5%) — and it is the sector under the separate, also-extended HHS Section 504 rule. For YMYL health content, weak credibility and weak accessibility stack on the users least able to absorb either.
- Readability is the unregulated failure. The public sector's worst dimension (Law & Government at 17.3%) is the one no rule scores. A page can pass a WCAG audit and still exclude the 54% of U.S. adults who read below a 6th-grade level. Compliance and comprehension are not the same project.
- The measured floor understates the real gap. These grades reflect ~30-40% of WCAG 2.1 Level A; the rules require Level AA. The true non-conformance rate is higher than 72%, and the independent WebAIM Million — finding failures on 95.9% of home pages — suggests how much higher.
What Would Help
- Public-sector web teams: treat the extension as runway, not relief. The one-year delay exists because remediation at scale is genuinely hard, not because the standard softened. Start with an automated accessibility check to find the floor failures, then budget for the manual Level AA work — contrast, keyboard operation, and screen-reader testing — that automated tools cannot see. The 2027 date arrives the same way 2026 did.
- Education and health platform owners: audit the stack, not just the page. Accessibility outcomes track strongly with the CMS and front-end framework a site is built on — documented across WCAG by Industry and Platform and The CMS Quality Gap. For institutions choosing or replacing a platform, that is the single highest-leverage decision; for those staying put, accessibility-audited themes and components close more of the gap than per-page fixes.
- Health communicators: rebuild trust signals alongside accessibility. Health's lowest-of-three EEAT (22.5%) is a fixable, low-cost gap — named authorship, organizational and medical-review schema, clear contact and accountability information. These signals satisfy YMYL scrutiny and make health content more likely to be surfaced by AI answer engines at the same time.
- Every public entity: fix the highest-volume failures first. WebAIM's analysis finds the same handful of issues dominate automated failures year after year — low-contrast text, missing alternative text, and unlabeled form fields. These are cheap, high-coverage wins that move a site off an F before the harder Level AA criteria are tackled.
- Don't mistake the automated floor for the legal ceiling. A clean automated scan covers roughly a third of Level A. The rules require Level AA, which means manual testing for contrast, keyboard navigation, and assistive-technology compatibility. Automated tools find the floor; only human auditors find the ceiling the law actually sets.
This analysis was conducted using LLMSE, which has classified over 3.4 million websites across SEO, EEAT, AEO, WCAG accessibility, readability, GARM brand safety, and privacy dimensions. Public-sector figures reflect 220,554 classified Law & Government, Education, and Health sites in the index as of June 2026; WCAG analysis covers automated checks approximating 30-40% of WCAG 2.1 Level A. To analyze your own site across every dimension in this post, visit llmse.ai/classify.