WCAG Accessibility by Industry and Platform: The Web's 38% F-Rate
Update — 2026-06-29: This post has been rebuilt from the ground up. The original ranked a hand-picked sample of 30 famous websites; that curated table has been dropped entirely and replaced with aggregate WCAG grades for all 3.34 million classified URLs in LLMSE's index (up from ~1.5M at first publication). The refreshed picture is less flattering than the early sample implied — the web-wide outright-F rate is now 38.0% (was 29.9%) and only 24.6% of sites earn a strict A or B (was 30.8%), because broader crawl coverage pulled in the long tail of low-quality pages. Two analyses are new: a platform cut showing your CMS predicts your accessibility score, and a grade-band view showing the 43.8% "pass" rate rests heavily on marginal C grades. The core thesis holds and is sharper: web accessibility is deeply uneven, and structure and platform — not industry prestige — predict where a site lands.
The most-cited number in web accessibility comes from the WebAIM Million, an annual scan of the top one million home pages. Its 2026 edition found that 95.9% of those home pages had detectable WCAG 2 failures, averaging 56.1 distinct errors each. That figure is sobering, but it describes the elite of the web — the million most-visited front doors, built by the best-resourced teams. It says nothing about the other tens of millions of sites that make up the actual web.
We can. LLMSE runs an automated WCAG 2.1 Level A check on every URL it classifies, and the index now spans 3.34 million sites across the long tail — small businesses, hobby pages, regional shops, documentation, forums — not just the famous front doors. The conventional intuition is that accessibility tracks prestige and budget: the big, regulated, well-funded sectors should build accessible sites, and everyone else lags. The aggregate data only half-confirms it, and the better predictor turns out to be something else entirely.
We graded 3,341,238 sites on automated WCAG 2.1 Level A checks — alt text, form labels, heading structure, page titles, language attributes, landmarks, link and button names, and viewport zoom — assigning each an A-F grade. These are static-HTML checks, covering roughly 30-40% of WCAG 2.1 Level A; they catch real barriers but cannot replace manual testing. We then cross-referenced the grades against content category and detected CMS to answer the question the curated benchmarks can't: across an entire industry's web presence, and across the platforms that build it, where does accessibility actually stand?
The web passes WCAG at 43.8% — but that headline hides the floor underneath it. Nearly two in five sites (38.0%) earn an outright F, fewer than one in seven (14.4%) earn a clean A, and the "pass" rate leans heavily on marginal C grades. By category, the leaders are structural and entertainment sites, not the prestige verticals; the laggards are Shopping and Productivity, both majority-F. And the single sharpest signal is the platform: sites built on Plone and Squarespace pass at 53-68%, while sites on Weebly pass at just 15.4% — a gap of over 50 points that has nothing to do with industry.
The Data
WCAG is the one dimension in LLMSE's pipeline applied to nearly the entire index. Of the 3.34M classified URLs, 3,341,238 carry a WCAG grade. The grade distribution is the headline dataset:
| Grade | Score band | Sites | Share |
|---|---|---|---|
| A | 90-100 | 479,903 | 14.4% |
| B | 80-89 | 340,663 | 10.2% |
| C | 70-79 | 644,075 | 19.3% |
| D | 60-69 | 608,004 | 18.2% |
| F | 0-59 | 1,268,593 | 38.0% |
| Total graded | 3,341,238 | 100% |
Each site's grade comes from LLMSE's automated WCAG analyzer applied uniformly across the index — not a hand-picked sample of famous brands, and not a single home-page snapshot of the most-visited sites. Pass (A+B+C) covers 43.8% of graded sites; strict pass (A+B) covers just 24.6%; and 38.0% fail outright. Those three numbers, not a single average, are the real shape of web accessibility. The sections below slice them by industry and by platform.
Methodology
This post makes quantitative comparisons, so the definitions and limits matter.
- Grades and "pass." Each site is graded A-F by LLMSE's automated WCAG analyzer (there is no E grade), scored on a deduction model from a clean 100. Following the convention used across LLMSE's quality reports, "pass" means A+B+C (a grade of C or better) and "strict pass" means A+B. Where the original version of this post reported a single A+B "pass" figure, we report both bands here, because the gap between them is itself a finding.
- What the checks cover. The analyzer runs static-HTML checks for image alt text, form input labels, heading hierarchy, page titles, the document language attribute, landmark structure, accessible link and button names, duplicate element IDs, ARIA usage, and viewport zoom suppression. These automated checks cover only ~30-40% of WCAG 2.1 Level A criteria. Color contrast, keyboard operability, focus management, and dynamic-content behavior require manual or browser-based testing and are not captured. A passing grade means a site clears the automatable Level A floor — not that it is fully conformant. A failing grade reliably indicates real, machine-detectable barriers.
- Classification basis. Category membership is assigned by LLM classification across 58 categories; CMS and site-builder detection is by server-response and markup fingerprinting. Each WCAG grade is independent of those labels.
- Cross-references are computed as set intersections (Redis
ZINTERCARD) between a category or platform index and each WCAG grade index (wcag-A…wcag-F). All counts are aggregate; no individual site is identified. A reader with the same indices can reproduce every figure here. - Known limits. Pass rates are over the graded population. Category and CMS labels are not mutually exclusive (a WordPress site also carries its category), so the two cuts are independent views of the same population, not a partition. Segments below ~10,000 graded sites are flagged as small samples (notably Wix, n=3,005). Counts are a live snapshot and drift as classification continues. Russian-language sites are excluded from every aggregate.
- Why these numbers differ from the original. The first version of this post (February 2026) was built on a curated table of 30 famous websites plus a ~32,700-URL global snapshot. That curated table has been dropped — a hand-picked list of flagship brands cannot be reproduced and is not representative. Rebuilt against the full 3.34M-site index, the web-wide picture is harder: the graded population grew more than 100-fold and early grades skewed toward higher-quality, more-visible sites, so the outright-F rate rose from 29.9% to 38.0% and strict A+B fell from 30.8% to 24.6% as the long tail came into view.
The Scorecard
Pass rate (A+B+C) by content category, for every category with at least 10,000 graded sites. The full ranking spans from Reference at 74.7% down to Productivity at 27.6% — a 47-point spread.
| Category | Sites graded | WCAG pass | vs web |
|---|---|---|---|
| Reference | 44,544 | 74.7% | +30.9 |
| Sensitive Topics | 145,268 | 58.9% | +15.1 |
| Entertainment | 223,374 | 57.7% | +13.9 |
| Computer & Electronics | 395,621 | 48.9% | +5.1 |
| Events | 50,885 | 47.8% | +4.0 |
| Attractions | 78,156 | 46.9% | +3.1 |
| Gambling | 73,007 | 46.4% | +2.6 |
| Internet & Telecom | 70,101 | 44.1% | +0.3 |
| Law & Government | 19,233 | 43.9% | +0.1 |
| Health | 76,397 | 43.1% | -0.7 |
| Education | 121,553 | 42.3% | -1.5 |
| Finance | 18,040 | 41.6% | -2.2 |
| Business & Industry | 1,018,967 | 40.4% | -3.4 |
| Sports | 36,714 | 36.6% | -7.2 |
| Automotive | 66,105 | 36.4% | -7.4 |
| Travel | 31,406 | 35.6% | -8.2 |
| Beauty & Fitness | 47,122 | 35.1% | -8.7 |
| News & Media | 70,494 | 34.7% | -9.1 |
| Shopping | 41,103 | 30.6% | -13.2 |
| Productivity | 10,364 | 27.6% | -16.2 |
| Web average | 3,341,238 | 43.8% | — |
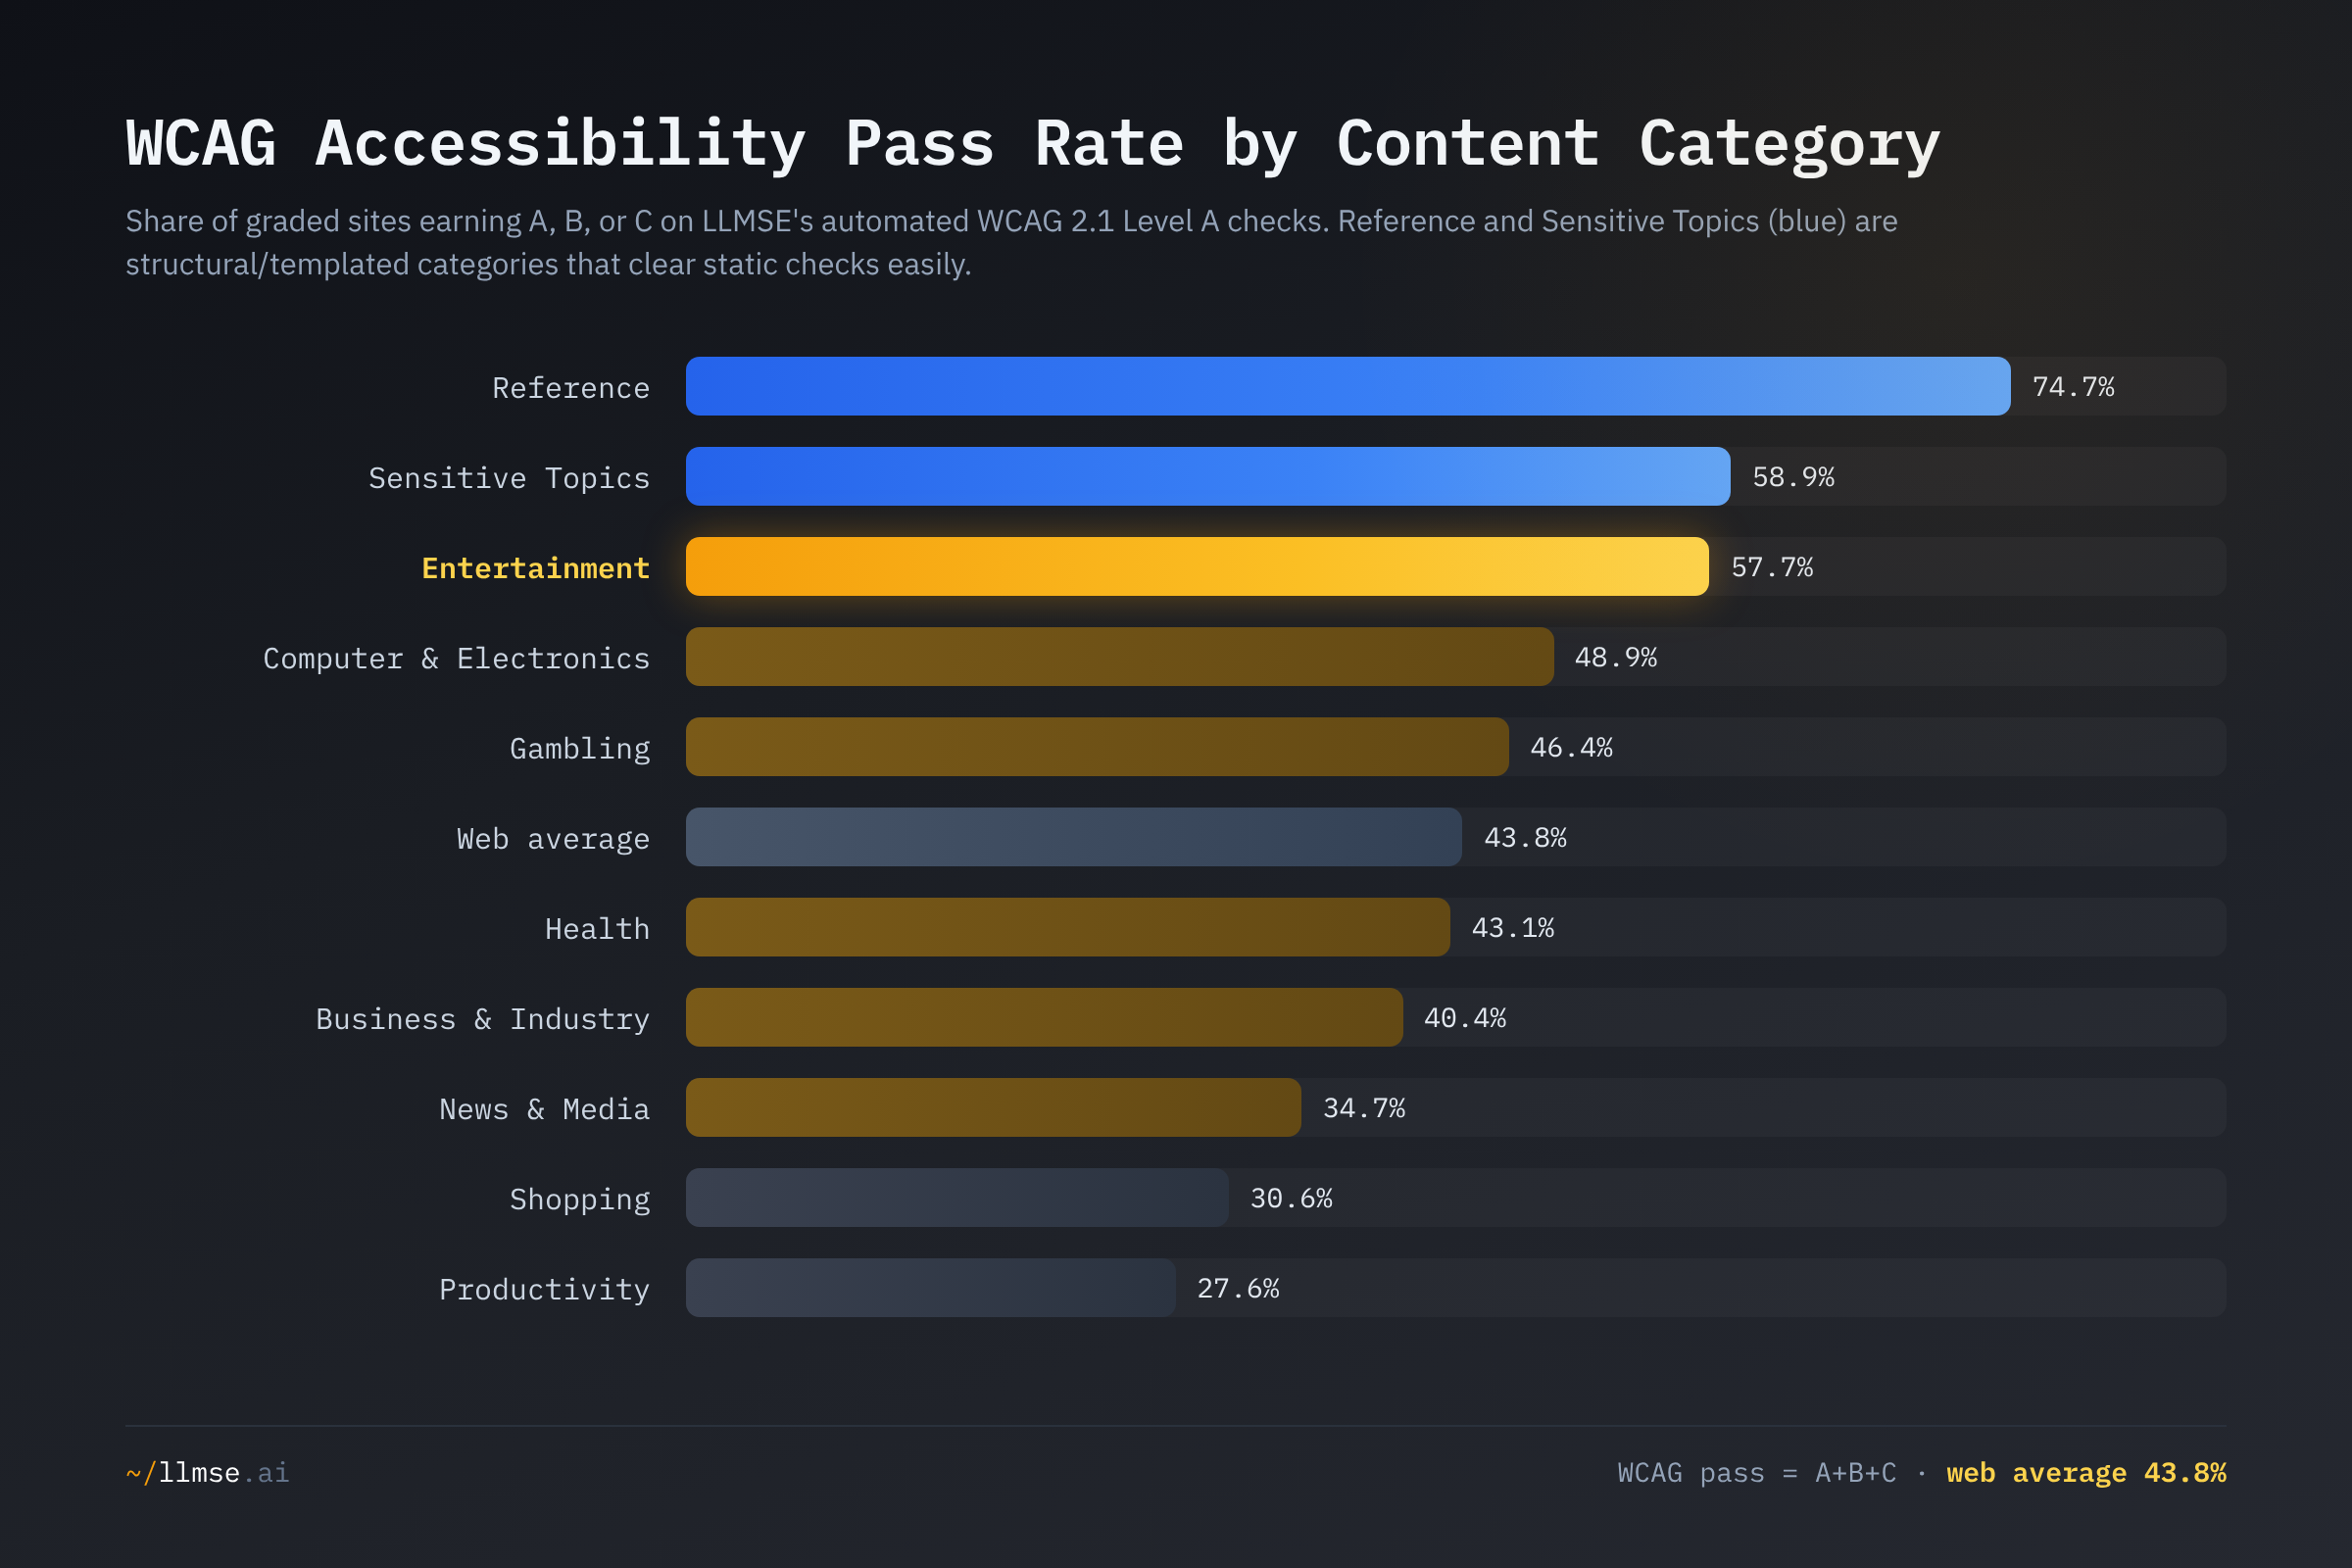
The leaderboard is not organized by prestige or budget — it is organized by page structure. The top of the board is dominated by categories with templated, text-first, structurally simple pages: Reference (dictionary, encyclopedia, and wiki-style entries) passes at 74.7%, and Sensitive Topics and Entertainment follow. The high-stakes regulated verticals that conventional wisdom expects to lead — Health (43.1%), Finance (41.6%), Law & Government (43.9%) — cluster right around the web average. And the bottom belongs to Shopping (30.6%) and Productivity (27.6%), the two categories whose interactive, widget-heavy pages most reliably trip automated checks. The story of web accessibility is less about who has the money and more about what the page is made of, and what platform built it.
The Grade Bands: A "Passing" Web Built on C's
A single pass rate flattens a distribution that is anything but uniform. Plotting the full A-F spread shows why 43.8% is a generous read.
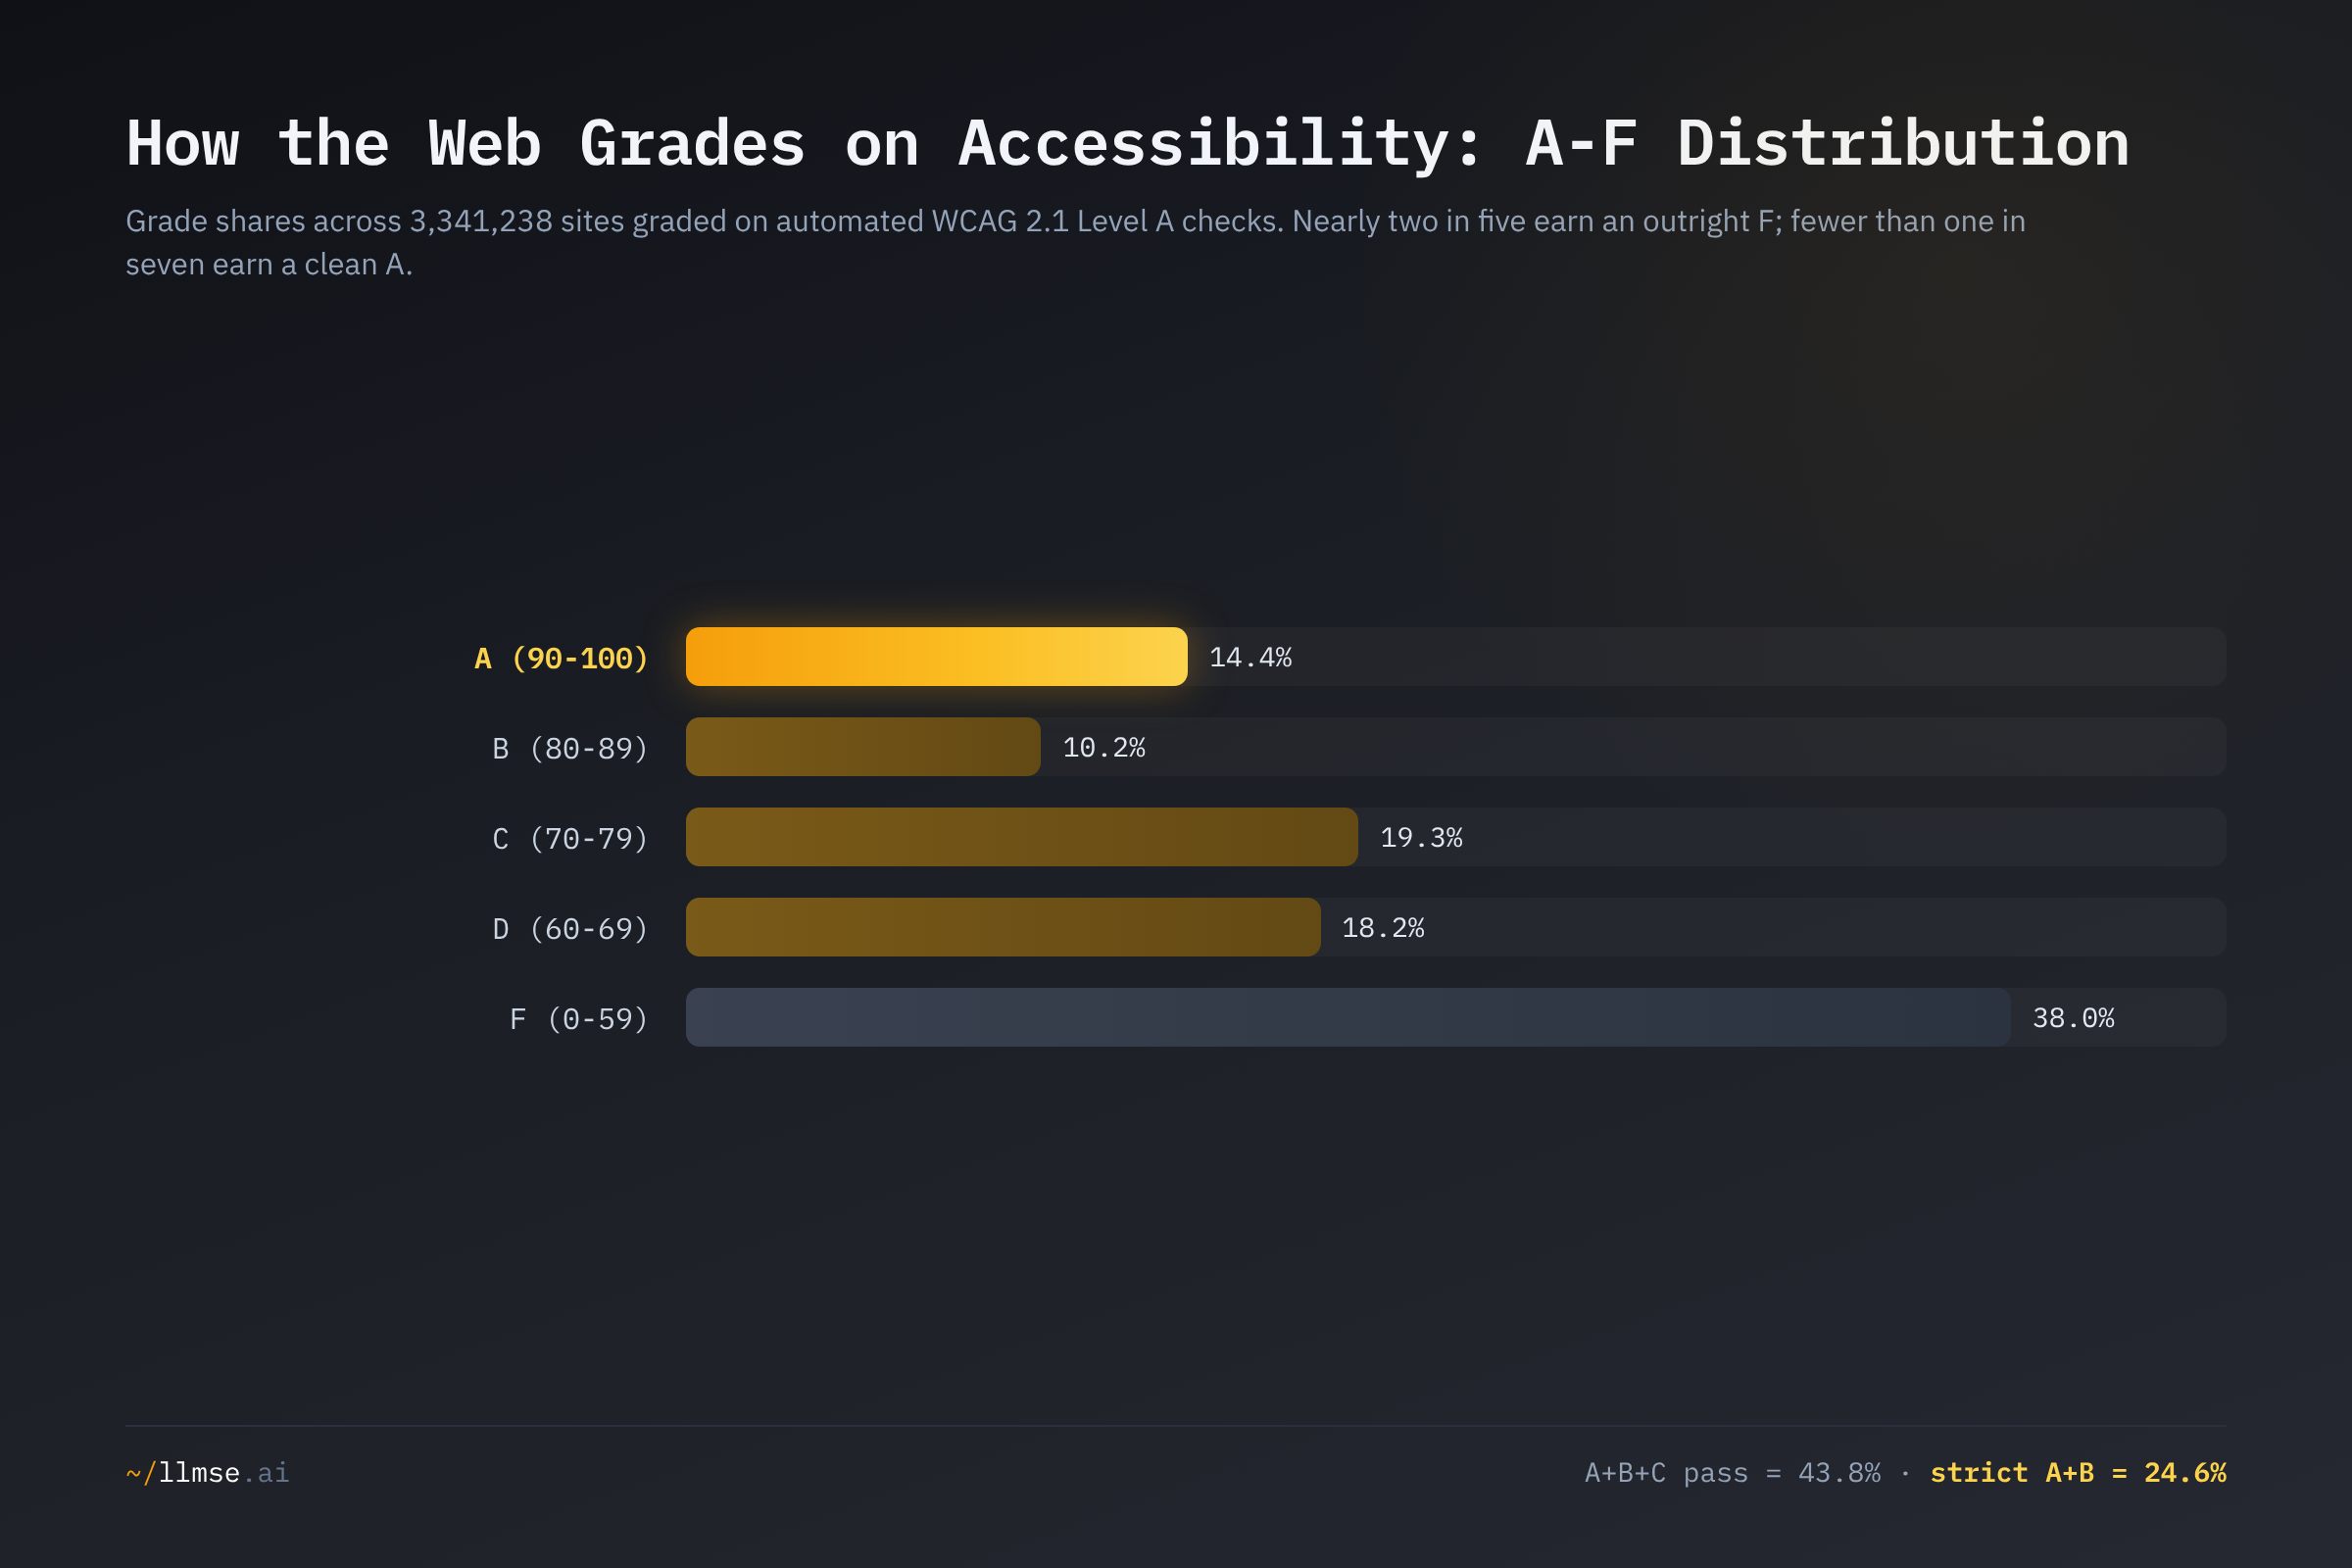
The web's accessibility is bimodal: a thin band of genuinely accessible sites at the top, a thick wall of failures at the bottom, and a soft middle that "passes" on a technicality. Only 14.4% of sites earn a clean A — fewer than one in seven clear the automatable Level A floor with no significant deductions. Above the F line, the largest passing band is C (19.3%), not A or B. That means a large share of the 43.8% "pass" rate is sites scraping over the bar with multiple warnings, not sites that are actually well-built for assistive technology. Tighten the definition to a strict A+B and the passing web shrinks to 24.6%.
The C-heavy pattern shows up most sharply in the category that leads the pass ranking. Entertainment passes at 57.7%, but only 20.8% of its sites earn an A or B — below the web-wide strict rate of 24.6%. Of its 223,374 graded sites, 36.8% land in the C band: structurally adequate pages that clear the floor without excelling. Reference shows the same shape (49.1% of its sites are C-graded). These categories lead on "pass" because their templated pages avoid outright failure, not because they are exemplars. Computer & Electronics, by contrast, is more polarized — a higher A-rate (16.6%) than Entertainment's (12.8%), but also a 28.3% F-rate — consistent with a sector that contains both meticulously hand-built developer sites and abandoned, broken project pages.
At the bottom, the F band is not a tail — it is the single largest grade. The two worst mainstream categories are majority-F: 55.2% of Shopping sites and 54.1% of Productivity sites score F. For a large fraction of the commercial web, automated accessibility is not marginal; it is absent.
The Category Spread: Structure Beats Sophistication
Why does a dictionary site out-score a bank? The pattern is consistent with what automated WCAG checks actually measure. The WebAIM Million found that 96% of all detected accessibility errors fall into just six categories — low-contrast text (83.9% of home pages), missing image alt text (53.1%), missing form labels (51%), empty links (46.3%), empty buttons (30.6%), and missing document language (13.5%). Five of those six are exactly the checks LLMSE's static analyzer runs, and almost all of them are failures of interactive and media-rich elements: form controls, icon buttons, image grids, custom widgets.
That maps directly onto the category ranking. The categories that lead are the ones with the fewest of those elements. Reference and encyclopedic content is mostly structured text with semantic headings and few forms — little surface area for the six common errors. Entertainment and streaming platforms are built by teams with mature front-end practices and clear at least the structural floor. The categories that trail are precisely the interactive ones: Shopping (30.6%) is a wall of product grids, carousels, add-to-cart buttons, faceted filters, and image thumbnails — the densest possible concentration of empty links, unlabeled buttons, and missing alt text. Productivity (27.6%) apps are JavaScript-driven interfaces whose accessible names live in runtime ARIA that static HTML never exposes.
This is the same paradox visible in the cross-industry report card: Shopping earns the web's highest trust, readability, and privacy scores while building its least accessible pages. The sector has optimized every signal that closes a sale for a sighted buyer arriving with intent, and neglected the ones that serve a screen-reader user. It is a choice about where to spend front-end effort, not a limitation of resources — and, as the platform cut shows next, often a choice baked into the tooling.
The Platform Effect: Your CMS Predicts Your Score
The strongest single predictor of a site's WCAG grade is not its industry — it is the platform it is built on. Pass rates by detected CMS and site builder span more than 50 points.
| Platform | Sites graded | WCAG pass | Notes |
|---|---|---|---|
| Plone | 19,016 | 68.4% | Enterprise/gov/academic CMS |
| Squarespace | 26,290 | 53.3% | Premium hosted builder |
| Drupal | 34,982 | 49.2% | Open-source CMS |
| WordPress | 1,047,962 | 45.1% | Dominant CMS |
| Tilda | 45,391 | 39.5% | Hosted builder |
| Joomla | 28,139 | 35.4% | Open-source CMS |
| Webflow | 13,322 | 31.3% | Visual builder |
| Shopify | 15,249 | 26.4% | E-commerce platform |
| Wix | 3,005* | 25.2% | Hosted builder (*small sample) |
| Weebly | 16,294 | 15.4% | Hosted builder |
| Web average | 3,341,238 | 43.8% | — |
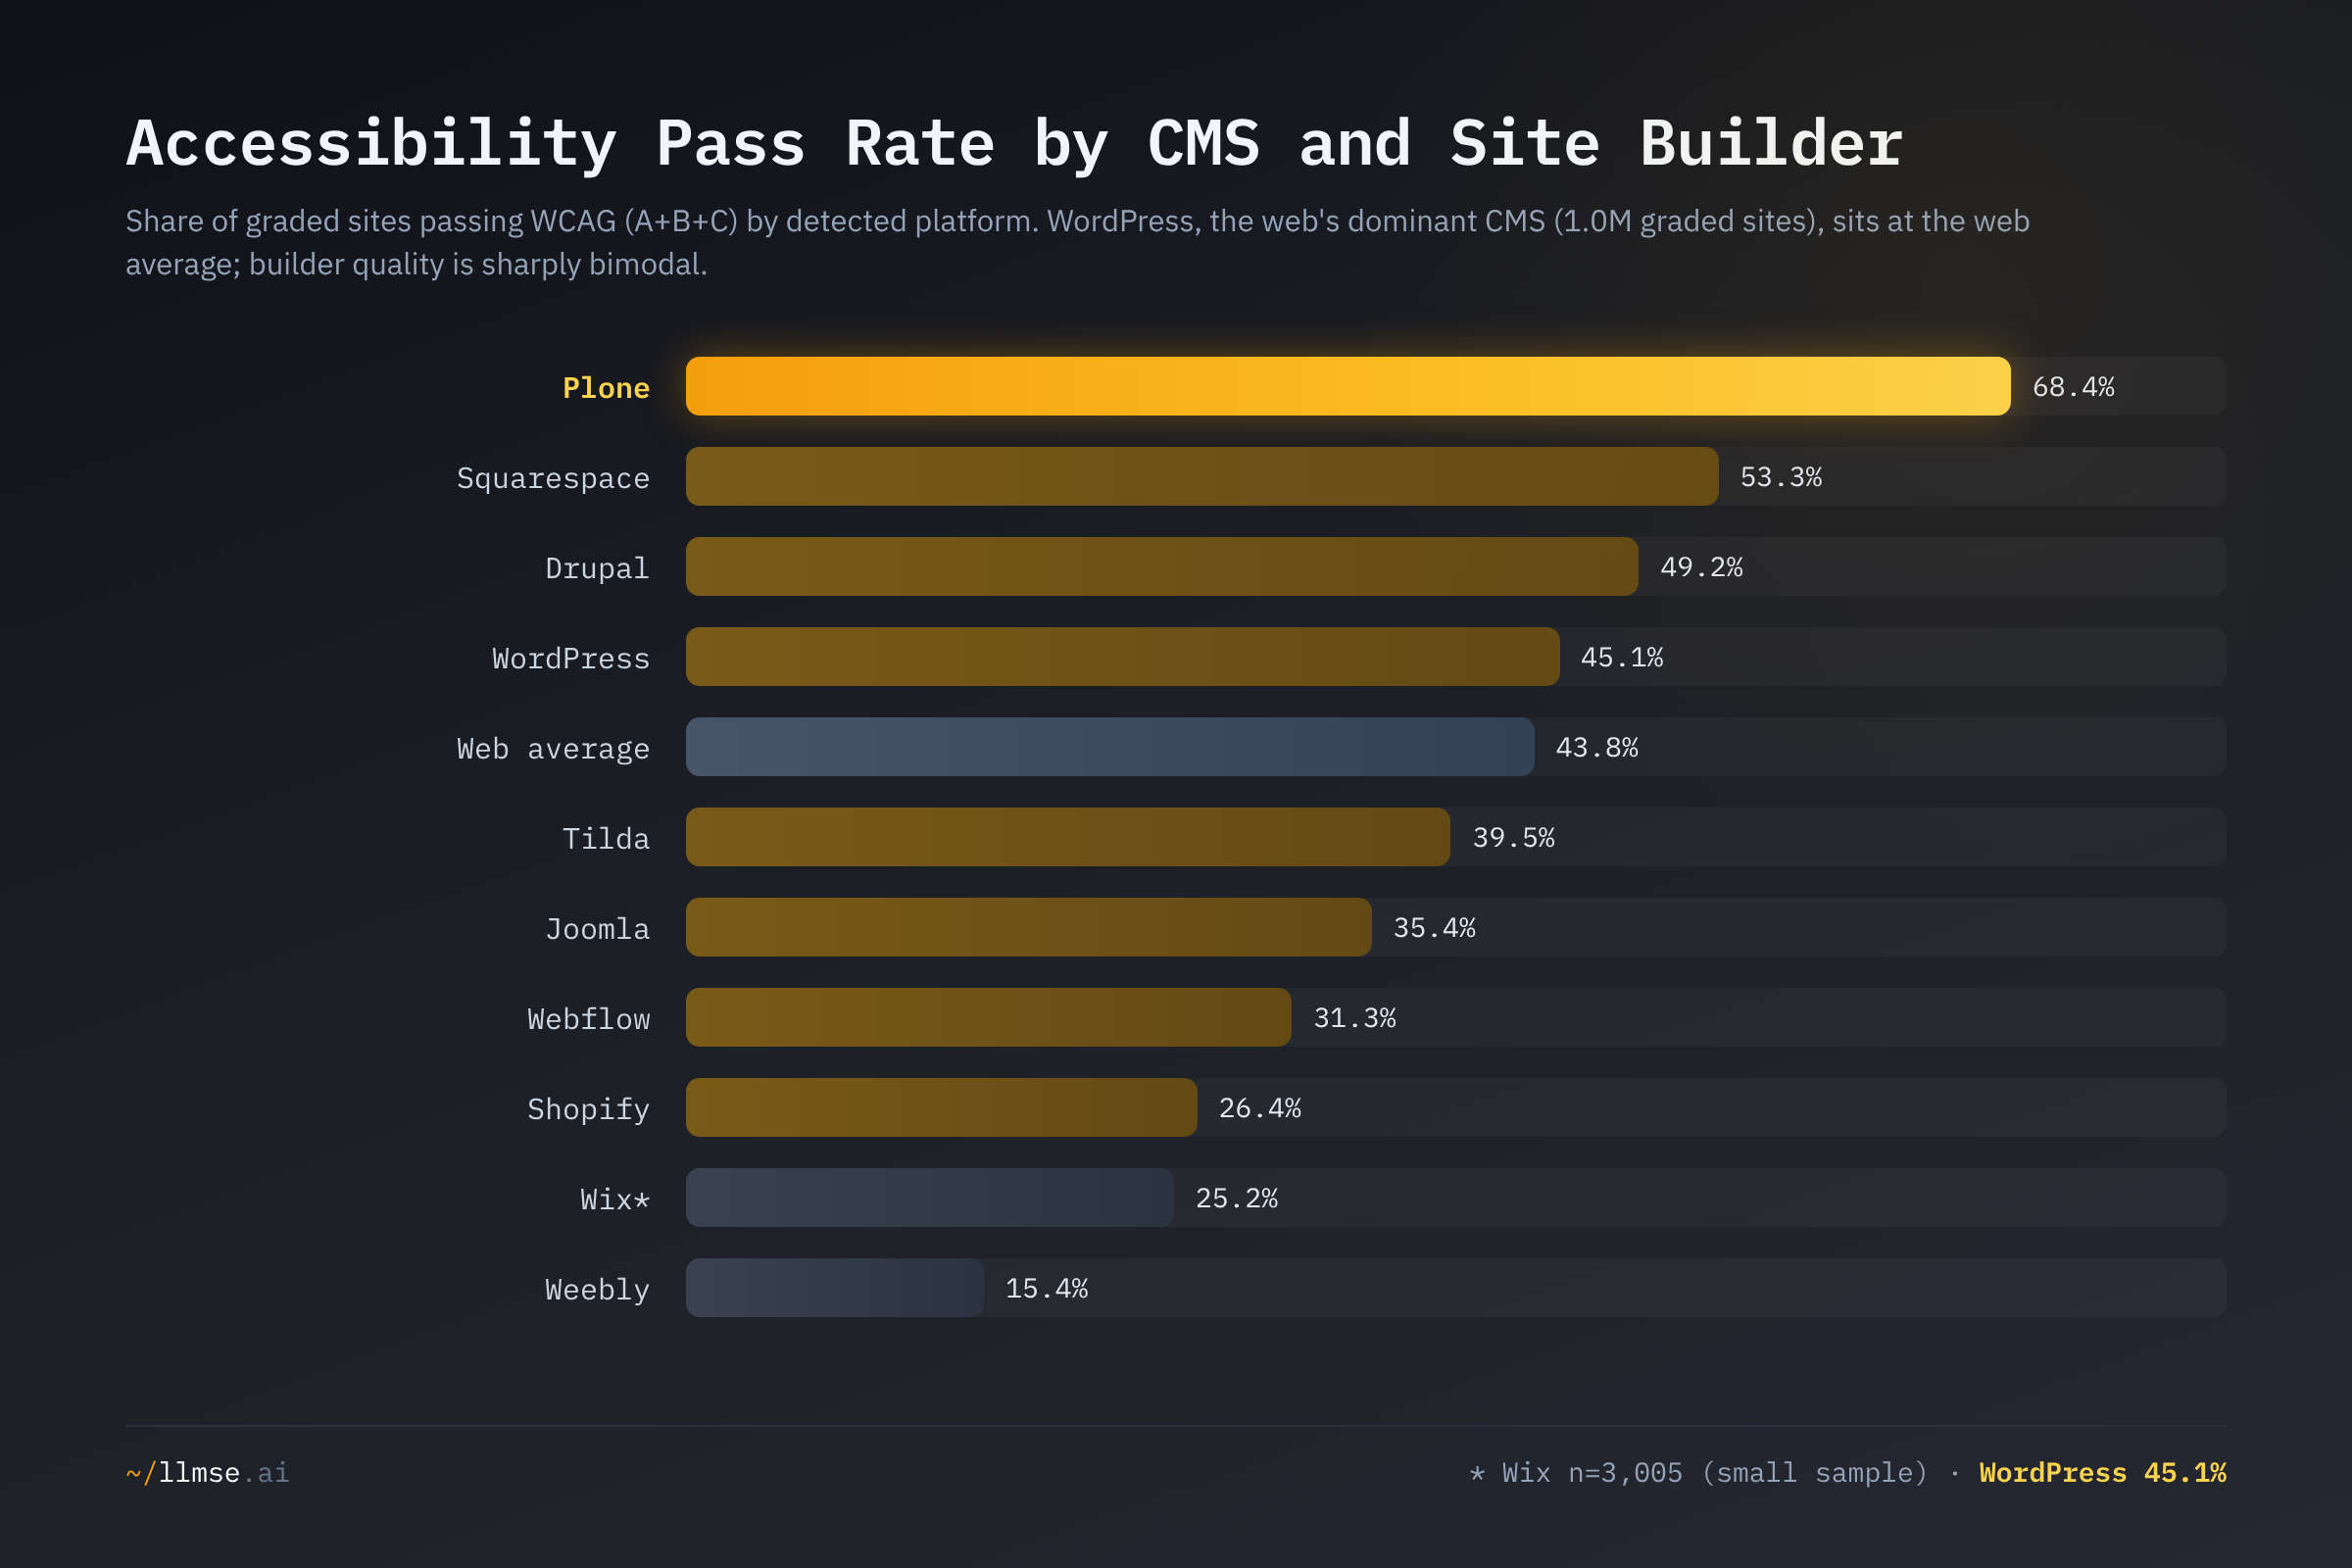
The "site builders are bad for accessibility" assumption is wrong — builder quality is sharply bimodal, and the platform's defaults drive the outcome. At the top, Plone (68.4%) — a CMS used heavily by governments, universities, and large enterprises that face accessibility mandates — produces the most accessible sites by a wide margin, consistent with both its audience and its accessibility-focused defaults. Squarespace (53.3%) is the standout among consumer builders: its small set of opinionated, professionally designed templates ship semantic structure and accessible defaults that most users never override. At the bottom, Weebly (15.4%), Wix (25.2%, small sample), and Shopify (26.4%) drag their users down — Shopify's result is the platform-level counterpart to Shopping's last-place category finish.
The most consequential row is the largest. WordPress powers more graded sites than every other CMS and builder here combined — 1,047,962 of them — and passes at 45.1%, essentially the web average. A platform that builds roughly a third of the graded web neither helps nor hurts accessibility on aggregate: its sprawling theme-and-plugin ecosystem is too heterogeneous to impose a standard, so a WordPress site's accessibility is decided downstream by its theme and its builder, not by the platform. The takeaway is structural: for most of the web, accessibility is inherited from a platform default, not engineered per site. That is the bad news (a poor default condemns millions of sites) and the opportunity (fixing a default fixes them all at once).
What's at Stake
- The legal floor is rising while the web sits below it. The EU's European Accessibility Act became enforceable on 28 June 2025, requiring WCAG 2.1 Level AA (via EN 301 549) for digital products and services sold into the EU, with penalties reaching €100,000 or a share of revenue. In the US, the DOJ's 2024 ADA Title II rule mandates WCAG 2.1 Level AA for state and local government sites on a phased timeline. With 38.0% of the web failing even the automatable Level A floor — a lower bar than Level AA — the compliance gap is enormous, and these analyses cover only the ~30-40% of criteria a machine can check.
- Litigation concentrates exactly where the data is worst. UsableNet recorded over 4,000 US digital-accessibility lawsuits in 2024, and the most-targeted vertical was apparel/retail (~35% of cases). That is the same Shopping category sitting last on the board at 30.6% pass and 55.2% outright-F. The sector with the most accessibility exposure is also the sector building the least accessible pages.
- 1 in 6 people are affected, and the failures are basic. The WHO estimates 1.3 billion people — 16% of the world — live with significant disability. The errors blocking them are not exotic: missing alt text, unlabeled buttons, empty links. The WebAIM Million confirms six error types account for 96% of all failures, and they have been the same for five years running.
- Platform defaults set the ceiling for millions of sites at once. Because most site owners inherit accessibility from a CMS or builder default, the 50-point gap between Plone/Squarespace and Weebly is a leverage point. A single change to a dominant platform's default theme moves more sites than any number of individual audits.
What Would Help
- E-commerce teams: treat accessibility as liability management, not courtesy. Shopping is last on the board (30.6%, majority-F) and first in the courtroom (the most-sued vertical). Label every add-to-cart and icon button, add alt text to product images, and make filters keyboard-navigable. Audit your storefront at llmse.ai/classify before a plaintiff does.
- Site owners on hosted builders: your platform choice is an accessibility decision. The 50-point spread between Squarespace (53.3%) and Weebly (15.4%) means the builder you pick can pass or fail you before you write a line of content. If you are on a low-scoring platform, the cheapest fix is often switching templates to one with accessible defaults — or switching platforms.
- Platform and CMS vendors: fix the default and you fix millions of sites. WordPress's 1.0M graded sites pass at exactly the web average because the ecosystem imposes no standard. Ship accessible default themes, warn on missing alt text and labels in the editor, and block accessibility-breaking patterns (suppressed viewport zoom, empty links) at the template level.
- Developers: target the six errors that cause 96% of failures. Per the WebAIM Million, low contrast, missing alt text, missing form labels, empty links, empty buttons, and missing document language account for nearly all detected errors. A checklist covering those six closes most of the automatable gap; run LLMSE's free WCAG analyzer to find them.
- Compliance and accessibility teams: remember automated checks are the floor, not the ceiling. A passing LLMSE grade clears ~30-40% of WCAG 2.1 Level A; full conformance — and the AA standard the EAA and ADA Title II rule demand — requires manual testing for contrast, keyboard operability, and screen-reader behavior. Use the automated grade to triage, then test the rest by hand.
Explore the Data
- WCAG accessibility analyzer — grade any URL against the same automated checks used here.
- Comprehensive site audit — WCAG alongside SEO, E-E-A-T, AEO, readability, privacy, and brand safety.
- The Cross-Industry Quality Report Card — how WCAG fits alongside the other five quality dimensions, sector by sector.
This analysis was conducted using LLMSE, which has classified over 3.4 million websites across SEO, EEAT, AEO, WCAG accessibility, readability, GARM brand safety, and privacy dimensions. WCAG figures reflect the 3,341,238 sites carrying a WCAG grade in the index as of June 2026. To analyze your own site across every dimension in this post, visit llmse.ai/classify.