The State of Website SEO 2026: 94% of the Web Scores F, and 1.9% Passes
Update — 2026-06-29: Refreshed against LLMSE's current index of 3.4 million classified URLs (up from 775,717 SEO-graded sites at first publication). The original made its case with a hand-scored table of 30 famous brands; that curated sample is not reproducible at scale, so it has been dropped and the post rebuilt around the aggregate grade distribution and segment breakdowns by industry, CMS, and web server. The numbers shifted slightly as coverage broadened — web SEO pass rate 2.1%→1.9%, grade F 93.8%→94.4% — and the thesis holds and hardens: the web is overwhelmingly unoptimized for search, and the failure is structural.
Most of the web is not optimized for search engines, and it is not close. The conventional read is that SEO is the province of a small professional class who do it well while everyone else neglects it — a skill gap, fixable with effort. The aggregate data says the neglect is nearly universal.
We built LLMSE's SEO analyzer to answer one question at scale: how well is the web actually optimized for search? The analyzer runs 80-plus on-page checks — title and meta quality, heading structure, canonicals, structured data, image optimization, render-blocking resources, accessibility and security signals — and scores each page on a deduction model from 100, then assigns an A-F grade. We have now graded 3,362,327 websites on technical SEO using that single automated pipeline, applied uniformly across the index rather than to a hand-picked list of flagship brands.
The result is not a long tail of mediocrity. It is a wall. Just 1.9% of websites pass a baseline technical-SEO check (grade A, B, or C), 94.4% score an outright F, and only 0.43% earn an A or B. The passing population — clean fundamentals, crawlable structure, the basics search engines reward — is a rounding error.
That headline is uniform, but the web underneath it is not. When the same grade is cross-referenced against content category, CMS, and web server, the pass rate moves by an order of magnitude: gambling sites pass at 12.1% while reference pages pass at 0.2%, sites on Vercel pass at 6.3% while sites on nginx pass at 1.3%, and static-site generators clear the bar four to five times more often than drag-and-drop builders. The aggregate failure is real; so is the structure beneath it.
The Data
Every grade below comes from LLMSE's automated SEO analyzer applied to each indexed URL. The web-wide grade distribution is the foundation for the entire post:
| Grade | Score range | Sites | Share |
|---|---|---|---|
| A (excellent) | 90-100 | 1,078 | 0.03% |
| B (good) | 80-89 | 13,262 | 0.39% |
| C (average) | 70-79 | 50,471 | 1.50% |
| D (below average) | 60-69 | 121,798 | 3.62% |
| F (failing) | 0-59 | 3,175,718 | 94.45% |
| Total graded | — | 3,362,327 | 100% |
Pass — defined as A+B+C — covers 64,811 sites, or 1.9%. The category, CMS, and server breakdowns later in the post are computed over the populations actually carrying both an SEO grade and the relevant segment tag, so their denominators differ from the 3.36M total and from each other. Two large but structurally atypical buckets — "Sensitive Topics" (145,632 graded, 0.2% pass) and "Reference" (44,667 graded, 0.2% pass) — are thin, templated listing pages that sit at the absolute floor; we name them but treat them as outliers rather than industries. Russian-language sites are excluded from every aggregate.
Methodology
This post makes quantitative claims across the full index, so the definitions and limits matter.
- Grades and "pass." Each site is graded A-F by the SEO analyzer; there is no E grade. The analyzer starts every page at 100 and deducts per issue found — roughly -15 for a critical issue (missing title, missing meta description, missing viewport), -5 for a warning (render-blocking resources, missing image dimensions, duplicate IDs), and -1 for informational gaps (no Open Graph tags, no structured data) — across 80-plus checks. "Pass" means A+B+C (a score of 70 or above). The model is strict by design: it is cumulative, so a page can have a perfectly good title and still fail on the weight of a dozen small, well-documented gaps.
- Presence is not quality. External crawls that measure whether an element exists report far higher numbers than a quality grade does. The HTTP Archive's Web Almanac 2024 SEO chapter finds a
<title>element on 98% of pages but a meta description on only 66.7% and an<h1>on about 70%, with a median of just 58.3% of images carrying alt text. LLMSE's grade does not stop at "is the tag present" — it scores the cumulative quality across all 80-plus checks, which is why a 1.9% pass rate coexists with near-universal title adoption. - Cross-references are computed as set intersections (Redis
ZINTERCARD) between the SEO grade indices (seo-A…seo-F) and a category, CMS (app-*), or server (server-*) index. All counts are aggregate; no individual site is identified. - Classification basis. Category membership is by LLM classification; CMS and server are detected from response headers and page fingerprints (388-plus technologies, 125 server types). Detection is imperfect — a CDN or reverse proxy in front of an origin server can mask or relabel the backend — so server figures describe the edge a crawler sees.
- Known limits. Pass rates are over graded populations, which are smaller than raw segment sizes. The SEO grade reflects the initial HTML response, mirroring how a crawler first encounters a page (modern crawlers render JavaScript in a second pass). Counts are a live snapshot and drift as classification continues. Small segments (flagged below ~10,000 graded sites) carry wider error bars.
- Why these numbers differ from the 2026-02 original. The graded population grew from 775,717 to 3,362,327 SEO-graded URLs. The early sample skewed toward more-visible, higher-quality sites, so the absolute pass rate fell as coverage broadened into the long tail — web SEO pass 2.1%→1.9%, grade F 93.8%→94.4%. The original's central exhibit, a hand-scored table of 30 major brands ("0 of 30 passed; usa.gov best at 70"), was a curated sample that cannot be reproduced or audited read-only against the index. It has been removed and replaced with the reproducible aggregate breakdowns below.
The Scorecard
The grade distribution is not a bell curve with a long tail. It is one enormous failing bar and four slivers.
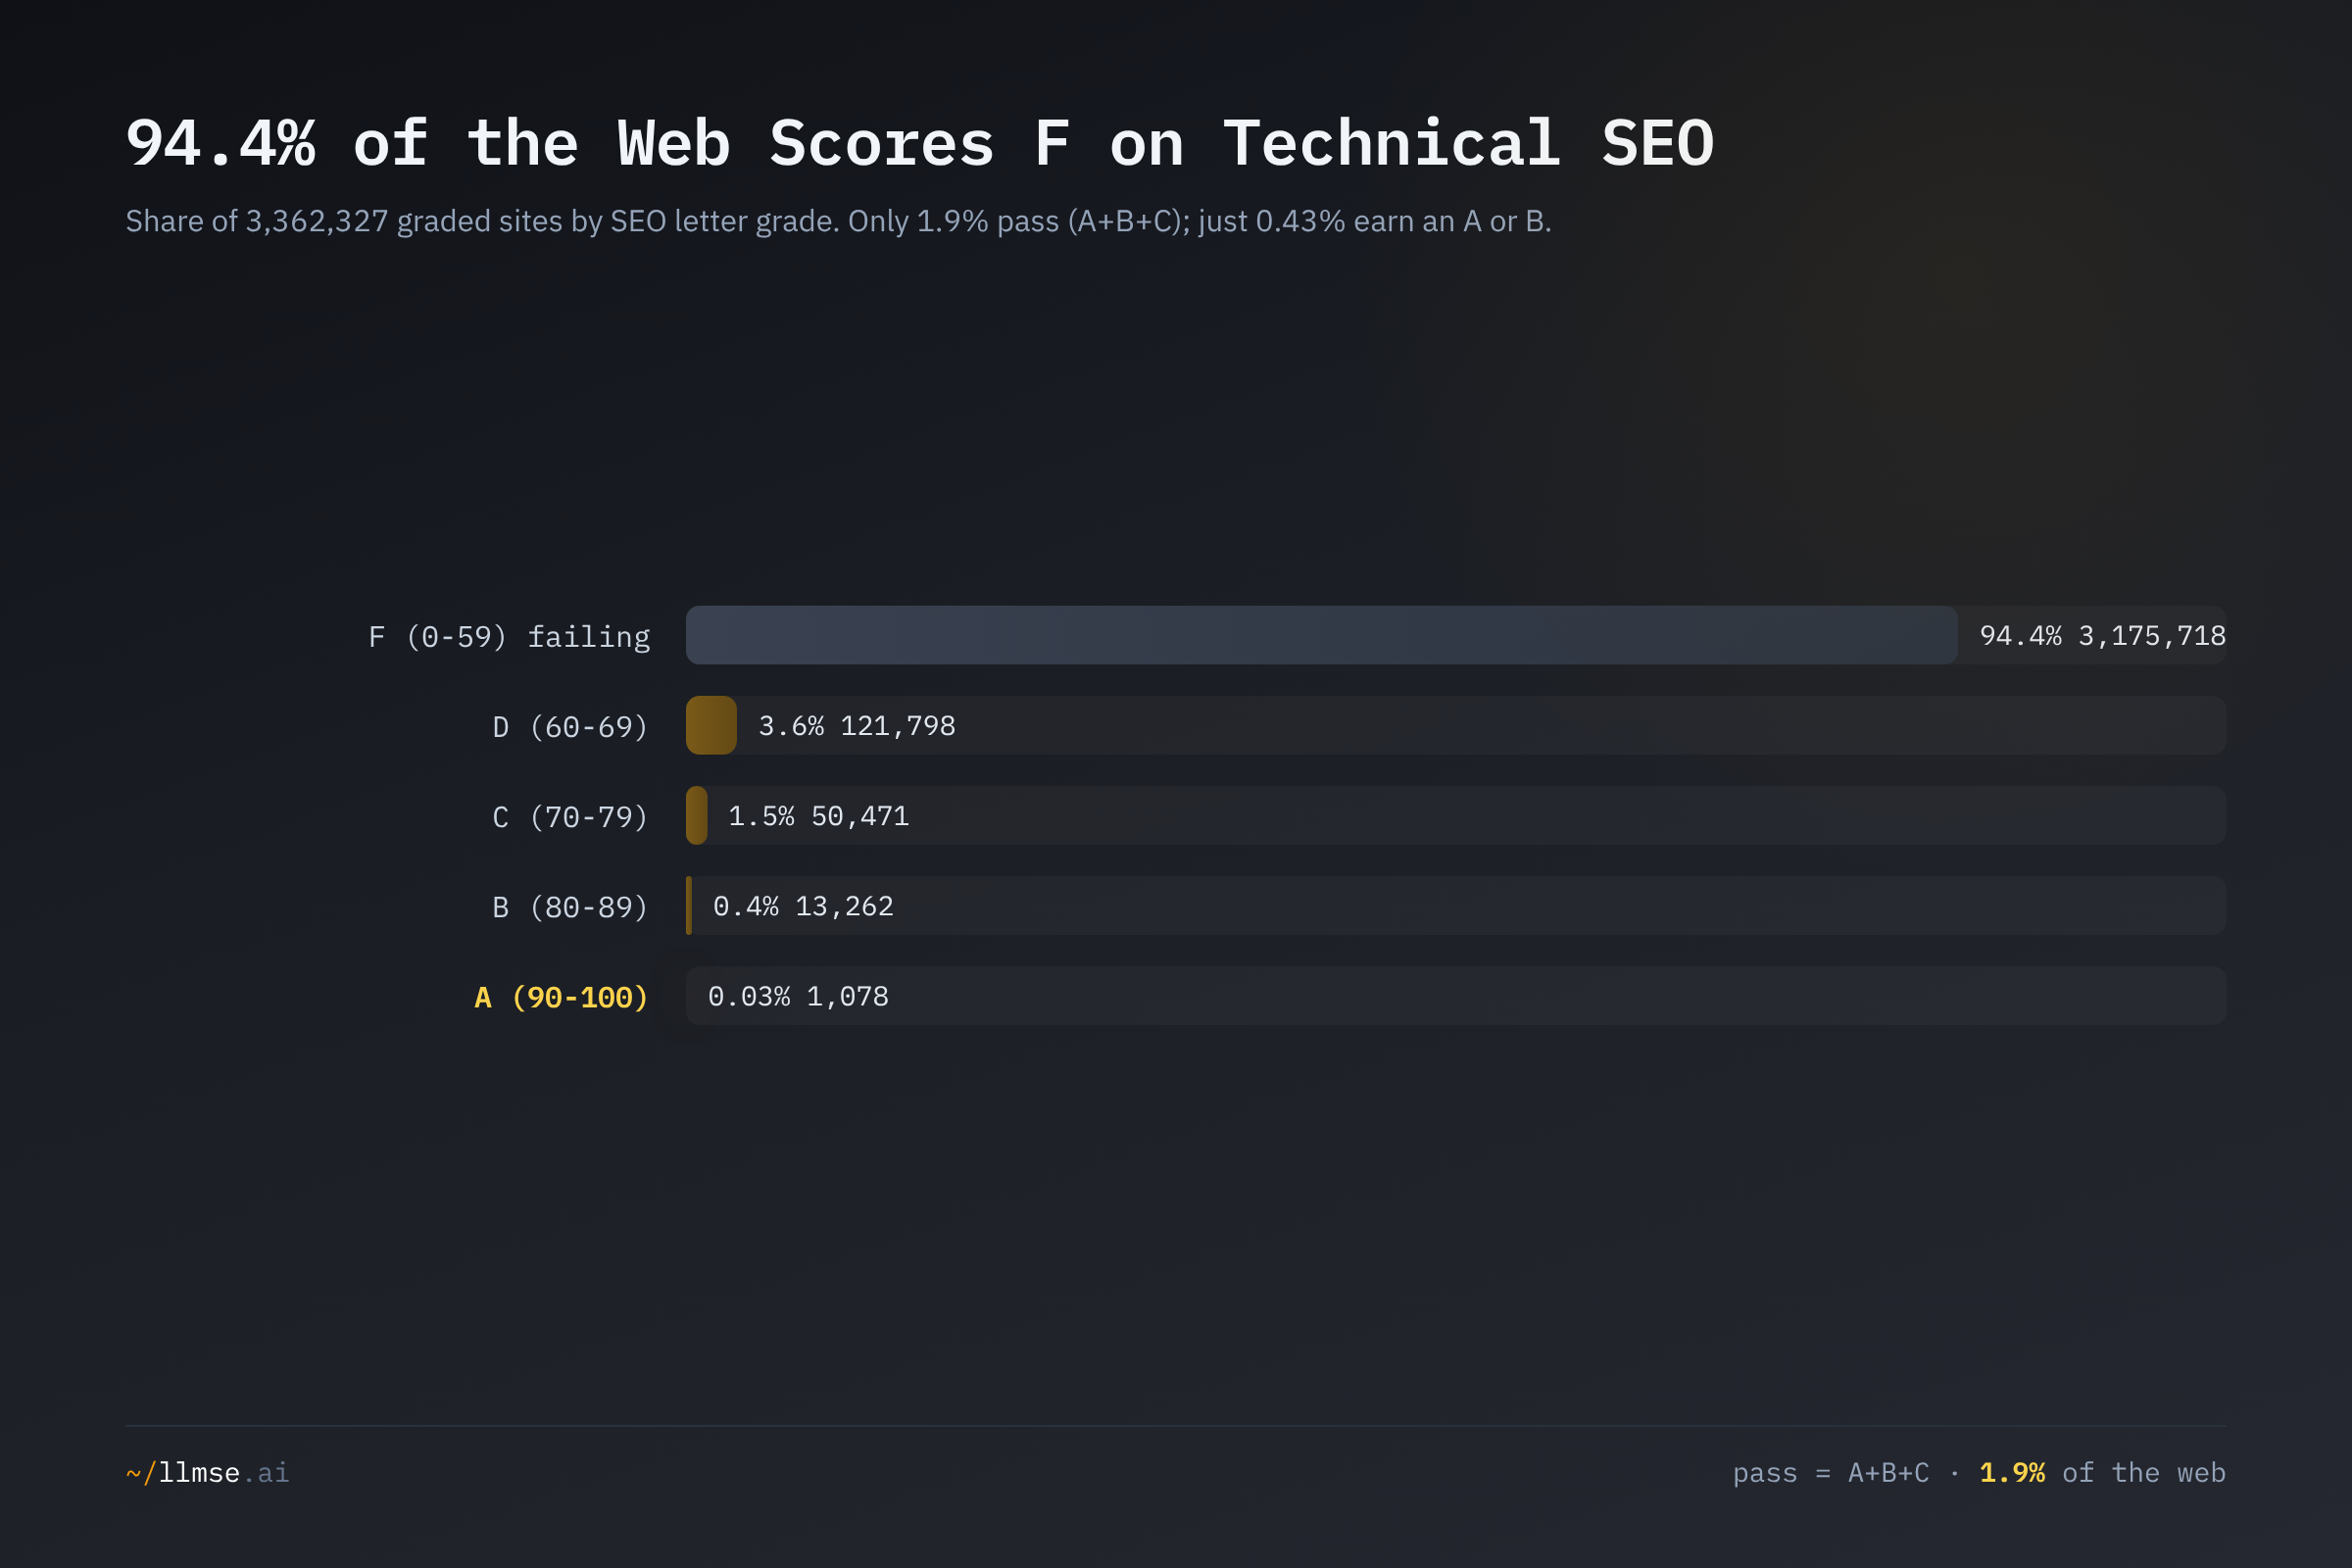
Grade F alone accounts for 94.45% of the graded web; the entire passing tier — A, B, and C combined — is 1.9%, and the "excellent" A grade is held by 1,078 sites, or three in every ten thousand. This is the central finding, and it survives the dataset more than quadrupling in size. It is also corroborated from the demand side: Ahrefs' study of roughly 14 billion pages found that 96.55% get zero organic traffic from Google. Two independent vantage points — supply-side technical quality and demand-side traffic — converge on the same conclusion: the overwhelming majority of the web is invisible to search.
Google is explicit that none of this is a guarantee. Its SEO Starter Guide states plainly that "there are no secrets here that'll automatically rank your site first," and that even technically sound pages are only "more likely" to be surfaced. But the fundamentals the guide describes — clear titles and descriptions, crawlable structure, organized headings, valid structured data — are precisely what the 1.9% have and the 94% lack. The bar to clear is documented and free; almost no one clears it. The reasons are structural, not exotic, and the segments below show that where a site is built changes the odds dramatically.
The Failure Is Structural, Not Exotic
The 94% failure rate invites a dramatic explanation, but the data points to mundane, cumulative causes rather than catastrophic ones. Three structural factors dominate.
The deduction model is cumulative, and the gaps are common. A site loses points for each of dozens of small, well-documented issues, and most sites carry many of them at once. The Web Almanac's per-element figures make the arithmetic concrete: with a third of pages missing a meta description, roughly 30% missing an <h1>, and a median of 42% of images lacking alt text, the typical page accumulates enough deductions across the 80-plus checks to fall below 70 without any single dramatic failure. Most F-grade sites work perfectly well for human users — they simply leave optimization on the table that, summed, fails the grade.
JavaScript-rendered shells hide content from the first crawl. A growing share of sites render their content client-side, so the initial HTML a crawler parses is a near-empty scaffold — triggering thin-content, missing-heading, and low-word-count penalties even when the rendered page is rich. This is most acute exactly where modern frameworks dominate, which is part of why the platform a site is built on is such a strong predictor of its grade.
Performance and structured-data checks are unforgiving and rarely satisfied. Render-blocking CSS, missing image dimensions that cause layout shift, and absent JSON-LD are penalized on most sites because most sites genuinely ship them. The Web Almanac reports only 48% of mobile sites passing Core Web Vitals on real-user data — and LLMSE's static performance hints flag the same patterns at the HTML level. These are not edge cases; they are the default state of the web.
The opportunity hidden in this is the inverse of the alarm: because Google's own guidance treats these as fundamentals rather than advanced tactics, the gap is closable with known, cheap fixes. With 99.6% of sites below an A or B, any site that gets the basics right moves into a tiny minority.
Discovery by Industry: Gambling Runs Off the Chart
Pass rates are not uniform across content categories. Cross-referencing the SEO grade against all 58 LLMSE categories (those with 10,000+ graded sites shown) produces a leaderboard with one bar that runs clean off the chart.
| Category | Sites graded | SEO pass |
|---|---|---|
| Gambling | 74,455 | 12.1% |
| Adult | 36,751 | 5.4% |
| Finance | 18,191 | 3.9% |
| Career | 10,057 | 3.3% |
| Family & Relationships | 25,373 | 3.2% |
| Law & Government | 19,294 | 3.0% |
| Games | 44,239 | 3.0% |
| Health | 76,569 | 2.8% |
| Food & Drink | 42,898 | 2.8% |
| Sports | 36,963 | 2.5% |
| Business & Industry | 1,022,197 | 2.0% |
| Web average | 3,362,327 | 1.9% |
| Computer & Electronics | 400,574 | 1.0% |
| Shopping | 41,342 | 1.0% |
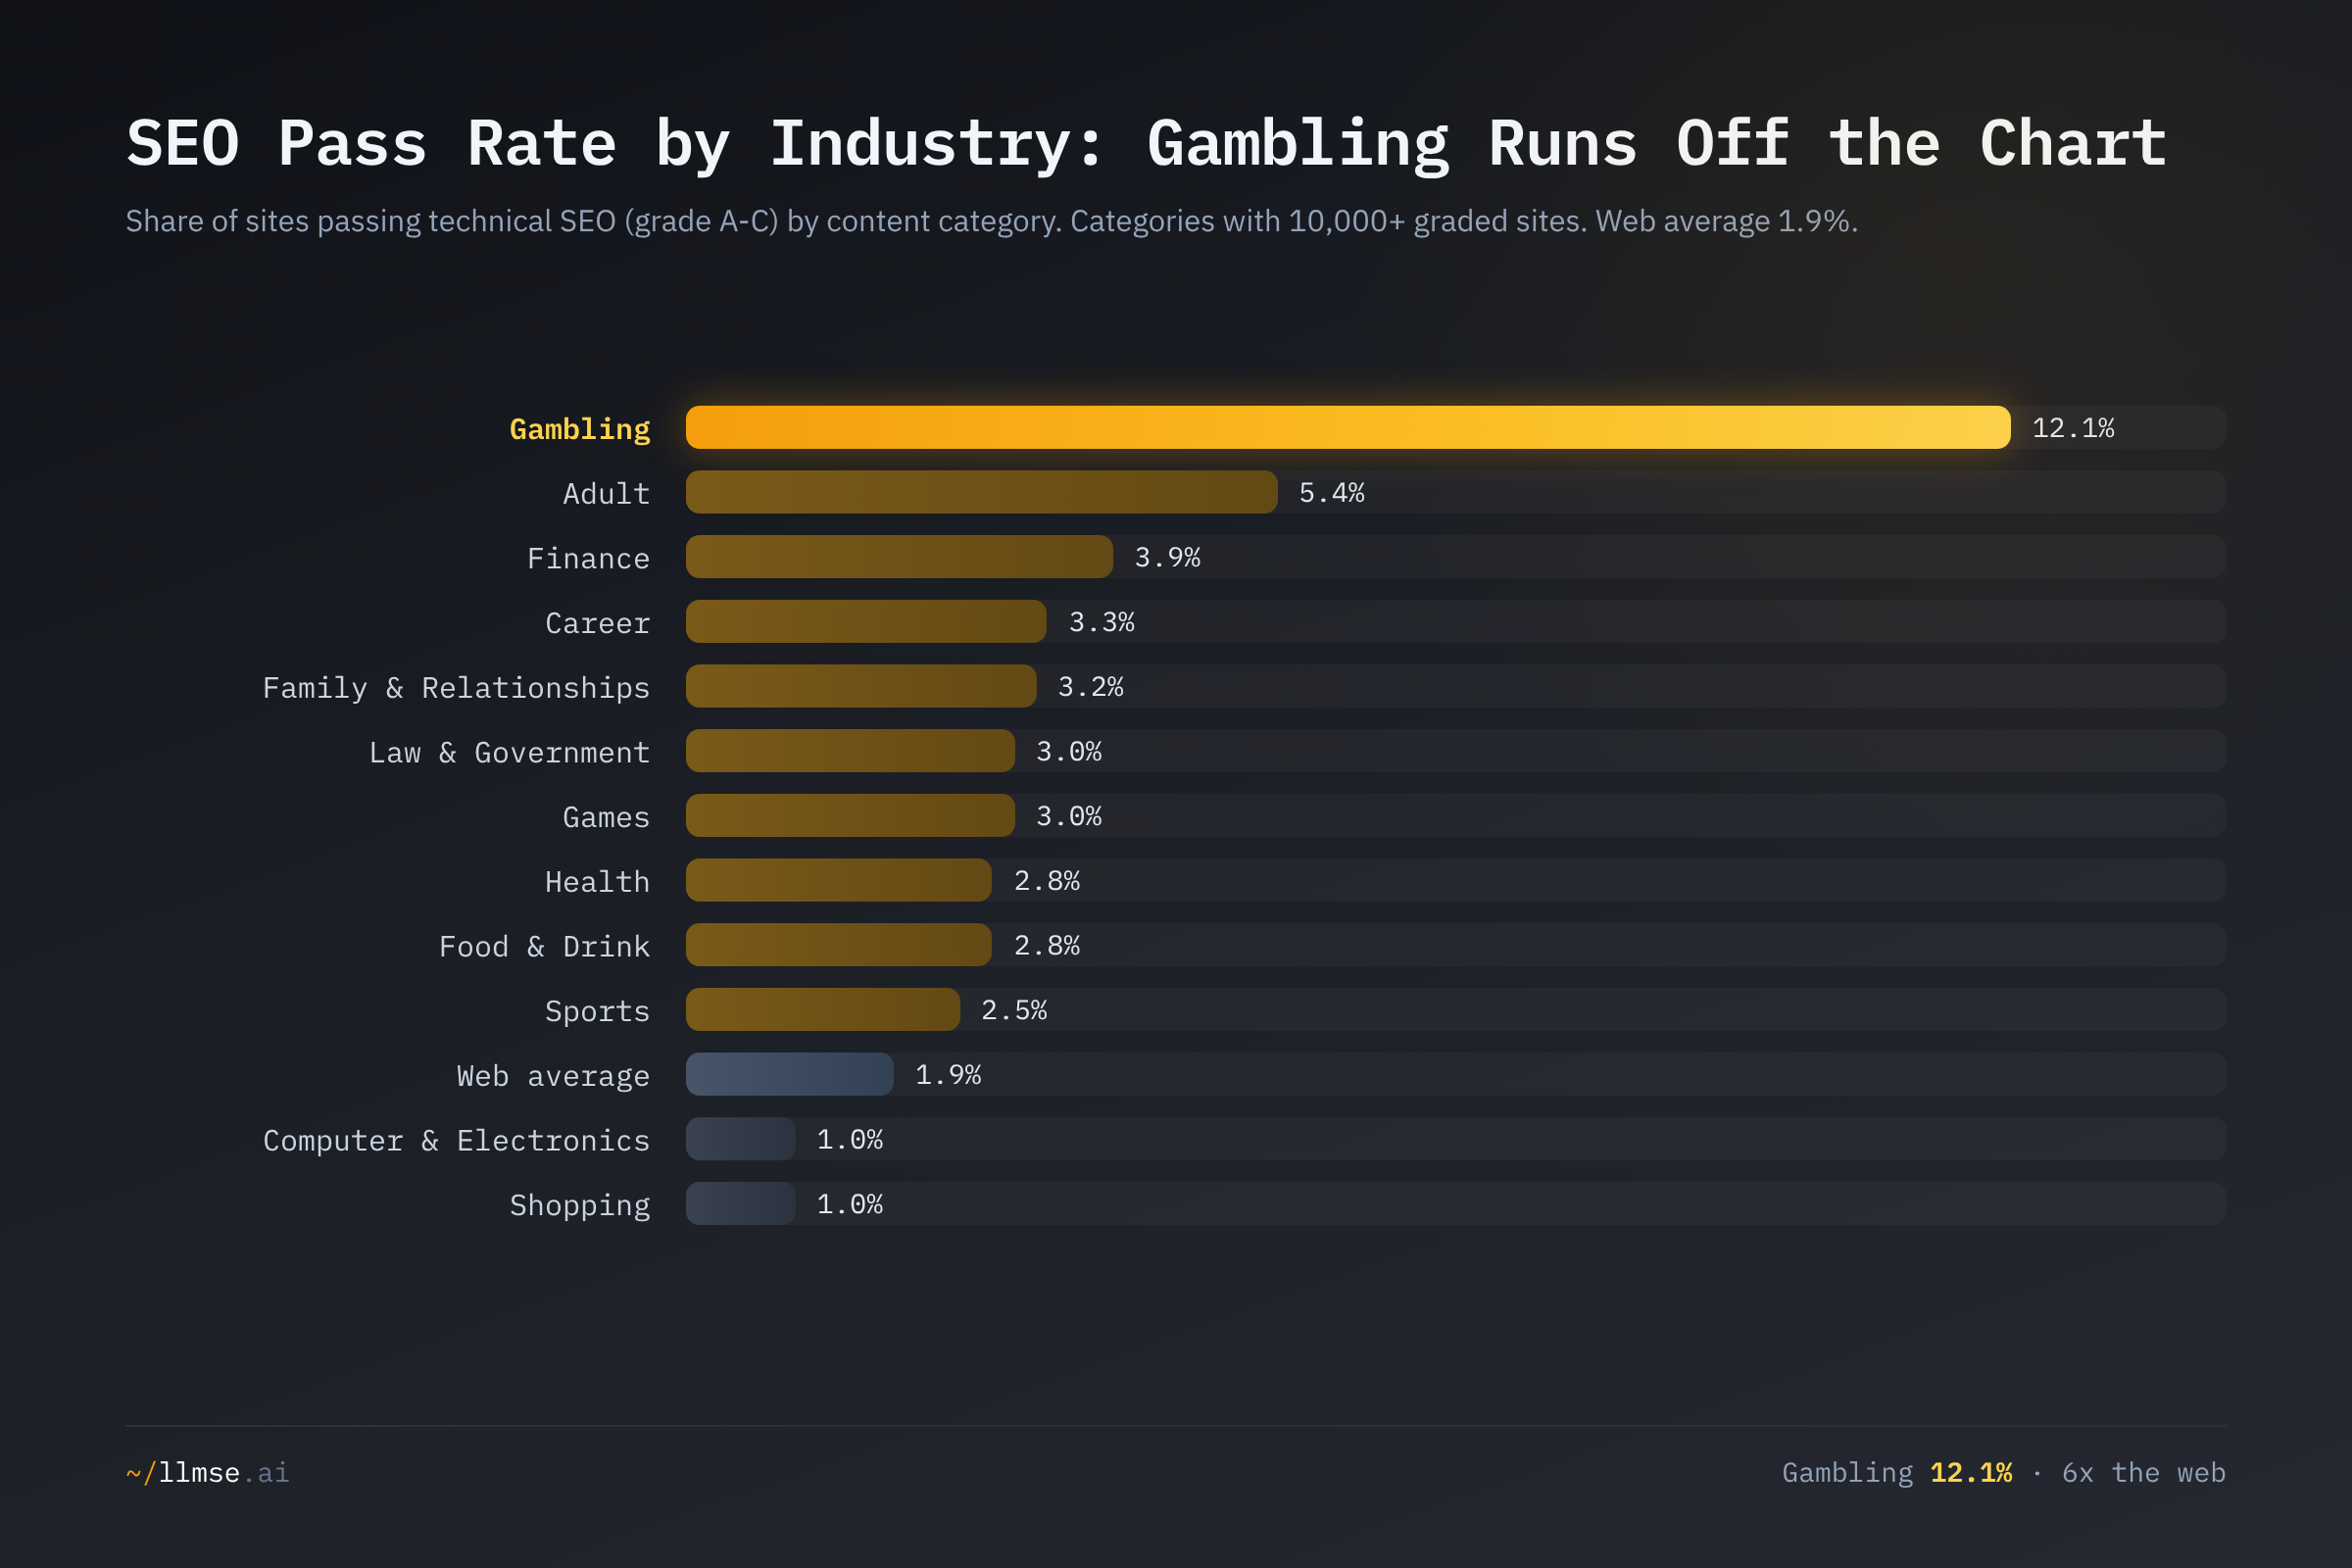
Gambling passes technical SEO at 12.1% — more than double the runner-up (Adult, 5.4%) and over six times the web average. Beneath it sits a tight pack of regulated, high-value verticals where search visibility converts directly to revenue or access: Finance (3.9%), Career (3.3%), Law & Government (3.0%), Health (2.8%). The pattern is consistent with a simple incentive: where ranking is worth money and paid channels are restricted or expensive, organic optimization stops being optional. Gambling is the extreme case — its paid and programmatic channels are heavily restricted, so it engineers its way to visibility instead, a dynamic we detail in The House Always Optimizes.
The sectors that build and sell on the web are among the worst: Computer & Electronics and Shopping both pass at just 1.0%, roughly half the web average. Developer documentation, project pages, and forums are written for humans arriving via links, not optimized for crawlers; e-commerce homepages are JavaScript-heavy and tuned for conversion over crawlable structure. The discovery leaders are the verticals that must be found; the laggards are the ones that assume they already are. (For the same categories ranked across trust, accessibility, readability, and privacy, see the Cross-Industry Quality Report Card.)
The Platform Divide: Static Generators Beat Drag-and-Drop Builders
What a site is built with predicts its SEO grade more sharply than almost any other signal. Cross-referencing the grade against detected CMS and framework tags separates the field into clear tiers.
| Platform | Sites graded | SEO pass |
|---|---|---|
| Astro | 23,632 | 4.9% |
| TYPO3 | 21,448 | 4.8% |
| Jekyll | 17,628 | 4.8% |
| Next.js | 21,011 | 4.3% |
| Hugo | 12,010 | 4.1% |
| WordPress | 1,051,311 | 2.8% |
| Drupal | 35,113 | 2.6% |
| Tilda | 45,692 | 2.4% |
| Web average | 3,362,327 | 1.9% |
| Squarespace | 26,436 | 1.9% |
| Webflow | 13,292 | 1.4% |
| Shopify | 15,238 | 1.3% |
| Magento | 7,870 | 0.8% |
| Joomla | 28,094 | 0.4% |
| Weebly | 16,314 | 0.1% |
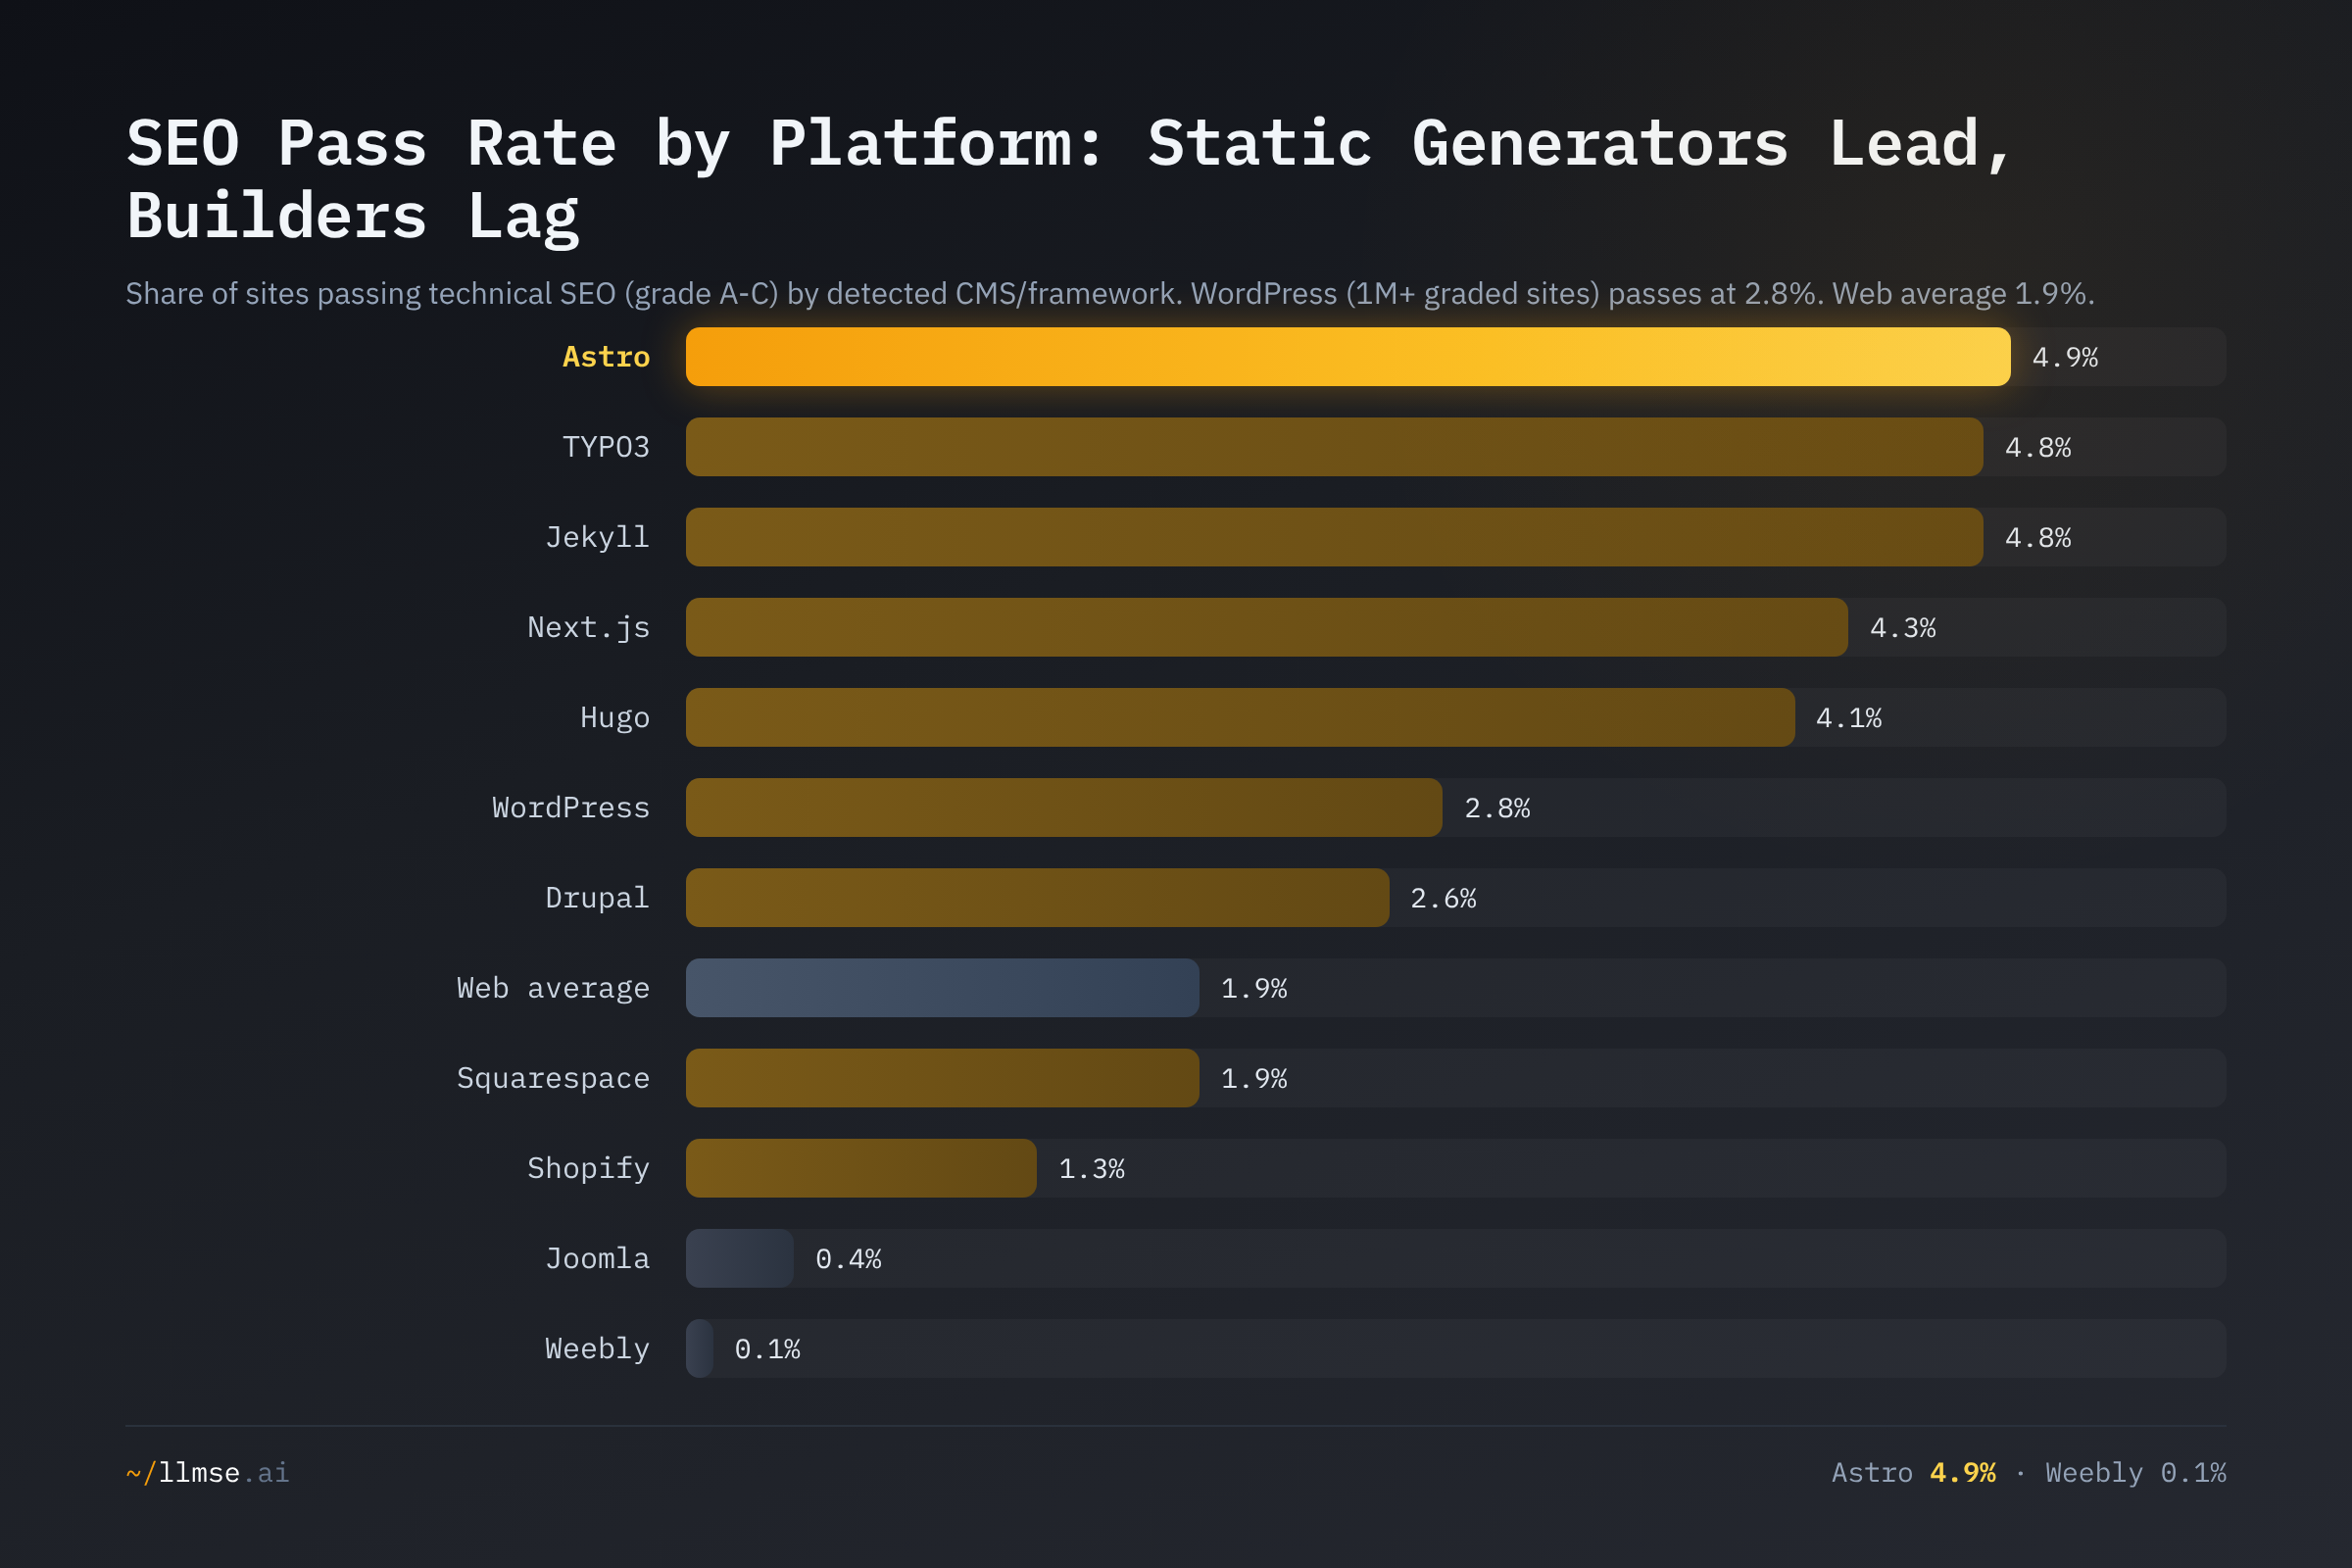
Static-site generators and modern frameworks dominate the top: Astro (4.9%), TYPO3 (4.8%), Jekyll (4.8%), Next.js (4.3%), and Hugo (4.1%) all pass at two to three times the web average. These tools emit lean, server-rendered HTML with clean structure and few render-blocking dependencies — exactly what the grade rewards. (The smaller Ghost population, 1,228 graded sites, posts the highest rate of all at 9.9%, but the sample is too thin to rank alongside the others.)
WordPress — the single most common platform on the web at over a million graded sites — passes at 2.8%, above the web average but well below the generators. That a plurality of the web runs on a CMS that clears the bar modestly is itself a large part of why the aggregate is so low: scale pulls the average toward WordPress's rate. The drag-and-drop and hosted-commerce tier sits at or below the floor: Squarespace (1.9%), Webflow (1.4%), Shopify (1.3%), Magento (0.8%), Joomla (0.4%), and Weebly (0.1%). Builders that prioritize visual editing and templated output tend to ship heavier, less crawler-friendly markup — a plausible explanation for the gap, consistent with the generators' lead, though platform choice correlates with the technical sophistication of the site owner and is not proof on its own.
The Server Tell: Modern Deploy Platforms Outrank the Incumbents
The same divide appears at the infrastructure layer. The servers that host most of the web cluster at the bottom of the SEO table; the modern deployment platforms that host a sliver sit at the top.
| Server | Sites graded | Market share | SEO pass |
|---|---|---|---|
| Vercel | 21,874 | <1% | 6.3% |
| Netlify | 17,062 | <1% | 5.4% |
| Cloudflare | 610,994 | 19.6% | 4.1% |
| Framer | 3,101 | <1% | 3.7% |
| GitHub Pages | 88,610 | 2.8% | 2.1% |
| Web average | 3,362,327 | — | 1.9% |
| LiteSpeed | 258,479 | 8.2% | 1.4% |
| nginx | 829,131 | 26.3% | 1.3% |
| Apache | 922,655 | 29.2% | 1.2% |
| IIS | 53,597 | 1.7% | 1.1% |
| OpenResty | 69,076 | 2.2% | 0.7% |
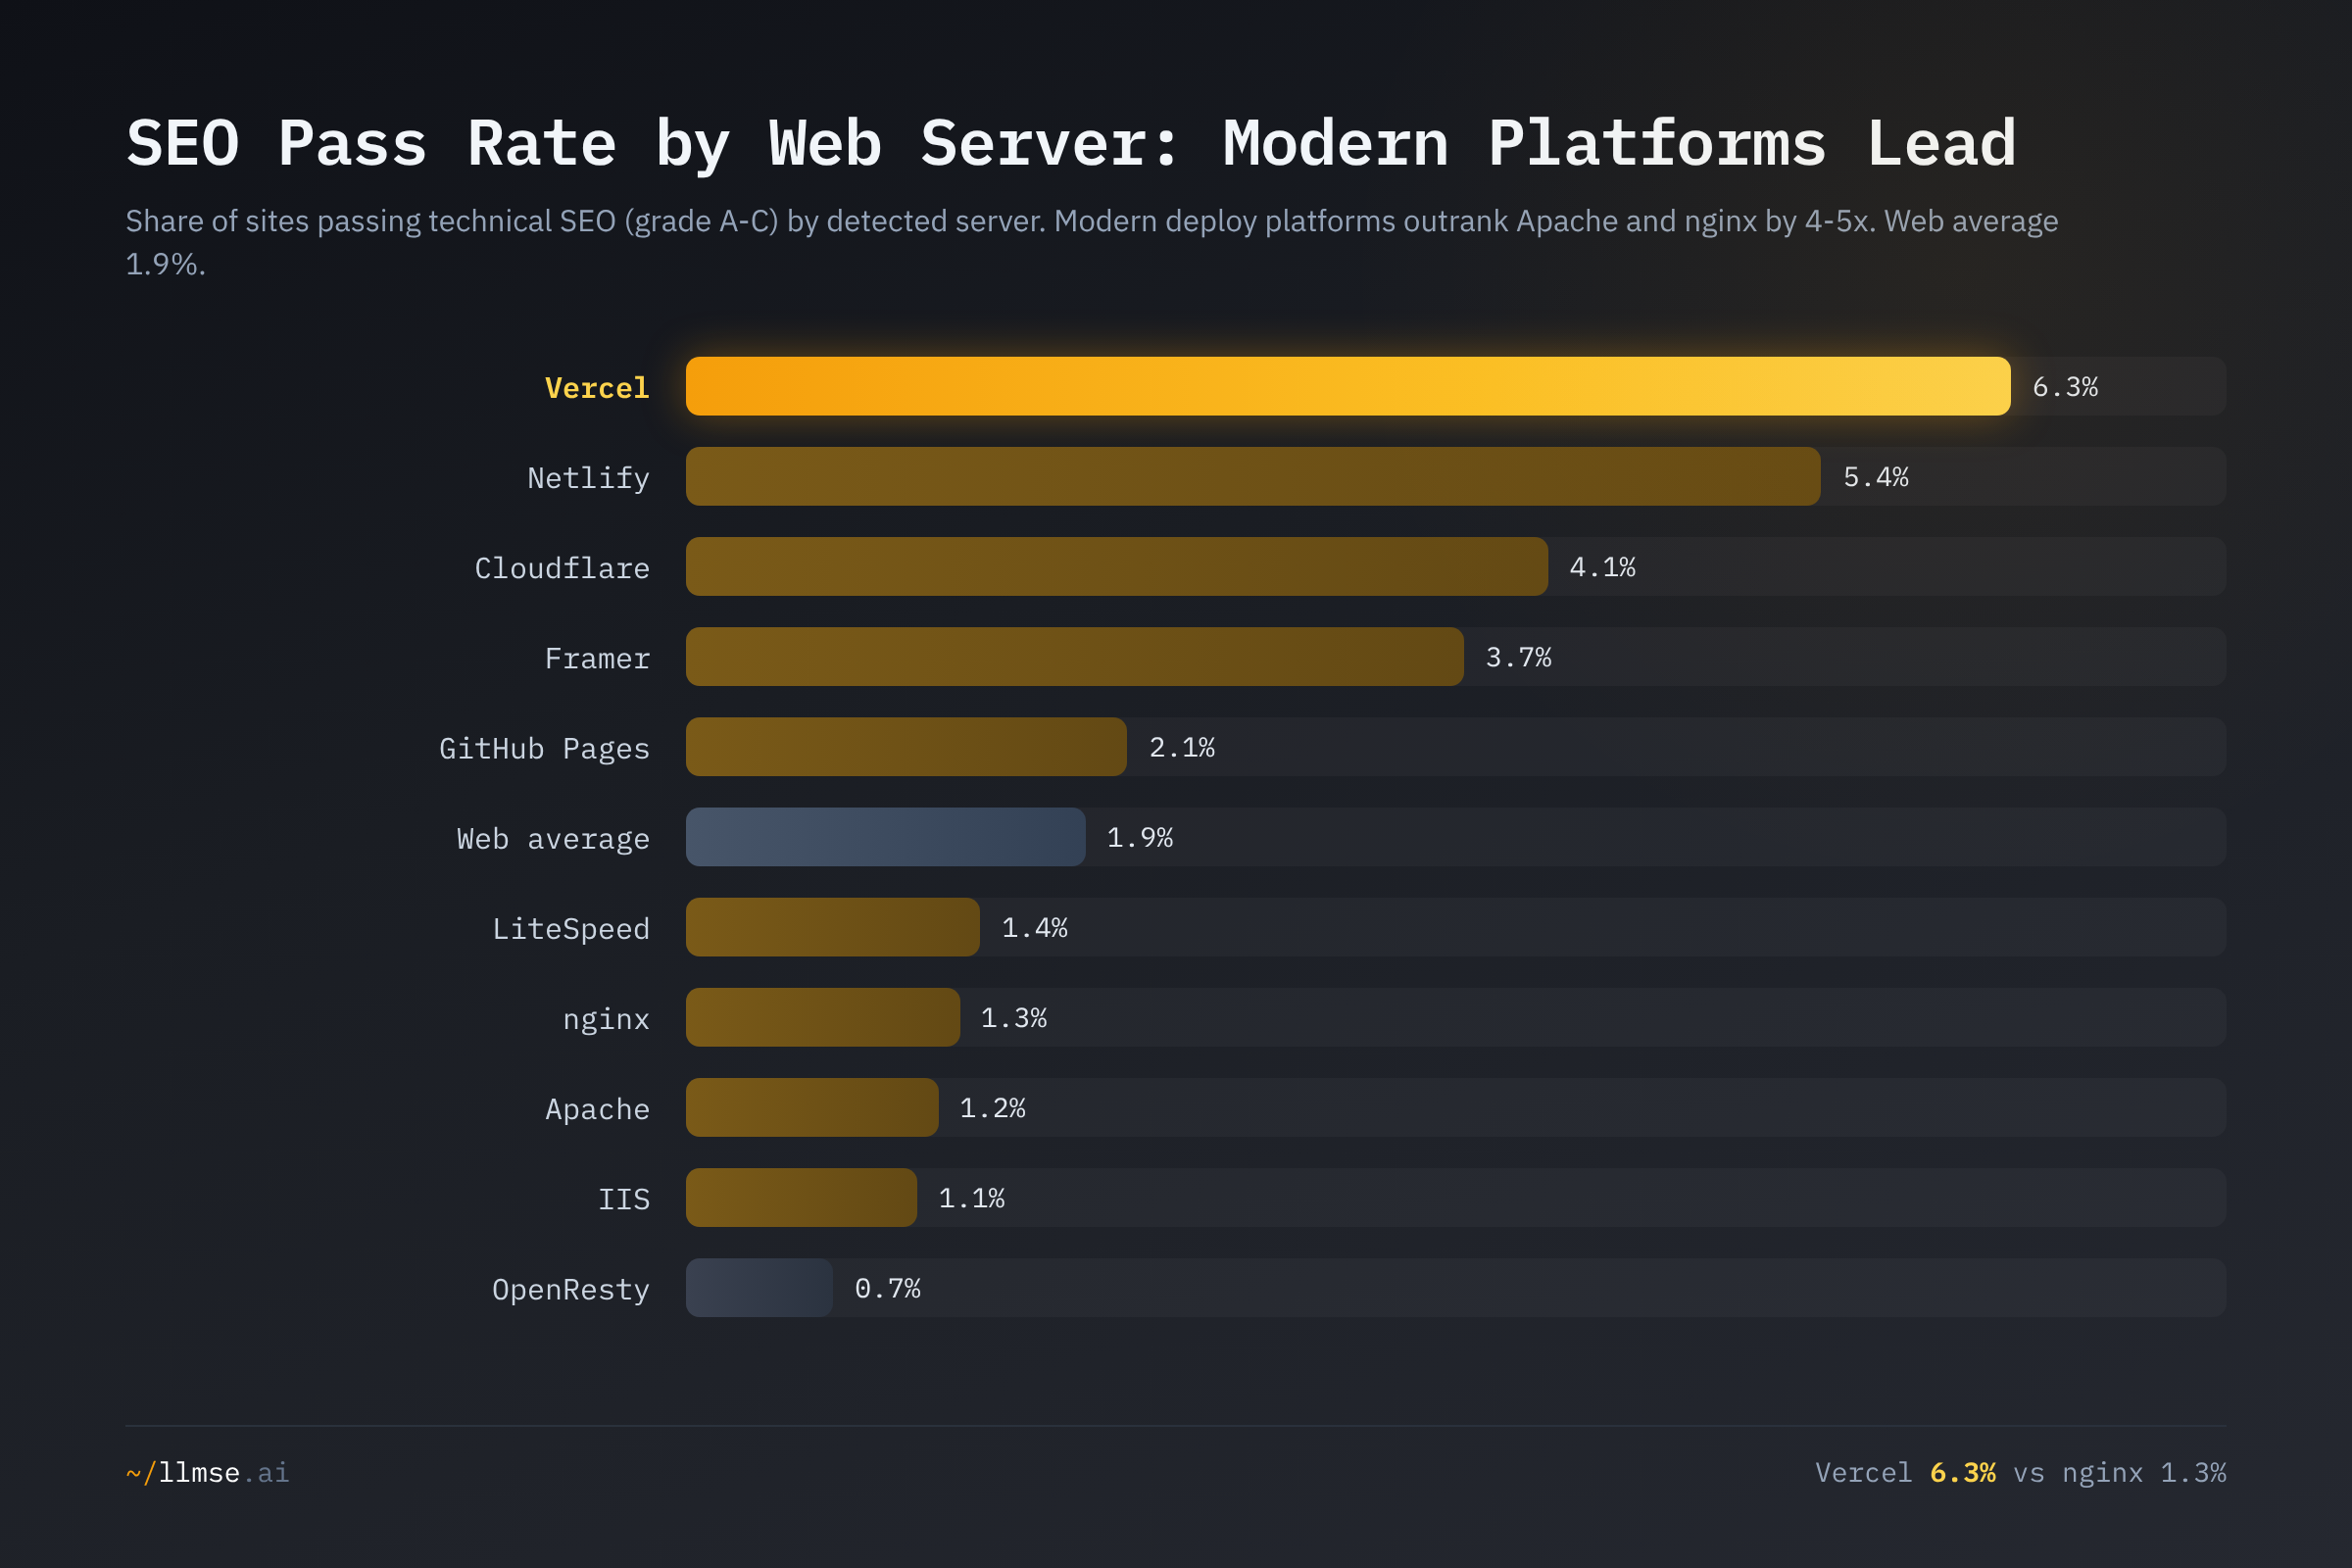
Vercel (6.3%) and Netlify (5.4%) — the platforms purpose-built to deploy modern static and framework sites — pass technical SEO at four to five times the rate of Apache (1.2%) and nginx (1.3%), the two servers that host the bulk of the web. Cloudflare, sitting at the edge in front of a large and varied population, lands in between at 4.1%. Market share runs opposite to quality: Apache is the most-deployed server in our index at 29.2% of server-tagged sites, nginx second at 26.3%, and Cloudflare third at 19.6% — yet the two incumbents post the lowest pass rates on the board, while the high-passing platforms are rounding errors by deployment count.
The server is not causing the SEO outcome; it is a proxy for how a site is built and operated. A team deploying to Vercel or Netlify is almost always shipping a modern framework with build-time optimization and clean markup, whereas Apache and nginx host everything from hand-rolled PHP to abandoned installs. (A note on the market-share figures: our index ranks Apache first, while W3Techs ranks nginx first at 31.8%, with Cloudflare 28.5% and Apache 23.2%. The gap is a sampling difference — W3Techs surveys the top ~10 million sites, while LLMSE crawls a far broader long tail where legacy Apache hosting is more common. We report shares within our own crawl frame and treat the ordering as crawl-dependent.)
What's at Stake
- Discoverability is a near-universal failure, and AI answers inherit it. With 94.4% of the web scoring F and only 1.9% passing, the supply of well-structured, crawlable content is tiny — and the same signals feed AI answer engines. As generative search replaces blue links, the verticals that already optimize (gambling at 12.1%, finance at 3.9%) will be over-represented in answers, while the silent 94% loses visibility it cannot easily buy back.
- The competitive bar is absurdly low. Because only 0.43% of sites earn an A or B, implementing documented fundamentals — a clean title and description, an
<h1>, image dimensions, basic structured data, non-blocking CSS — vaults a site past 99% of the web. The cost of the basics is trivial relative to the leverage. - Platform choice is an SEO decision. A site on Weebly (0.1% pass) or a typical Joomla install (0.4%) starts from a structural deficit a site on Astro (4.9%) or Next.js (4.3%) does not. Choosing the build stack is, in effect, choosing a baseline discoverability — before a single optimization is made.
- Scale hides the leaders. The aggregate 1.9% is dragged down by the long tail and by the dominance of mid-passing platforms like WordPress. Reporting a single web-wide number masks the order-of-magnitude spread across category, CMS, and server — and obscures that getting found is far more achievable for some starting points than others.
What Would Help
- Site owners: fix the documented fundamentals before chasing tactics. The gap is in basics, not advanced schema. Run a free SEO analysis on your URL, then address the cheapest high-frequency issues first — image dimensions, a single clear
<h1>, a meta description, Organization JSON-LD, and removing render-blocking CSS. These move the grade more than any clever tactic, and clearing 70 puts you in the top 1.9%. - Developers and platform teams: treat server-rendered, lean HTML as the default. The static-generator and modern-framework lead (Astro, Jekyll, Next.js, Hugo at 4-5%) is the residue of build-time optimization and clean markup. If you are on a heavy builder or a JavaScript shell that hides content from the first crawl, server-side rendering or static generation is the single highest-leverage change.
- CMS and builder vendors: ship crawler-friendly defaults. Platforms at the bottom (Weebly 0.1%, Joomla 0.4%, Shopify 1.3%) place millions of sites at a structural disadvantage. Emitting valid structured data, image dimensions, and non-blocking assets out of the box would lift an enormous population at once — the leverage of fixing the platform dwarfs fixing sites one by one.
- Agencies and SEO teams: audit by segment, not by anecdote. A client's industry, CMS, and host predict their starting grade. Benchmark against the relevant segment rate (gambling's 12.1% and finance's 3.9% are different worlds from shopping's 1.0%) rather than a generic "good SEO" target, and prioritize the platform-level fixes that the data shows matter most.
- AI platforms and search engines: weight quality, not just presence. Because most pages technically have the elements but fail on cumulative quality, naive retrieval over-rewards the optimized fringe. Prefer sources that clear the fundamentals across the board, and surface the documented basics from Google's own guidance to the 94% that lack them.
Explore the Data
- SEO analyzer — score any URL across 80-plus on-page checks.
- Comprehensive audit — SEO alongside EEAT, AEO, WCAG accessibility, readability, GARM brand safety, and privacy.
- Cross-Industry Quality Report Card and The House Always Optimizes — the same index sliced across other quality dimensions and the gambling outlier in depth.
This analysis was conducted using LLMSE, which has classified over 3.4 million websites across SEO, EEAT, AEO, WCAG accessibility, readability, GARM brand safety, and privacy dimensions. SEO figures reflect 3,362,327 sites graded for technical SEO in the index as of June 2026. To analyze your own site, visit llmse.ai/classify.