The Web's Real Stack in 2026: Apache Holds #1, WordPress Owns the CMS, Astro Tops the Frameworks
Update — 2026-06-29: Refreshed against LLMSE's current index of 3.4 million classified URLs, up from the ~957,000 domains analyzed at first publication. The original post's central claim — that Cloudflare had overtaken nginx as the web's top server — no longer holds. Recomputed across 3.17M server-tagged sites, Apache leads at 29.2%, nginx is second at 26.3%, and Cloudflare is third at 19.6%. Every share in this post has been recalculated from live server-*/app-* index cardinalities and triangulated against W3Techs and the HTTP Archive Web Almanac; the JavaScript-framework section is reworked (Astro now tops the deployment count, ahead of Next.js). The corrected thesis: the server race is a three-way split with Apache back on top — not a Cloudflare takeover — though which of Apache or nginx ranks first depends entirely on the crawl frame.
Earlier this year, the tidy headline about web infrastructure was that Cloudflare had finally passed nginx to become the single most common web server on the internet. It was an easy story to tell: Cloudflare's reverse proxy stamps its own name into the HTTP response headers of every site it fronts, and the most visible, most-trafficked sites on the web are exactly the ones most likely to sit behind a CDN. Count those sites and Cloudflare looks like it is everywhere.
Recompute the same census against an index three times larger, weighted less toward the popular front page of the web and more toward its long tail, and the headline collapses. The shared-hosting accounts, the small-business sites, the millions of pages that never trend — those run on the servers they have always run on. When you count them, the "Cloudflare takeover" turns out to have been an artifact of which sites were in view, not a change in what the web is built on.
We re-ran the technology census against LLMSE's technology detection system, reading web servers from HTTP response headers and applications, CMS platforms, and frameworks from HTML fingerprints. The current frame covers 3,171,453 server-tagged sites and 2,879,298 application-layer detections across an index of roughly 3.4 million classified URLs. Shares are computed directly from the cardinalities of LLMSE's server-* and app-* indices — the same counts anyone with read access to those keys can reproduce.
The infrastructure story of 2026 is not a takeover. It is a three-way server split with Apache back on top (29.2%), nginx close behind (26.3%), and Cloudflare a clear third (19.6%); a CMS monoculture that refuses to break, with WordPress holding roughly 87% of the self-hosted CMS market; and a quiet generational shift in the front end, where Astro has edged past Next.js and now runs more than twice as many detected deployments as standalone React. None of those three findings is the one the original post led with — and the most important correction is the first.
The Data
The census operates on two layers. Web servers are read from the Server and related response headers; applications, CMS platforms, JavaScript frameworks, and static generators are read from HTML meta tags, generator markers, script sources, and class-name fingerprints. A site carries at most one server tag but frequently several application tags (a WordPress install on Apache with jQuery counts once on each), so application detections exceed the count of distinct application-tagged sites.
| Layer | Detections | Distinct signatures | Current leader |
|---|---|---|---|
| Web servers | 3,171,453 | 3,500+ | Apache — 29.2% |
| Applications / CMS / frameworks | 2,879,298 | 356 | WordPress — 36.9% |
The server total has grown from the ~1.23M detections in the original post to 3.17M, and the application total from ~1.21M to 2.88M, as LLMSE's index expanded past 3.4 million classified URLs. That growth is the entire reason the rankings moved, and it is the subject of the methodology note below. Counts are a live snapshot and drift by a handful between reads as classification continues; figures here are rounded and reflect a single capture in June 2026.
Methodology
This post makes quantitative claims about market share, so the definitions and limits matter.
- What a detection means. A server share is the fraction of server-tagged sites whose response headers identify a given server. An application share is the fraction of all application-layer detections attributable to a platform. Server share denominators (3.17M) and application share denominators (2.88M) are different populations and are never mixed.
- Detection basis. Server identity comes from HTTP headers; application identity comes from static HTML fingerprints on a single fetched page. This is fingerprint detection, not a vendor census — it sees what a page exposes, and nothing it hides.
- Cross-reference method. All shares are reproducible from the cardinalities of LLMSE's sorted-set indices (
ZCARD server-Apache,ZCARD app-WordPress, and so on); category and grade cross-references, where used elsewhere on this site, are set intersections via RedisZINTERCARD. All counts are aggregate; no individual site is identified. - CMS basket. "CMS market share" is computed over a defined basket of self-hosted and headless content management systems (WordPress, Drupal, Joomla, TYPO3, Plone, MediaWiki, Contentful, Contao, Prismic, Ghost, Strapi, Sanity, Umbraco, Sitecore, and ~15 smaller platforms), totalling 1,224,165 detections. Adobe Experience Manager (116,641) is reported separately as an enterprise platform; folding it into the basket lowers WordPress's share from 86.7% to 79.1%, which we note explicitly rather than hide.
- Known limits. Three biases dominate and are unpacked in When Detection Lies: CDN reverse proxies (Cloudflare, Fastly) mask the origin server; client-side-rendered apps and compile-away frameworks (SvelteKit, parts of WooCommerce and Wix) are systematically undercounted; and a few fingerprints are inflated by a single dominant host or a likely signature collision (Medium inflates Ember.js; Phoenix and Fresh post counts inconsistent with their known ecosystems). We exclude those three from the framework comparison.
- Why these numbers differ from the original. The original census ran on ~957K domains and reported Cloudflare at 31.3%, nginx at 24.4%, and Apache at 17.5%. The current frame is 3.3x larger on the server layer. Early crawling was skewed toward popular, CDN-fronted sites — precisely the population where Cloudflare is over-represented — so as coverage broadened into the long tail of shared hosting, Apache's and LiteSpeed's shares rose and Cloudflare's fell. The ranking flip is a sampling-frame effect, not a migration. Russian-language sites are excluded from LLMSE aggregates by policy; the technology shares here are computed over the remaining multilingual index.
The Scorecard
The web server layer is where the original post was most wrong, so it is where the corrected picture starts. Counting all 3.17M server-tagged sites:
| Rank | Server | Sites | Share |
|---|---|---|---|
| 1 | Apache | 926,102 | 29.2% |
| 2 | nginx | 833,870 | 26.3% |
| 3 | Cloudflare | 621,779 | 19.6% |
| 4 | LiteSpeed | 259,896 | 8.2% |
| 5 | GitHub Pages | 88,651 | 2.8% |
| 6 | OpenResty | 69,737 | 2.2% |
| 7 | IIS | 54,036 | 1.7% |
| 8 | OVHcloud | 28,590 | 0.9% |
| 9 | Amazon S3 | 27,727 | 0.9% |
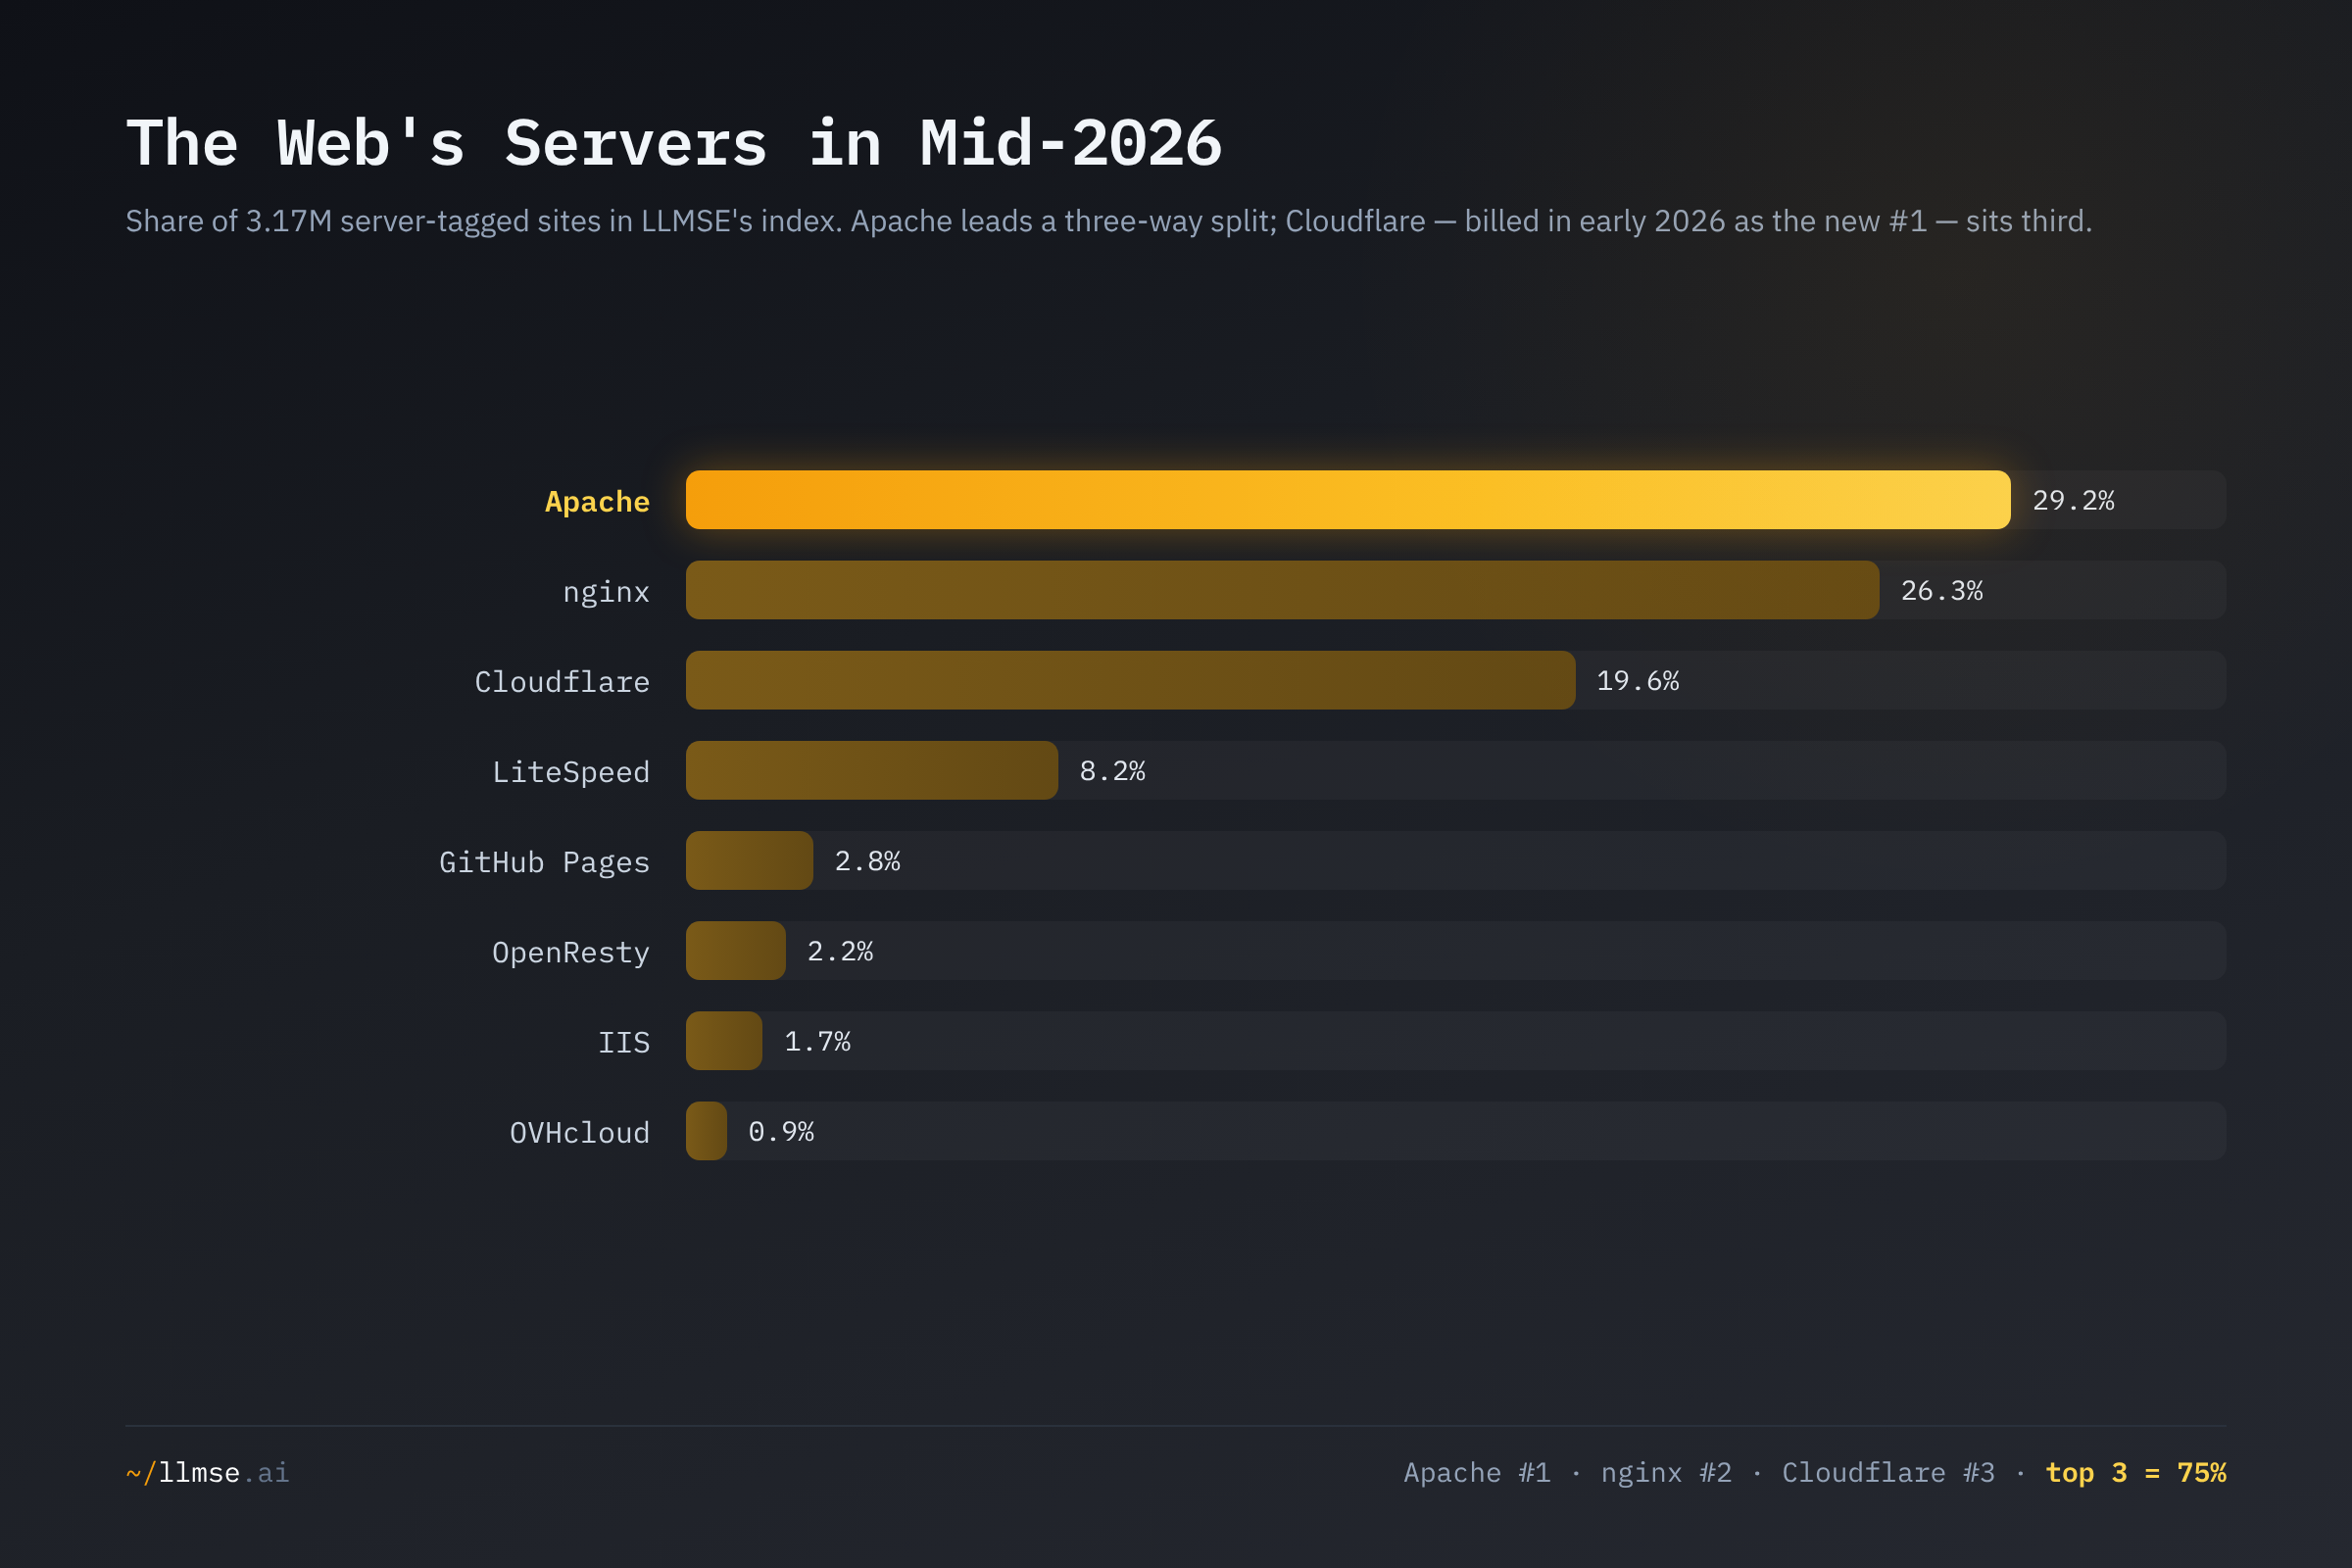
Apache, nginx, and Cloudflare together account for 75% of server-tagged sites, but no single server dominates — the top three sit within ten points of one another. This is the central correction. The original post's "Cloudflare has overtaken nginx" framing described the popular web, not the whole web; against the full index Cloudflare is a clear third. Apache's resurgence is not growth so much as visibility: the long tail of cPanel-managed shared hosting, small-business sites, and legacy installations defaults to Apache, and as the index reached deeper into that tail, Apache's true weight reasserted itself. LiteSpeed's near-doubling to 8.2% comes from the same place — it is the performance-oriented Apache replacement that shared hosts deploy at scale. GitHub Pages, conversely, fell from 6.6% to 2.8%: it was over-represented in an early frame heavy with developer and documentation sites, and normalized as the population broadened.
Web Servers: Apache Reclaims the Top, and Cloudflare Isn't #1
The cleanest way to see that "which server leads" is a question about who you count is to put LLMSE's frame next to W3Techs, the most widely cited server tracker, which surveys the top ~10 million most-visited sites.
| Server | LLMSE crawl frame | W3Techs (top 10M) |
|---|---|---|
| Apache | 29.2% | 23.2% |
| nginx | 26.3% | 31.8% |
| Cloudflare | 19.6% | 28.5% |
| LiteSpeed | 8.2% | 15.1% |
| IIS | 1.7% | 3.2% |
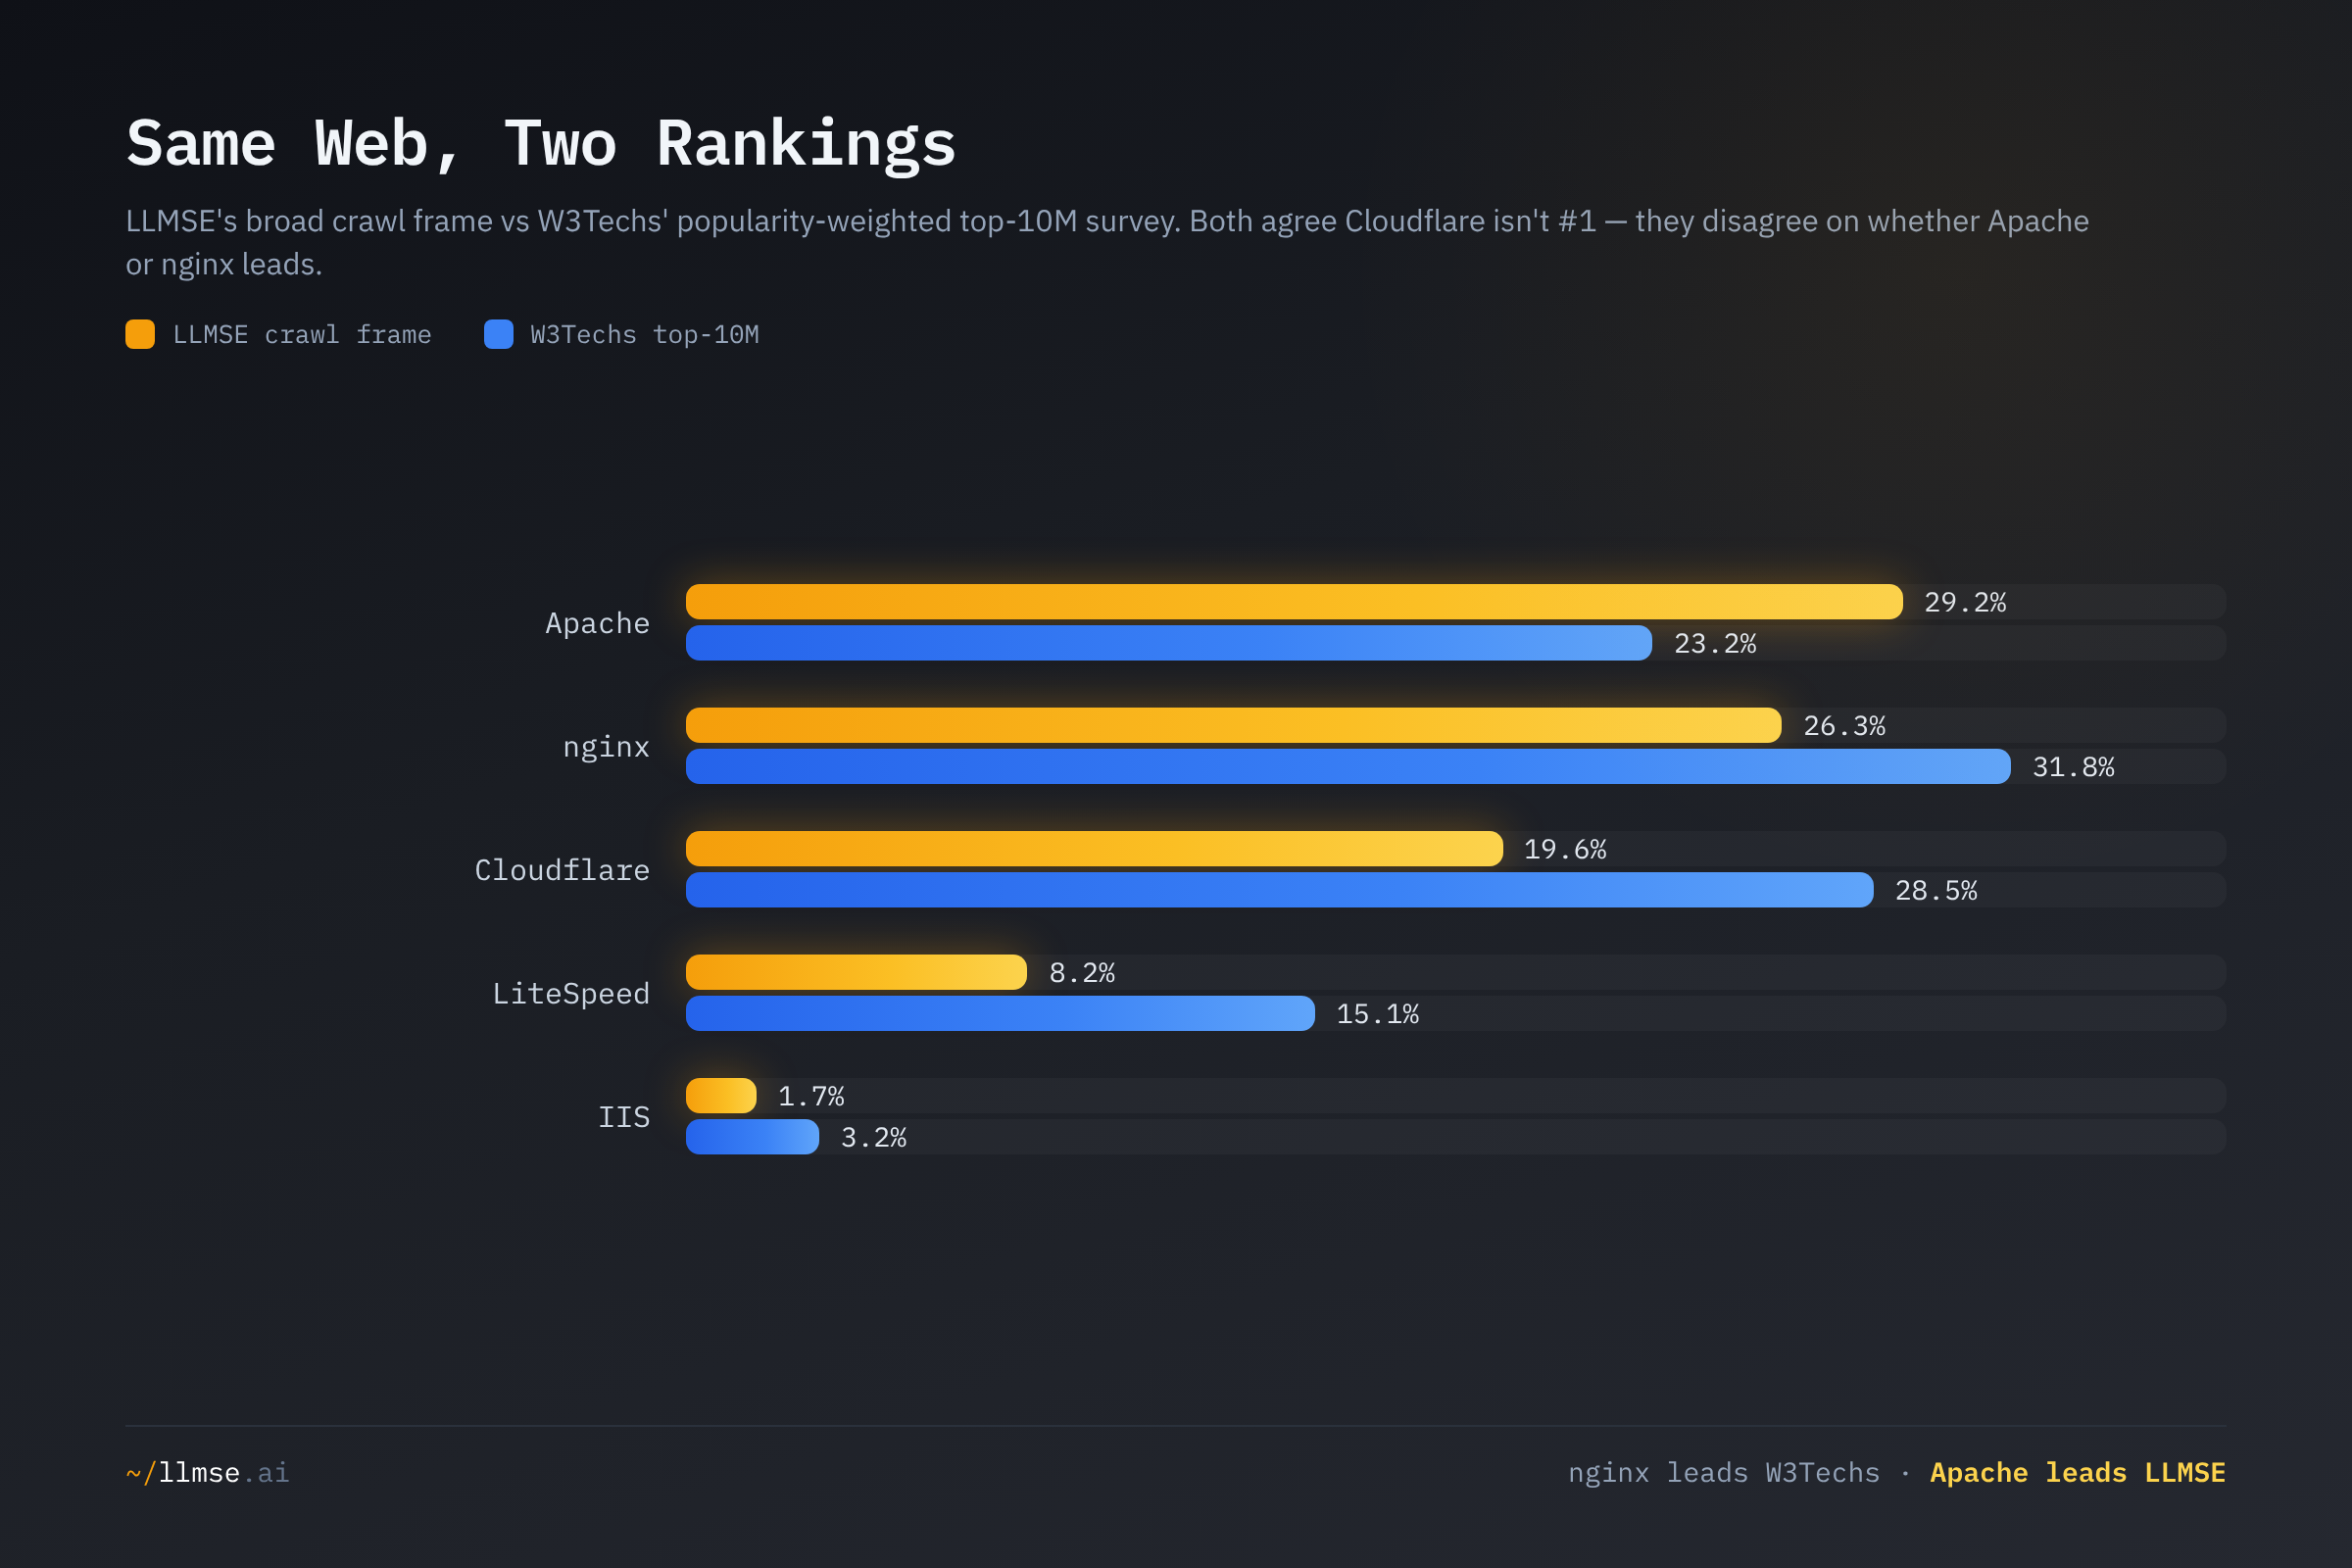
The two sources disagree on whether Apache or nginx is first, and that disagreement is the whole point — but they agree, decisively, that Cloudflare is not. W3Techs (as of 29 June 2026) ranks nginx first at 31.8%, Cloudflare second at 28.5%, and Apache third at 23.2%; LLMSE ranks Apache first, nginx second, Cloudflare third. The divergence is structural, not a contradiction: W3Techs weights toward high-traffic sites, which skew to nginx-and-Cloudflare modern infrastructure, while LLMSE's broader frame surfaces the Apache-heavy long tail. Cloudflare's share is higher in W3Techs (28.5% vs 19.6%) precisely because popular sites disproportionately sit behind it — the same effect that produced the original post's mistaken "takeover" reading. Read together, the sources bracket the truth: nginx and Apache are in a statistical tie for first depending on how you sample, and Cloudflare, while enormous, fronts roughly one in five sites in the broad frame and a larger but still-second share among the popular web.
The CMS Layer: WordPress Against Everyone
The application layer tells the opposite story — not a contested race but a monoculture. Narrowing to the self-hosted and headless CMS basket (1,224,165 detections):
| Rank | CMS | Sites | CMS market share |
|---|---|---|---|
| 1 | WordPress | 1,060,989 | 86.7% |
| 2 | Drupal | 35,628 | 2.9% |
| 3 | Joomla | 28,238 | 2.3% |
| 4 | TYPO3 | 21,585 | 1.8% |
| 5 | Plone | 19,229 | 1.6% |
| 6 | MediaWiki | 15,933 | 1.3% |
| 7 | Contentful | 7,889 | 0.6% |
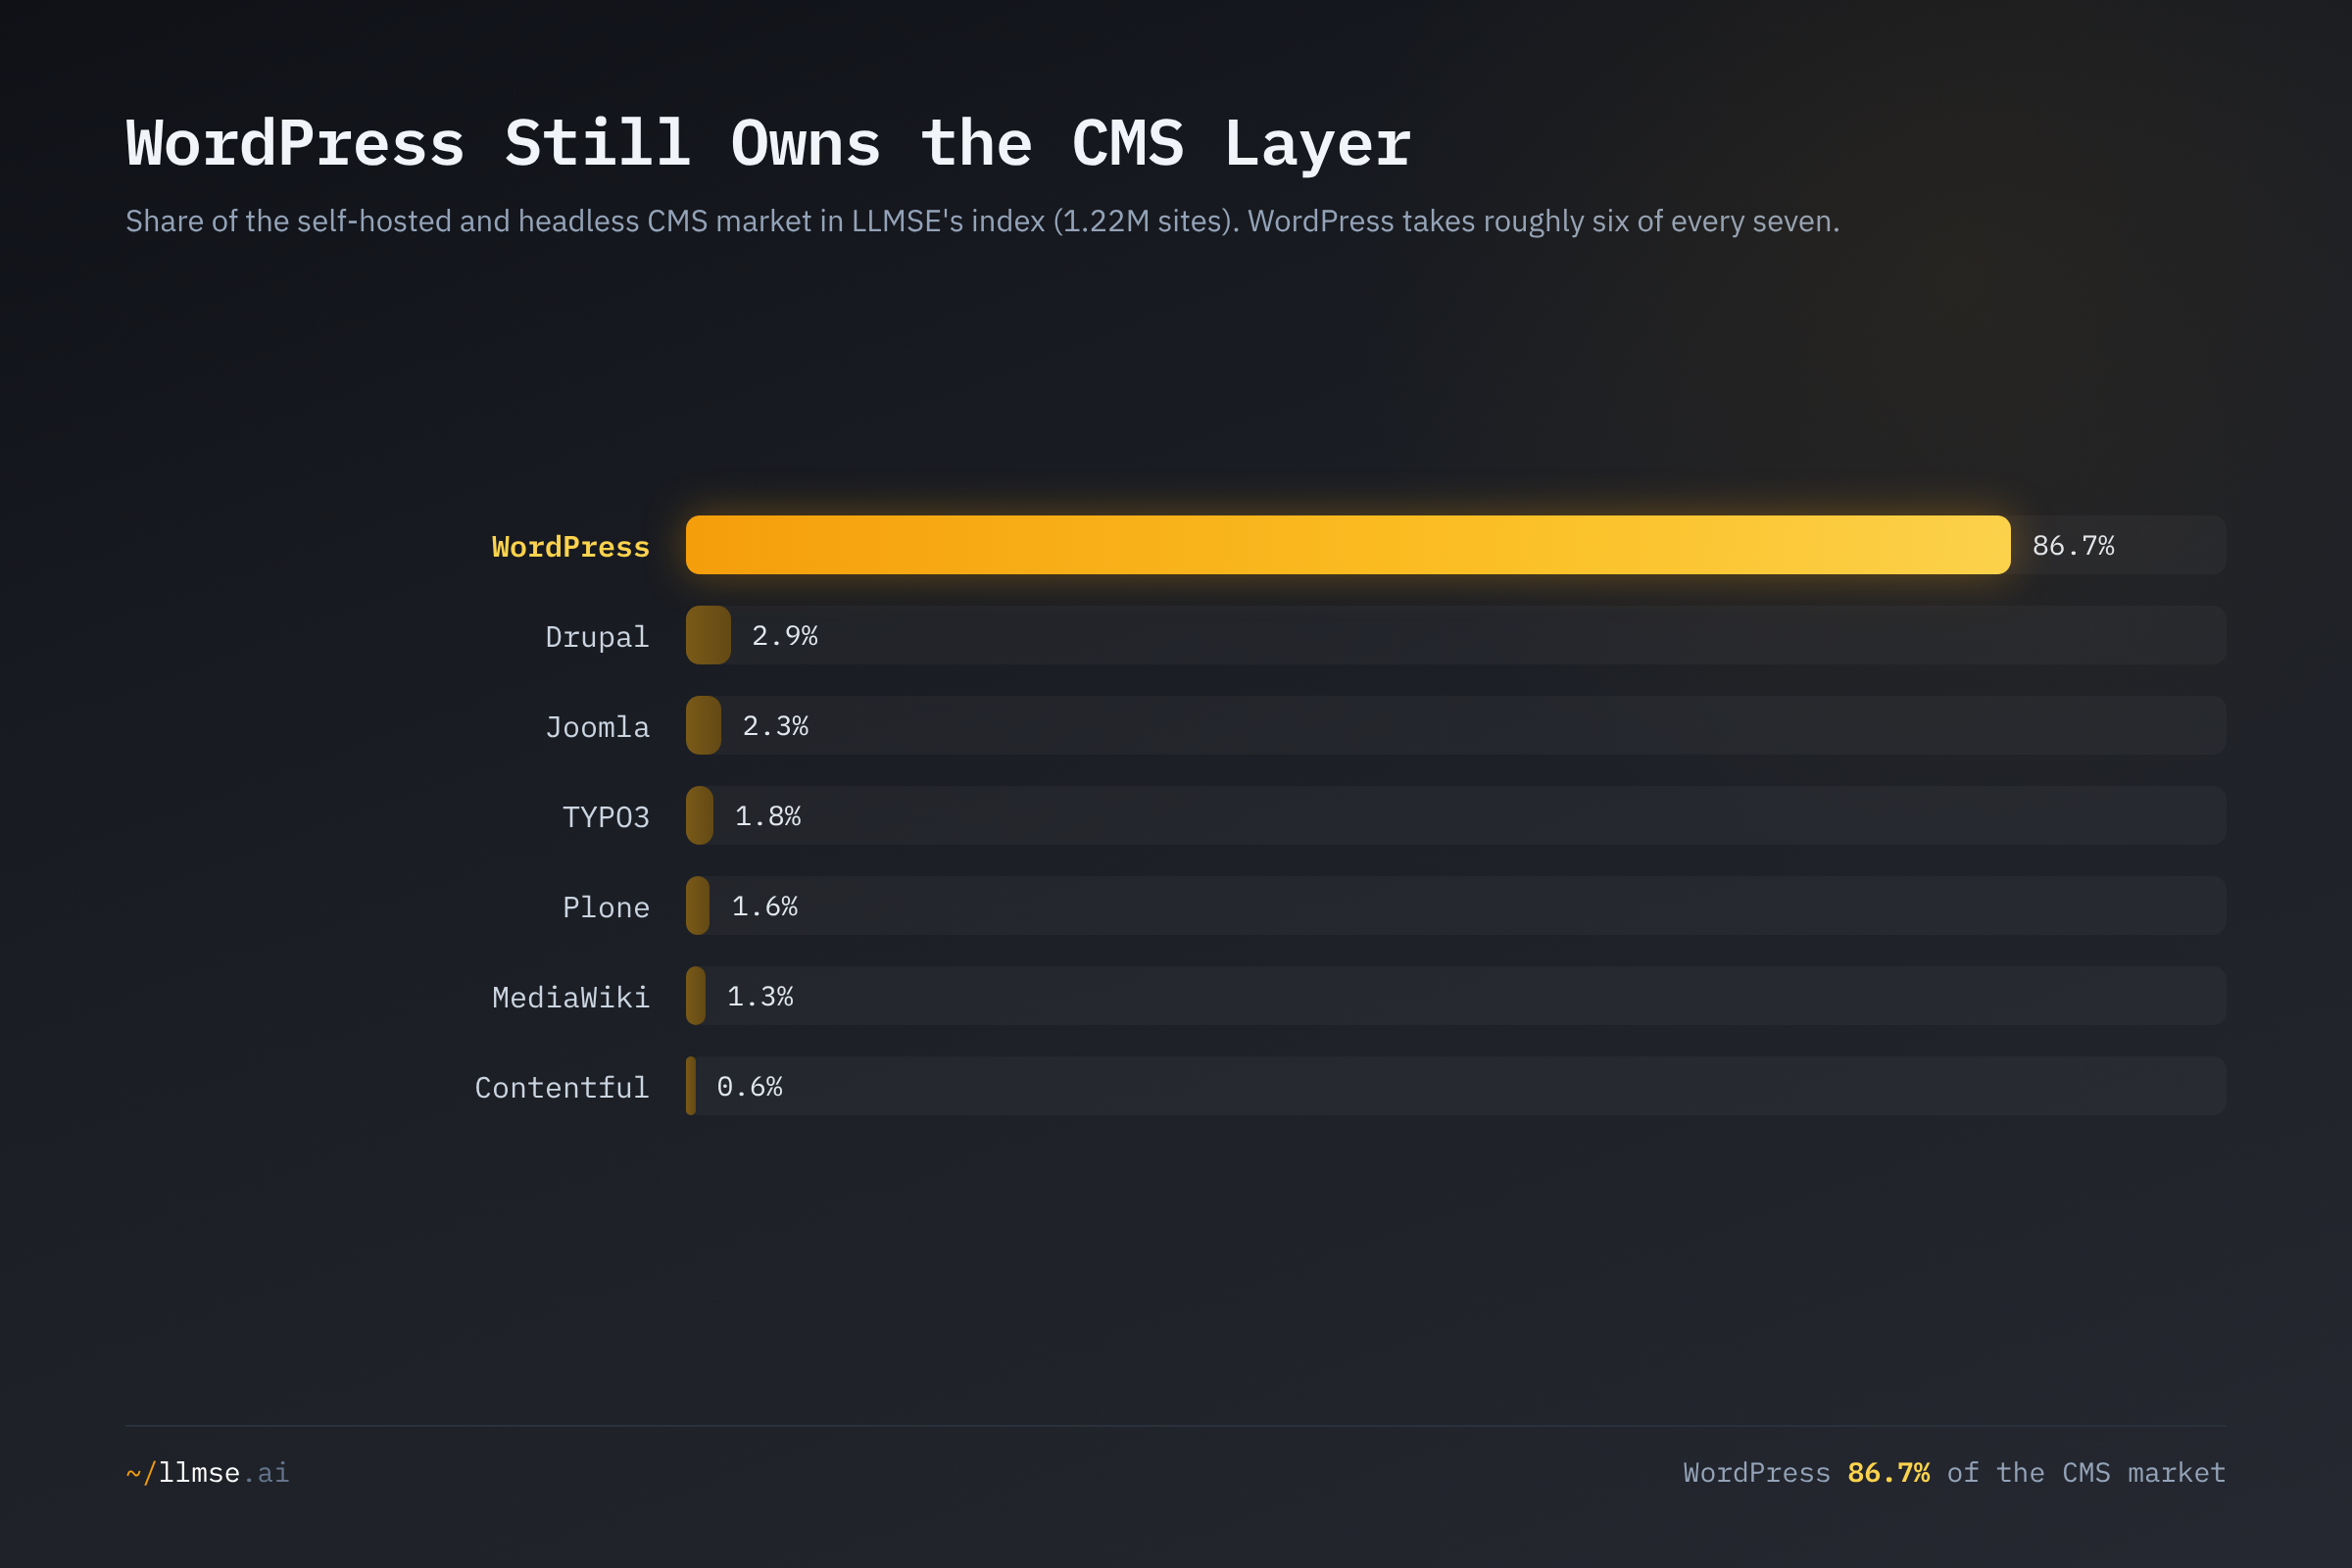
WordPress holds 86.7% of the self-hosted CMS market and 36.9% of all application detections — more than the entire rest of the basket combined, several times over. The "WordPress versus everything" framing flatters the competition: it is really WordPress, and then a dozen platforms each clinging to 1–3%. The result is robust to definition. W3Techs (content-management overview, 29 June 2026) puts WordPress at 41.5% of all websites and 59.2% of the CMS market — a lower market share only because W3Techs counts hosted builders (Wix, Squarespace) and Shopify inside its CMS category, which LLMSE treats as separate website-builder and e-commerce segments. The HTTP Archive Web Almanac 2024 lands in the same place: 51% of sites run a CMS, WordPress is 36% of all sites and roughly 70% of the CMS market. Across three methodologies WordPress sits between 36% and 42% of all sites and between 59% and 87% of the CMS market depending on basket — the band is wide, but the conclusion is identical: no other content platform is within an order of magnitude. The only enterprise system at real scale is Adobe Experience Manager (116,641); count it inside the basket and WordPress's share is 79.1%, still a supermajority.
Frameworks and Static Generators: Astro Overtakes the React SPA
The front-end story has genuinely changed since the original post, and not in the direction it predicted. Counting detectable deployments of JavaScript frameworks and static site generators:
| Rank | Framework / SSG | Deployments | Type |
|---|---|---|---|
| 1 | Astro | 23,797 | SSG / islands |
| 2 | Next.js | 21,305 | React meta-framework |
| 3 | Jekyll | 17,666 | SSG |
| 4 | Hugo | 12,077 | SSG |
| 5 | Angular | 10,353 | SPA framework |
| 6 | React (standalone) | 10,310 | SPA library |
| 7 | Vue.js | 7,251 | SPA framework |
| 8 | Nuxt.js | 7,006 | Vue meta-framework |
| 9 | Gatsby | 3,604 | React SSG |
Three high-count fingerprints are excluded from this comparison as detection artifacts: Ember.js (112,546) is inflated because Medium, a single platform with custom-domain publications, is built on it; Phoenix (184,039) and Fresh (36,387) post counts wildly inconsistent with the known size of the Elixir and Deno ecosystems and almost certainly reflect signature collisions. Carrying them would mislead.
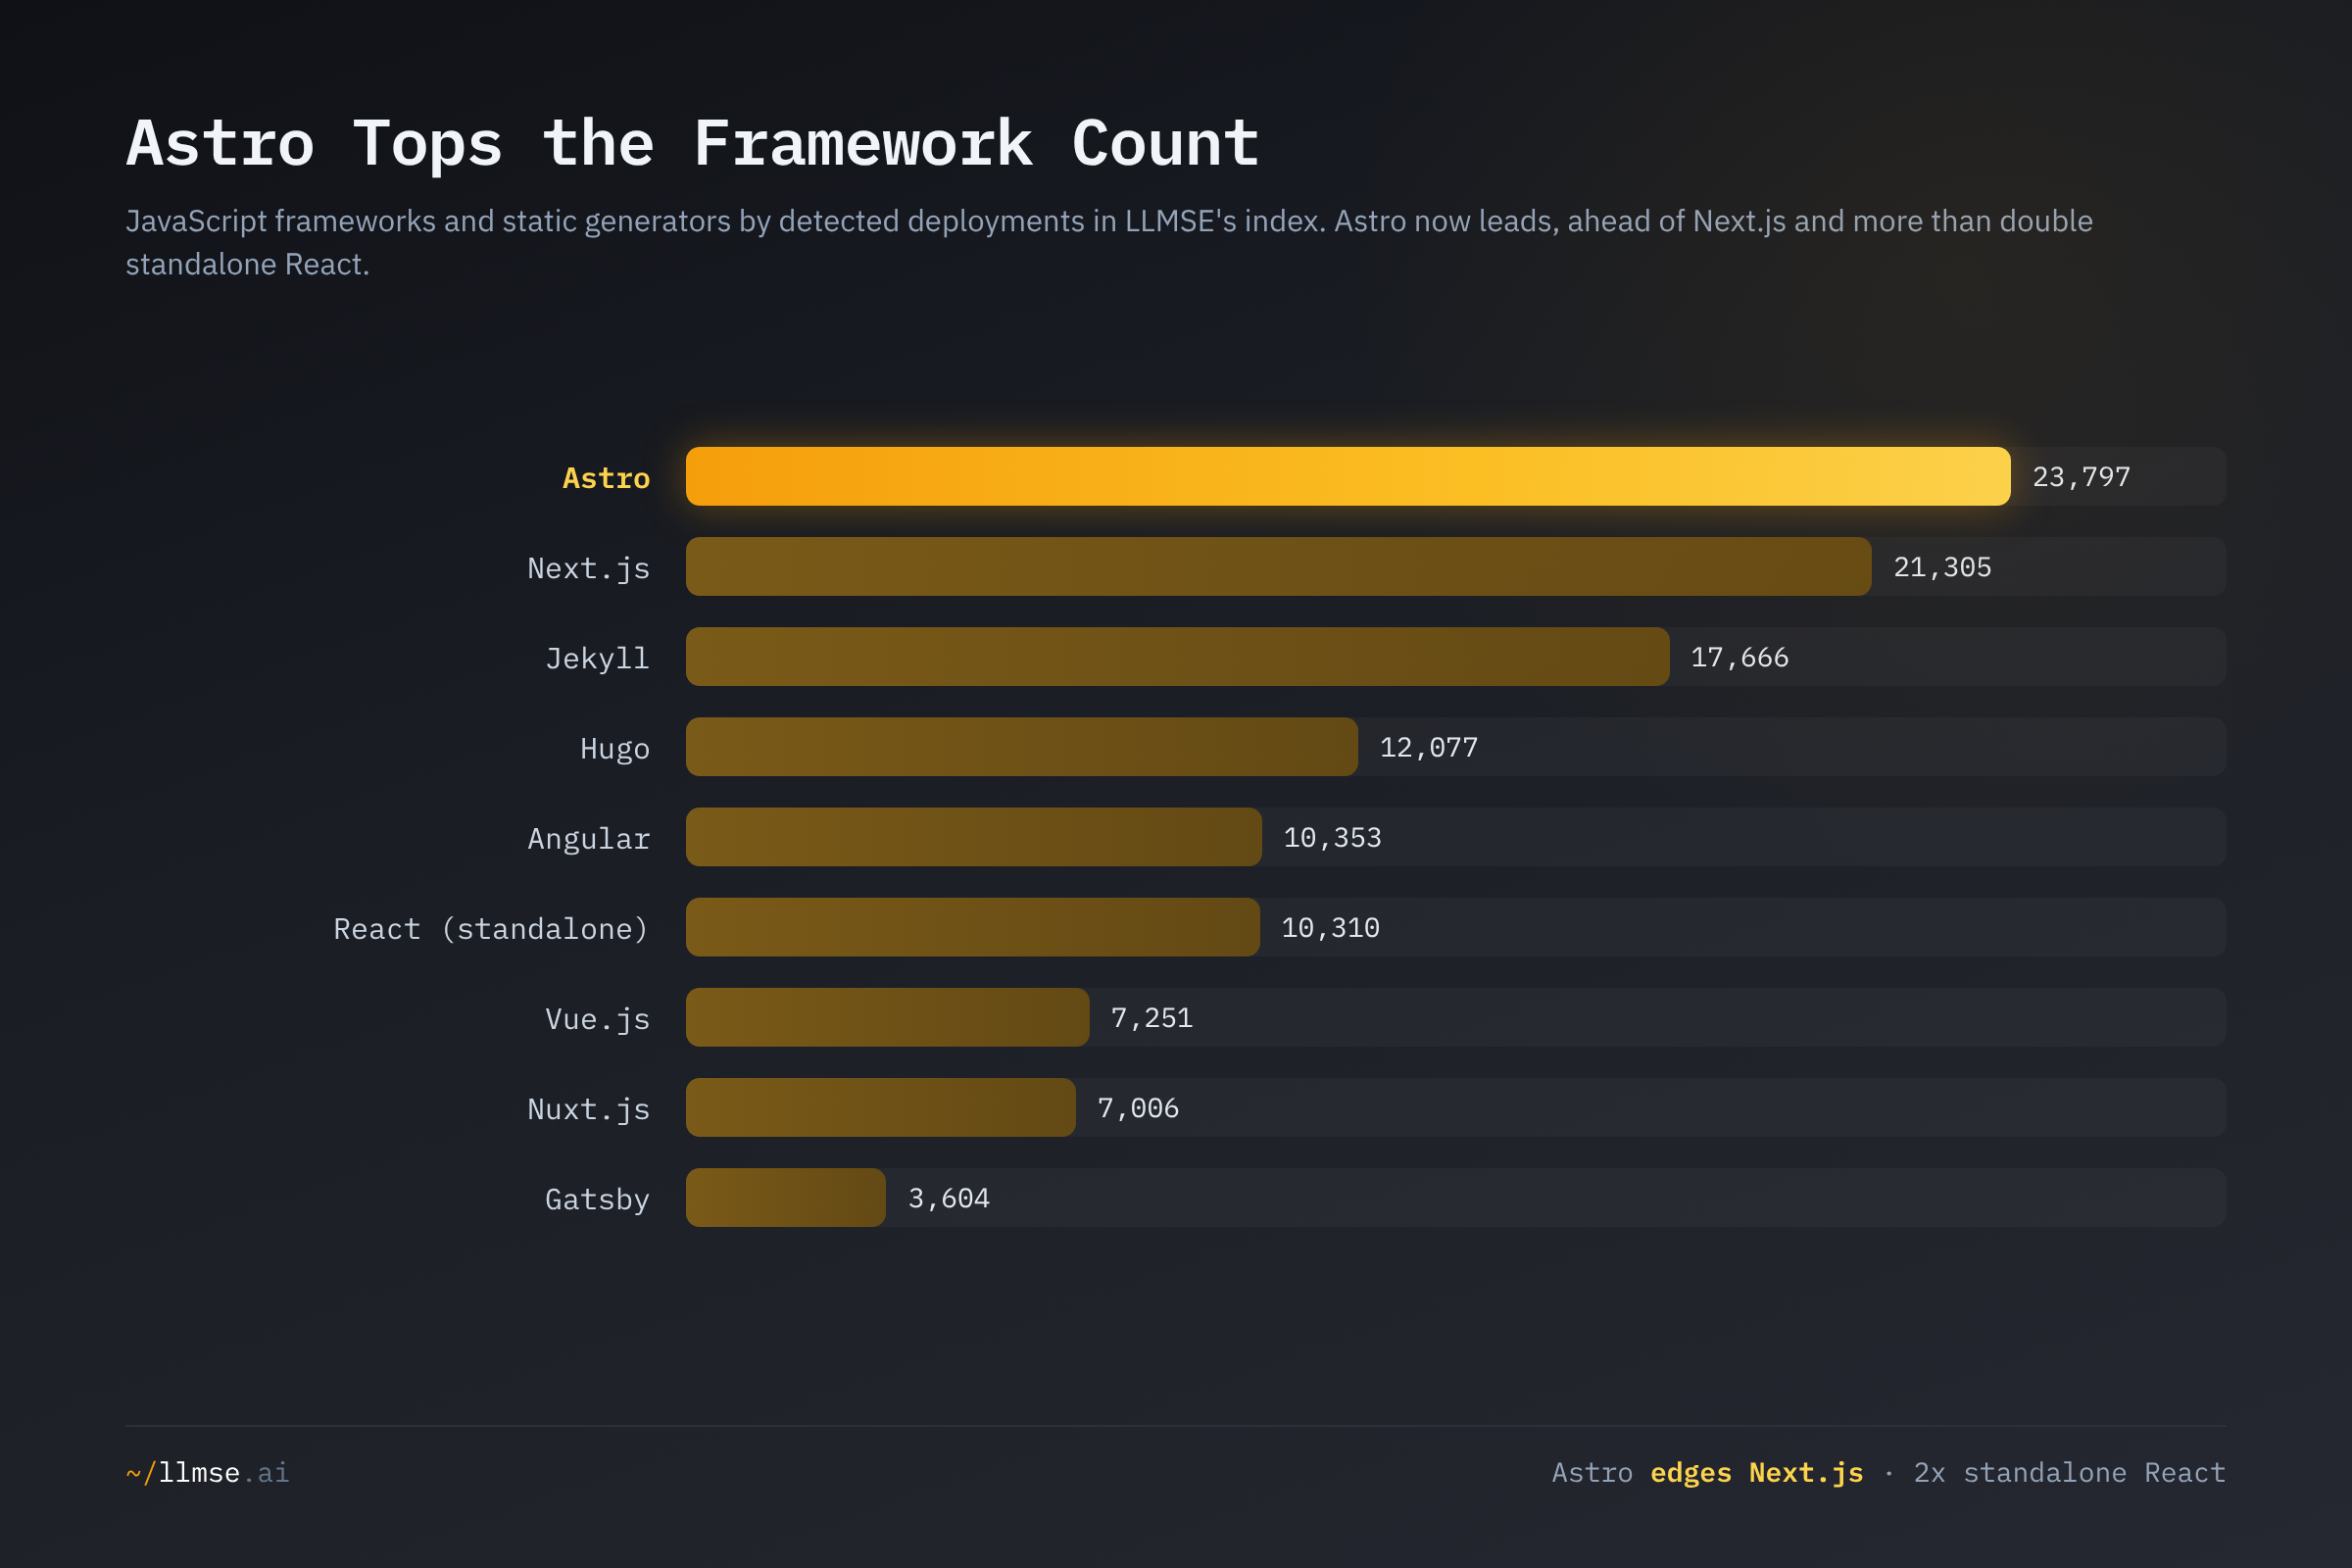
Astro now leads the count at 23,797 deployments — ahead of Next.js (21,305) and more than double standalone React's 10,310. That is the headline reversal: where the original post crowned "the React ecosystem," the single most-deployed front-end tool in the current index is a static-first islands framework, and the classic client-rendered React SPA has fallen behind it two to one. The static-generation cohort as a whole is heavy — Astro, Jekyll (17,666), and Hugo (12,077) occupy three of the top four slots — reflecting the gravity of documentation, blogs, and content sites that have no reason to ship a full client-side runtime.
The external picture both confirms the direction and cautions against over-reading the exact ordering. The Web Almanac 2024 Jamstack chapter — measuring popularity-weighted page samples rather than deployment counts — still ranks Next.js ahead of Astro and notes Hugo leading prerendered sites at 18%, but it also reports that Astro grew 3x in 2024 and calls it a framework that "could become the dominant" one if the trend holds. The two views differ because they measure different things: LLMSE counts distinct deployments across a broad index, the Almanac counts share of traffic-weighted pages. They agree on the trajectory — Astro is surging and static generation is ascendant — even where they disagree on who is, today, exactly first. We report the deployment ranking and flag the divergence rather than resolve it artificially.
Builders and Storefronts: Tilda Leads, Shopify Holds
Among hosted visual website builders, the count leader has shifted: Tilda tops the segment at 45,776 detected sites, ahead of Squarespace (26,544), Weebly (16,324), and Webflow (13,488). Wix (3,051) ranks far below its true install base — like WooCommerce below, its sites frequently route through proprietary infrastructure that leaves no homepage fingerprint, so the detection figure undercounts it heavily and should be read as a floor, not a market share.
E-commerce detection is led by Shopify at 15,422, whose templating exposes a reliable fingerprint, followed by Magento (8,103), OpenCart (6,421), and Spree Commerce (4,624). WooCommerce appears at only 1,377 despite powering a vast number of stores — because it is a WordPress plugin, LLMSE tags those sites as WordPress unless WooCommerce-specific markup is present on the page fetched. The e-commerce table measures detectable storefronts, not the real installed base, and the two diverge sharply for plugin-based platforms.
When Detection Lies: Why These Counts Are Not a Census
Every figure above is a measurement of what sites expose, and the gap between exposure and reality is the single most important thing to understand about technology-fingerprint data. Three mechanisms drive that gap, and together they explain both the W3Techs divergence and the artifacts we excluded.
Reverse proxies mask origins. A site behind Cloudflare reports Server: cloudflare, not the Apache or nginx underneath. Cloudflare's 19.6% therefore measures sites routing through Cloudflare, not sites whose origin is Cloudflare — there is no such thing. Some unknown fraction of Apache and nginx is hidden behind the CDN tier, which means the true origin-server population is even more Apache- and nginx-weighted than the headers show.
Client-side rendering and compilation erase fingerprints. Frameworks that compile away their runtime (SvelteKit at 1,384, Svelte at 322) or render entirely on the client expose little or nothing in the initial HTML, so they are undercounted relative to survey-based popularity rankings. The same applies to plugin platforms (WooCommerce) and builders that proxy through their own edge (Wix). Detection systematically understates exactly the technologies designed to leave a light footprint.
A few fingerprints over-count. When one large platform is built on a niche framework, every site on that platform inherits the fingerprint — Medium gives Ember.js 112,546 detections it did not earn from independent adoption. And occasionally a signature simply collides with something common, producing counts (Phoenix at 184,039, Fresh at 36,387) that no knowledge of the actual ecosystem can justify. These are the data's loudest false positives, and a responsible reading drops them rather than narrates them.
The practical lesson is the one the server ranking taught: a technology share is only as meaningful as the frame it was measured in, and a single source's leaderboard is a hypothesis, not a fact. That is why every claim in this post is triangulated against an independent tracker.
What's at Stake
- Server concentration is real but misread. The risk was never that one server binary dominates — it is that one intermediary fronts a disproportionate share of the popular web. Cloudflare fronts ~1 in 5 sites in the broad frame and more among high-traffic ones, and on 18 November 2025 a single configuration change took down the majority of its core traffic for roughly six hours — Cloudflare's own post-mortem called it its worst outage since 2019. Concentration at the proxy tier, not the server tier, is the systemic exposure.
- The WordPress monoculture is a supply-chain surface. When ~87% of the self-hosted CMS market and over a million indexed sites run one platform and its plugin ecosystem, a single widely-installed vulnerable plugin becomes an internet-scale event. Monoculture is efficient and it is fragile in the same breath.
- Static generation is now the front-end center of gravity, and AI answer engines reward it. Astro, Jekyll, and Hugo dominating the count means a large share of new content sites ship server-rendered HTML that crawlers and answer engines can read directly — an advantage client-rendered SPAs do not get for free. The framework choice is increasingly a discoverability choice.
- Single-source rankings mislead. The original "Cloudflare overtook nginx" claim was defensible from one frame and wrong as a statement about the web. Anyone making infrastructure decisions on a single tracker's leaderboard is reasoning from a sample they have not inspected.
What Would Help
- Analysts and journalists: triangulate server stats across crawl frames before declaring a winner. As this post shows, Apache, nginx, and Cloudflare can each be made to look like "the leader" depending on whether you weight by popularity or by population. Cite the frame, compare at least two trackers (W3Techs and the Web Almanac are the obvious pair), and report ranges, not a single rank.
- Site owners: don't assume the popular stack is your stack. If you run a small or mid-size site, your realistic peers are the Apache-and-LiteSpeed long tail, not the nginx-and-Cloudflare front page. Benchmark against the population you actually belong to.
- WordPress operators: treat the monoculture as a target. A platform this dominant attracts proportional attacker attention. Keep core and plugins patched, minimize the plugin surface, and audit what each plugin exposes. Check what your own site reveals at llmse.ai/classify.
- Teams choosing a front end: default to static generation for content. Astro, Hugo, and Jekyll lead the count because static-first output is cheaper to host, faster to serve, and trivially crawlable — including by AI answer engines. Reserve client-side React for genuinely app-like surfaces.
- Tooling vendors: publish detection methodology and confidence. The Ember/Medium and Phoenix/Fresh artifacts in this very dataset show why opaque fingerprint counts mislead. Disclose what each signature matches, and flag platform-inflated and collision-prone fingerprints so downstream analysis can exclude them.
Explore the Data
Browse the full technology distribution on LLMSE's technology index, or filter the index by server, CMS, or framework using server: and app: filters in advanced search. Every share in this post is reproducible from the cardinalities of the corresponding server-* and app-* indices.
This analysis was conducted using LLMSE, which has classified over 3.4 million websites across SEO, EEAT, AEO, WCAG accessibility, readability, GARM brand safety, and privacy dimensions. Technology shares reflect 3,171,453 server-tagged sites and 2,879,298 application-layer detections in the index as of June 2026. To analyze your own site, visit llmse.ai/classify.