The Carbon Cost of Bad Code: The Web's Greenest Architectures Are Its Least Adopted
Update — 2026-06-29: Refreshed against LLMSE's current index of 3.4 million classified URLs (up from ~1.4M at first publication), with every technology share recomputed from live detection counts. Two substantive corrections. First, the server ranking flipped: Apache now leads at 29.2%, with nginx second (26.3%) and Cloudflare third (19.6%) — not the "Cloudflare leads" claim in the original. Second, every carbon figure is now explicitly a modeled estimate, recomputed with the Sustainable Web Design Model v4, which produces emissions roughly two-thirds lower than the figures the original quoted (the original's "1.76 g CO2e per MB" becomes ~0.14 g/MB under the current model), and the IEA data-centre figure is corrected to ~415 TWh / ~1.5% of global electricity in 2024. Unreproducible curated per-sector technology tables were dropped in favour of live aggregate shares, and four charts were added. The thesis is unchanged and sharper: the greenest architectures — lightweight static stacks — remain the least adopted, while heavy dynamic stacks dominate the web.
Data centres consumed roughly 415 TWh of electricity in 2024 — about 1.5% of global demand — and the IEA projects that more than doubling to around 945 TWh by 2030, driven mainly by AI. A meaningful slice of that load is the open web itself: billions of page loads, each one downloading, parsing, and rendering whatever its technology stack decides to ship. The median web page now weighs 2.1 MB on mobile, and the heaviest tenth exceeds 8 MB.
The conventional framing treats digital carbon as a hosting problem — buy "green" hosting, offset the rest. But the largest controllable variable is not where a page is served from; it is how much the page ships, and that is set upstream, by technology choices. Which CMS renders the HTML. Which JavaScript library loads on top of it. Which server answers the request. Every <script> tag is a data-transfer decision, and data transfer is the quantity every published carbon model converts into grams of CO2e.
That reframes the question. If page weight drives modeled emissions, then the web's environmental footprint is, in large part, an architecture footprint — and architecture is something this dataset can measure directly.
We mapped the technology stack of LLMSE's index of 3.4 million classified URLs, detecting 388+ web technologies from HTML signatures, and recomputed each technology's share from live detection counts. We then used quality grades as an efficiency proxy and applied the Sustainable Web Design Model v4 to HTTP Archive page-weight data to model the carbon difference between stacks. Every CO2e number in this post is a modeled estimate from external methodologies, not a measurement of any individual site.
The headline is an inversion. The lightest-weight architecture — static site generators — powers just 1.7% of the index. The heaviest — dynamic CMS platforms layered with legacy JavaScript — powers more than a third. For every static-generator site, the index holds roughly 19 WordPress sites. The web is built, at scale, on the stacks that the carbon models penalise most.
The Data
Every site in the index is graded A–F on each quality dimension by an automated analyzer, and its technology stack is detected from HTML signatures. The per-dimension graded populations differ — not every URL carries every grade — so pass rates below are always computed over the population actually graded on that dimension.
| Dimension | URLs graded (web-wide) | Web-average pass rate |
|---|---|---|
| SEO | 3,366,128 | 1.9% |
| AEO (AI answers) | 3,341,116 | 1.5% |
| EEAT (trust) | 3,362,000 | 45.4% |
| WCAG (accessibility) | 3,345,039 | 43.8% |
| Readability | 3,345,190 | 32.8% |
| Privacy | 3,339,303 | 37.0% |
Technology shares throughout are computed against the ~3.37M sites graded on SEO — effectively the whole index. A separate 3.17 million sites carry a detected server signature, the denominator for the server-layer shares later in this post. One caveat governs every share here: a site can carry several detections at once (a WordPress site often also loads jQuery and runs behind Cloudflare), so technology shares are not mutually exclusive and do not sum to 100%. They measure how common each technology is, not a partition of the web.
Methodology
This post combines LLMSE's own grade data with an external carbon model, so the definitions and the modeling chain both matter.
- Grades and "pass." Each site is graded A–F by a dedicated analyzer (there is no E grade). "Pass" means A+B+C for SEO, AEO, EEAT, WCAG, and Privacy, and A+B for Readability (a Flesch Reading Ease score of roughly 50+, ≈ 8th-grade level or below). SEO grades technical fundamentals; WCAG covers automated accessibility checks (~30–40% of WCAG 2.1 Level A — manual testing is required for full conformance); the others grade trust, answer-extractability, plain-language, and privacy signals respectively.
- Quality as an efficiency proxy. This post uses SEO and WCAG pass rates as correlates of leanness, not as direct carbon measurements. Sites that pass technical SEO and automated accessibility tend to have cleaner, lighter, better-structured markup — the same properties that reduce page weight. The relationship is a correlation we observe in the data, not a proven mechanism.
- Technology detection is by HTML-signature matching (
wp-contentpaths for WordPress, generator meta tags for Hugo and Jekyll, framework class patterns,Server:headers, and so on) across 388+ technologies. Detection has known blind spots — heavily proxied or custom builds can evade signatures — so shares are lower bounds for some technologies. - Cross-references are computed as set intersections (Redis
ZINTERCARD) between a technology index (app-WordPress,server-Apache, etc.) and each grade index. All counts are aggregate; no individual site is identified. - The carbon model (read this before any gram figure). Every CO2e value here is a modeled estimate, produced by applying the Sustainable Web Design Model v4 to page-weight data. SWDM v4 assigns a total energy intensity of 0.30 kWh per GB of data transferred (0.067 data centre + 0.072 network + 0.161 user device, operational plus embodied) and multiplies by a global grid carbon intensity of 494 gCO2e/kWh (Ember's global average). That yields ≈ 148 gCO2e per GB, or ~0.14 g per MB transferred on a first load. Applied to HTTP Archive 2025 mobile page-weight percentiles, this is the basis of the modeled chart below. SWDM v4 deliberately produces estimates about two-thirds lower than v3; the same page weight that the original post mapped to "1.76 g CO2e per MB" models to ~0.14 g/MB under the current standard. We present a simplified first-load figure; the full Website Carbon implementation further adjusts for caching and returning-visitor ratios.
- Known limits. Pass rates are over graded populations, smaller than raw detection counts. The carbon model is a global average — real emissions depend on the visitor's device, network, local grid mix, and the host's energy source, none of which this dataset observes. Readability uses Flesch scoring, calibrated for English. Counts are a live snapshot and drift as classification continues. Russian-language sites are excluded from all aggregates.
- Why these numbers differ from the 2026-03 original. The index grew from ~1.4M to ~3.4M URLs, so every share was recomputed. The server ranking corrected (Apache, not Cloudflare, leads). The carbon figures were relabeled as modeled estimates and recomputed under SWDM v4. Curated per-sector technology tables that could not be reproduced read-only were dropped.
The Scorecard
The technology footprint of the index, ranked by share. The pattern is visible before any carbon arithmetic: the heaviest options are at the top, the lightest at the bottom.
| Technology | Sites detected | Share of index | Type |
|---|---|---|---|
| WordPress | 1,062,054 | 31.6% | Dynamic CMS |
| jQuery | 299,665 | 8.9% | Legacy JS library |
| Medium | 292,392 | 8.7% | Hosted blog platform |
| Adobe Experience Manager | 116,767 | 3.5% | Enterprise CMS |
| Drupal | 35,645 | 1.1% | Dynamic CMS |
| Joomla | 28,269 | 0.8% | Dynamic CMS |
| Squarespace | 26,570 | 0.8% | Hosted site builder |
| Astro | 23,828 | 0.7% | Static generator |
| Next.js | 21,325 | 0.6% | Hybrid framework |
| Jekyll | 17,668 | 0.5% | Static generator |
| Shopify | 15,424 | 0.5% | E-commerce |
| Hugo | 12,081 | 0.4% | Static generator |
| Angular | 10,361 | 0.3% | SPA framework |
| React | 10,310 | 0.3% | SPA framework |
| Gatsby | 3,606 | 0.1% | Static generator |
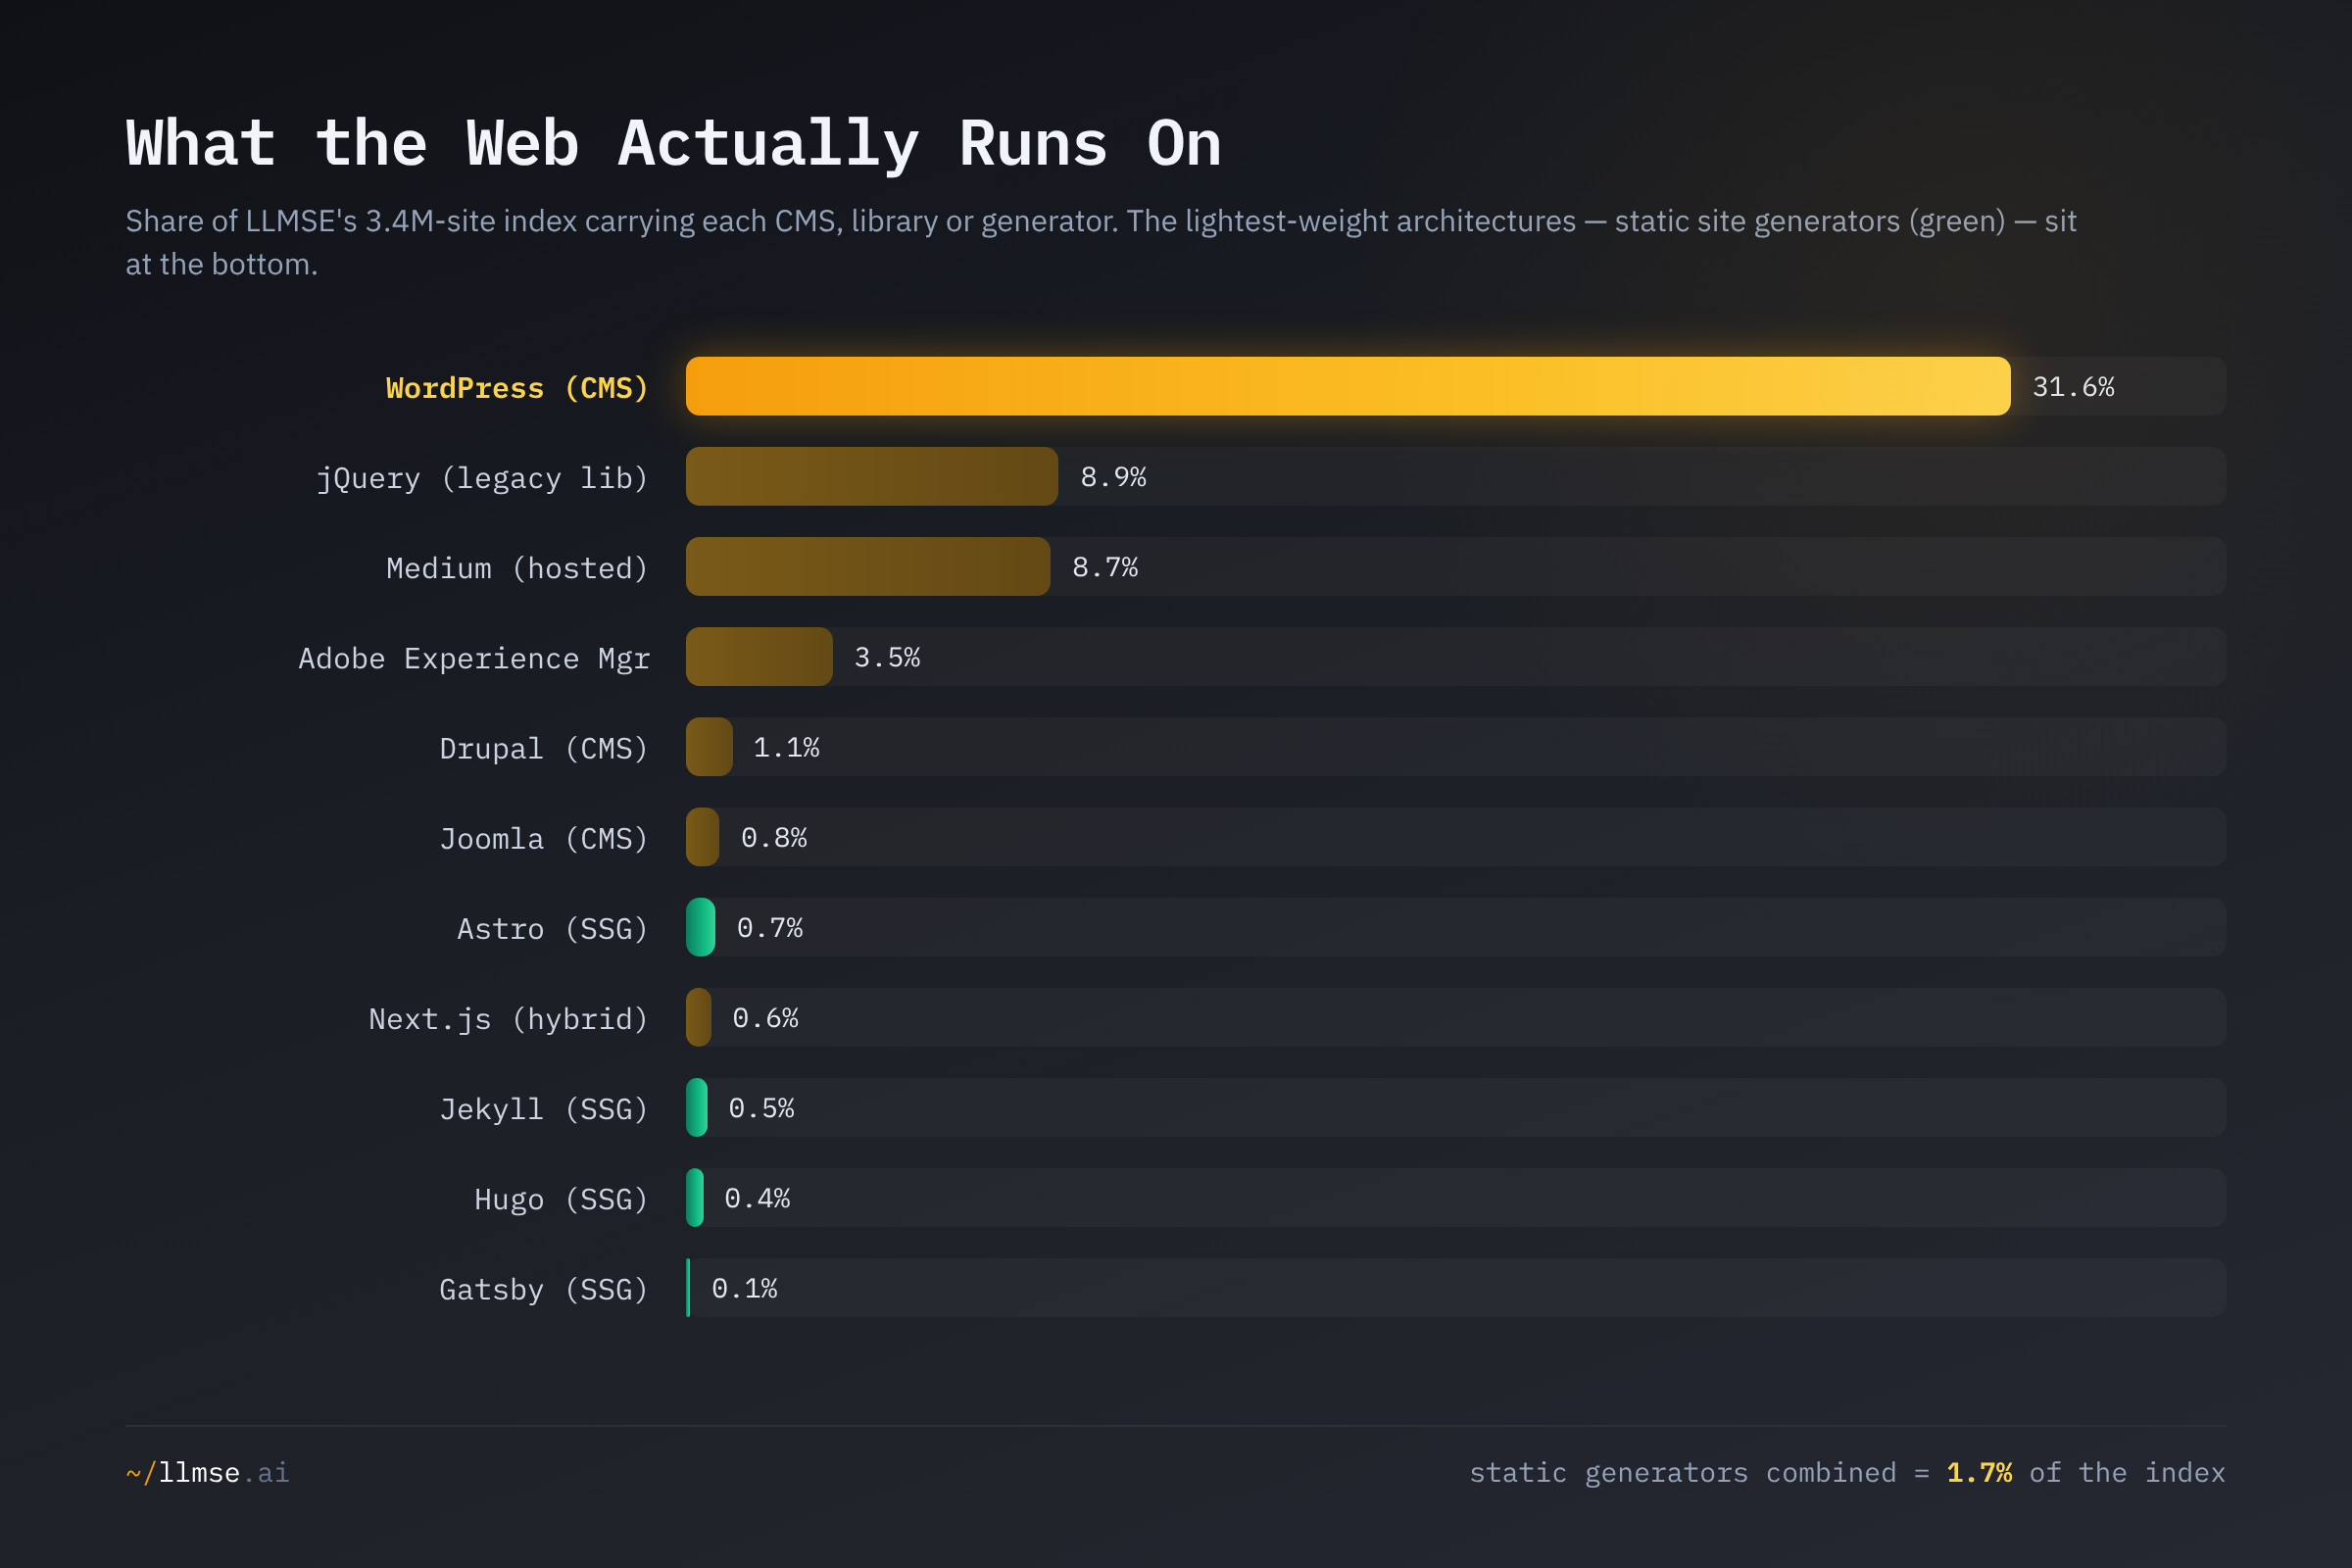
WordPress alone accounts for 31.6% of the index — nearly six times the other major CMS platforms (AEM, Drupal, Joomla) combined — and jQuery, a library largely superseded once ES6 standardised the DOM APIs it was built to paper over, still appears on 8.9%. The four dedicated static site generators (Astro, Jekyll, Hugo, Gatsby) together reach 1.7%. This is the inversion in one chart: the architectures the carbon models reward sit at the bottom of the adoption table, and the ones they penalise sit at the top. The rest of this post works through why each layer of the stack repeats the same shape — and what it costs, in modeled terms.
Static vs Dynamic: The Architecture That Isn't There
The clearest efficiency divide in web technology is between static and dynamic delivery. A static site generator (Hugo, Jekyll, Astro, Gatsby) builds every page once at deploy time; the server then hands over plain HTML with no per-request database query or template execution. A dynamic CMS (WordPress, Drupal, Joomla) runs server-side code and queries a database on every uncached pageview. The compute is paid once at build time versus once per visitor — a difference that shows up both in origin energy and, indirectly, in the page weight each tends to produce.
| Architecture | Sites | Share of index |
|---|---|---|
| Dynamic CMS (WordPress + AEM + Drupal + Joomla) | 1,242,735 | 36.9% |
| jQuery (legacy library) | 299,665 | 8.9% |
| Static generators (Astro + Jekyll + Hugo + Gatsby) | 57,183 | 1.7% |
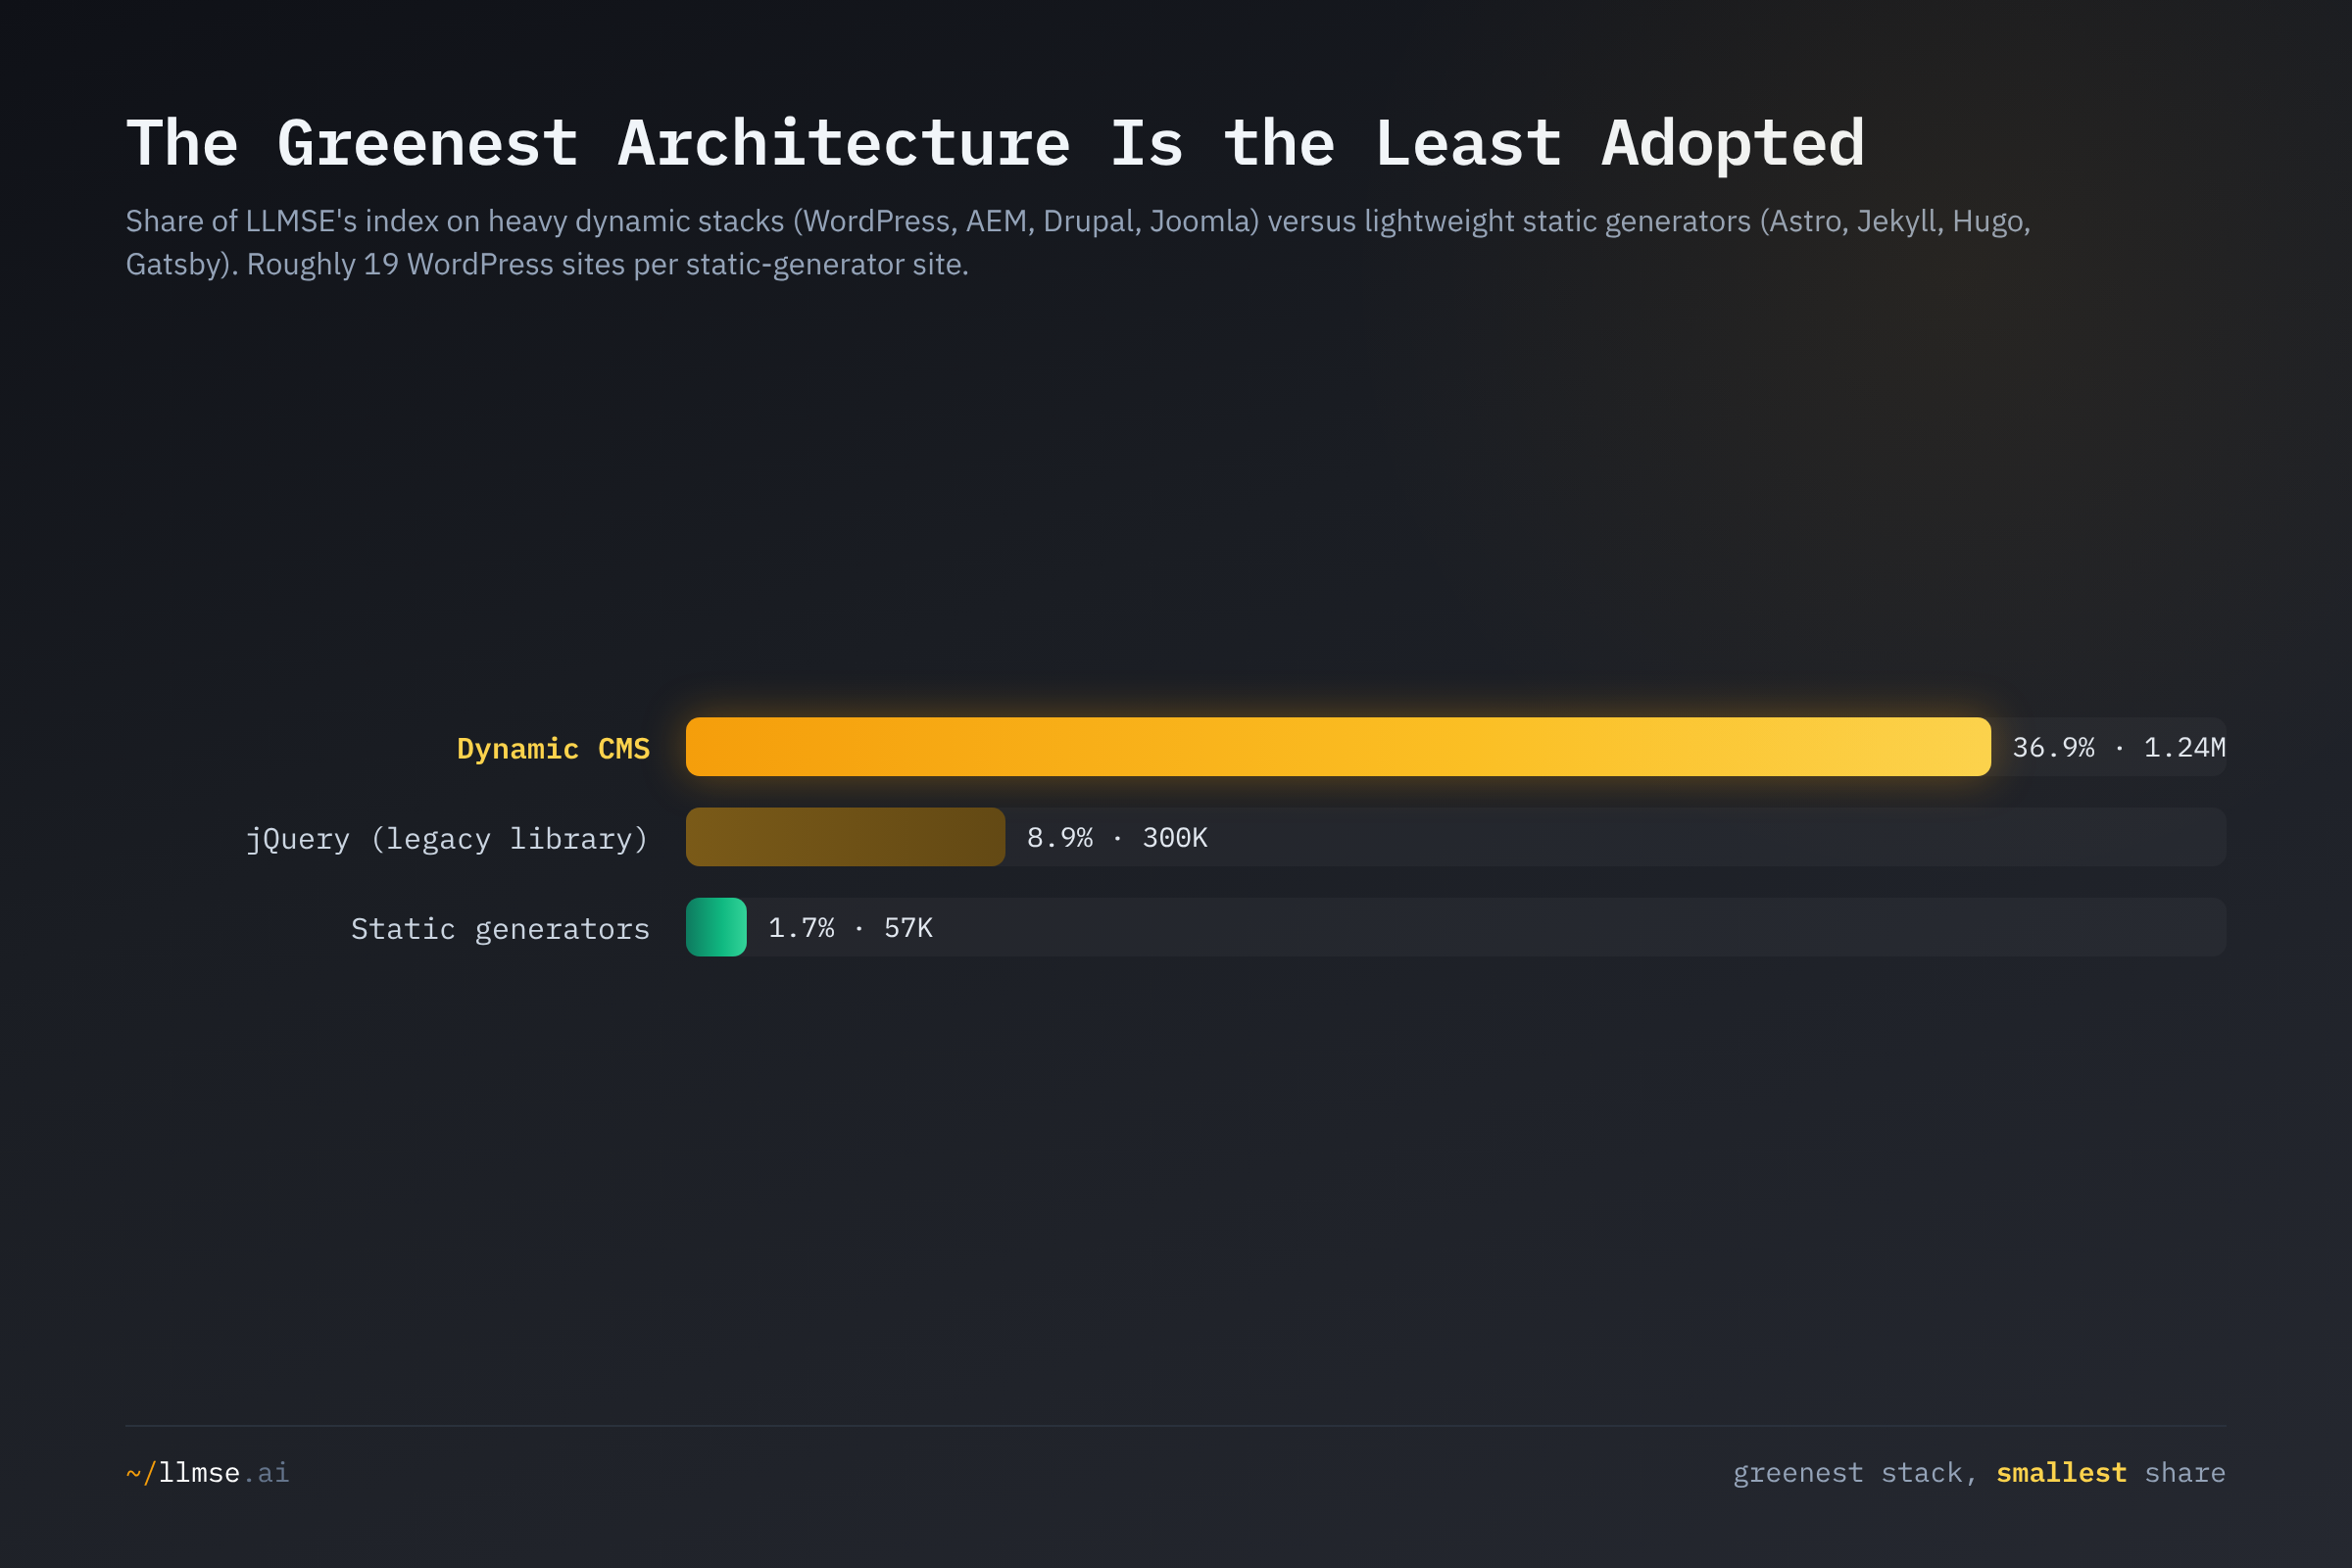
Dynamic CMS platforms outnumber static generators by more than 21 to 1, and WordPress alone outnumbers all four static generators by roughly 19 to 1. That ratio is the practical shape of the web's carbon profile: the default path for a new site is a database-backed CMS, and the lightweight path is a rounding error. This is a descriptive fact, not a verdict on any single site — a well-cached WordPress install can serve light pages, and a static generator can still ship a bloated JavaScript bundle. But across millions of sites, the architecture that minimises per-request compute and tends toward leaner output is the one almost no one picks.
The Weight of JavaScript
JavaScript is the web's most expensive payload per byte. Unlike images — which decode in hardware and lazy-load — JavaScript must be downloaded, parsed, compiled, and executed on the CPU, every step drawing energy. The HTTP Archive 2025 Web Almanac puts the median mobile page's JavaScript at 632 KB, second only to images by weight. Under the SWDM v4 model, that median JavaScript payload alone carries a modeled ~0.09 g CO2e per first load — before a single image, font, or stylesheet.
jQuery is the legacy face of that weight, and its grade profile is revealing — though not the across-the-board failure the original post claimed.
| Metric | jQuery | Web average |
|---|---|---|
| SEO pass (A+B+C) | 0.7% | 1.9% |
| AEO pass (A+B+C) | 0.1% | 1.5% |
| WCAG pass (A+B+C) | 31.1% | 43.8% |
| Privacy pass (A+B+C) | 19.2% | 37.0% |
| Readability pass (A+B) | 43.5% | 32.8% |
jQuery sites pass technical SEO at 0.7% and AI-answer optimization at just 0.1% — far below the web average, and on AEO among the lowest of any major technology in the index — and they trail the web on accessibility and privacy. They do not trail everywhere: jQuery's readability pass rate (43.5%) is actually above the web average, so the honest reading is narrower than "outdated across every dimension." jQuery correlates with the older, heavier end of the web — sites that load a legacy library alongside whatever modern code duplicates it — and that bloat is consistent with weak discoverability and accessibility, not with universally bad content. The point for carbon is structural: jQuery's persistence on 8.9% of the index is 300,000 sites shipping a library their pages would be lighter without.
Quality as an Efficiency Proxy
If leaner markup correlates with both quality and lower modeled emissions, the static generators should out-score the dynamic CMS platforms on the dimensions that reward clean structure. They do — decisively on SEO, and at the top of the field on accessibility.
| Platform | Type | SEO pass | WCAG pass | EEAT pass |
|---|---|---|---|---|
| Astro | SSG | 4.9% | 36.9% | 61.4% |
| Gatsby | SSG | 4.9% | 60.1% | 62.9% |
| Jekyll | SSG | 4.8% | 66.1% | 57.6% |
| Hugo | SSG | 4.1% | 55.1% | 59.8% |
| Next.js | Hybrid | 4.3% | 54.3% | 47.8% |
| WordPress | CMS | 2.8% | 45.1% | 59.8% |
| Drupal | CMS | 2.6% | 49.2% | 65.6% |
| Joomla | CMS | 0.4% | 35.5% | 62.4% |
| Web average | — | 1.9% | 43.8% | 45.4% |
Every static generator passes technical SEO at 4–5%, roughly double WordPress's 2.8% and an order of magnitude above Joomla's 0.4%. Astro and Gatsby lead at 4.9%. On accessibility the established generators dominate — Jekyll at 66.1% and Gatsby at 60.1% are the highest WCAG pass rates of any platform here — while Astro (36.9%) is the exception that proves leanness is necessary but not sufficient. Notably, WordPress's own WCAG pass rate has risen to 45.1% (the original recorded 36.4% on a smaller, earlier sample), so the gap to the static leaders has narrowed even as it persists. The correlation holds in the expected direction: the architectures that produce the cleanest, lightest markup also tend to be the most findable and the most accessible. Quality and leanness travel together — which is the same reason quality and modeled carbon travel together. (For the platform-by-platform quality picture, see The CMS Quality Gap and The WordPress Quality Paradox.)
The Server Layer: Apache Leads, the Edge Optimizes
The server answering each request is the third architecture choice — and the layer where the original post had its ranking backwards. Corrected against the 3.17M sites with a detected server:
| Server | Sites | Share | SEO pass | Type |
|---|---|---|---|---|
| Apache | 927,366 | 29.2% | 1.2% | Traditional |
| nginx | 834,798 | 26.3% | 1.3% | Traditional |
| Cloudflare | 622,219 | 19.6% | 4.1% | CDN/edge |
| LiteSpeed | 260,272 | 8.2% | 1.4% | Traditional |
| GitHub Pages | 88,666 | 2.8% | 2.1% | Static/edge |
| OpenResty | 69,808 | 2.2% | 0.7% | Traditional |
| IIS | 54,091 | 1.7% | 1.1% | Traditional |
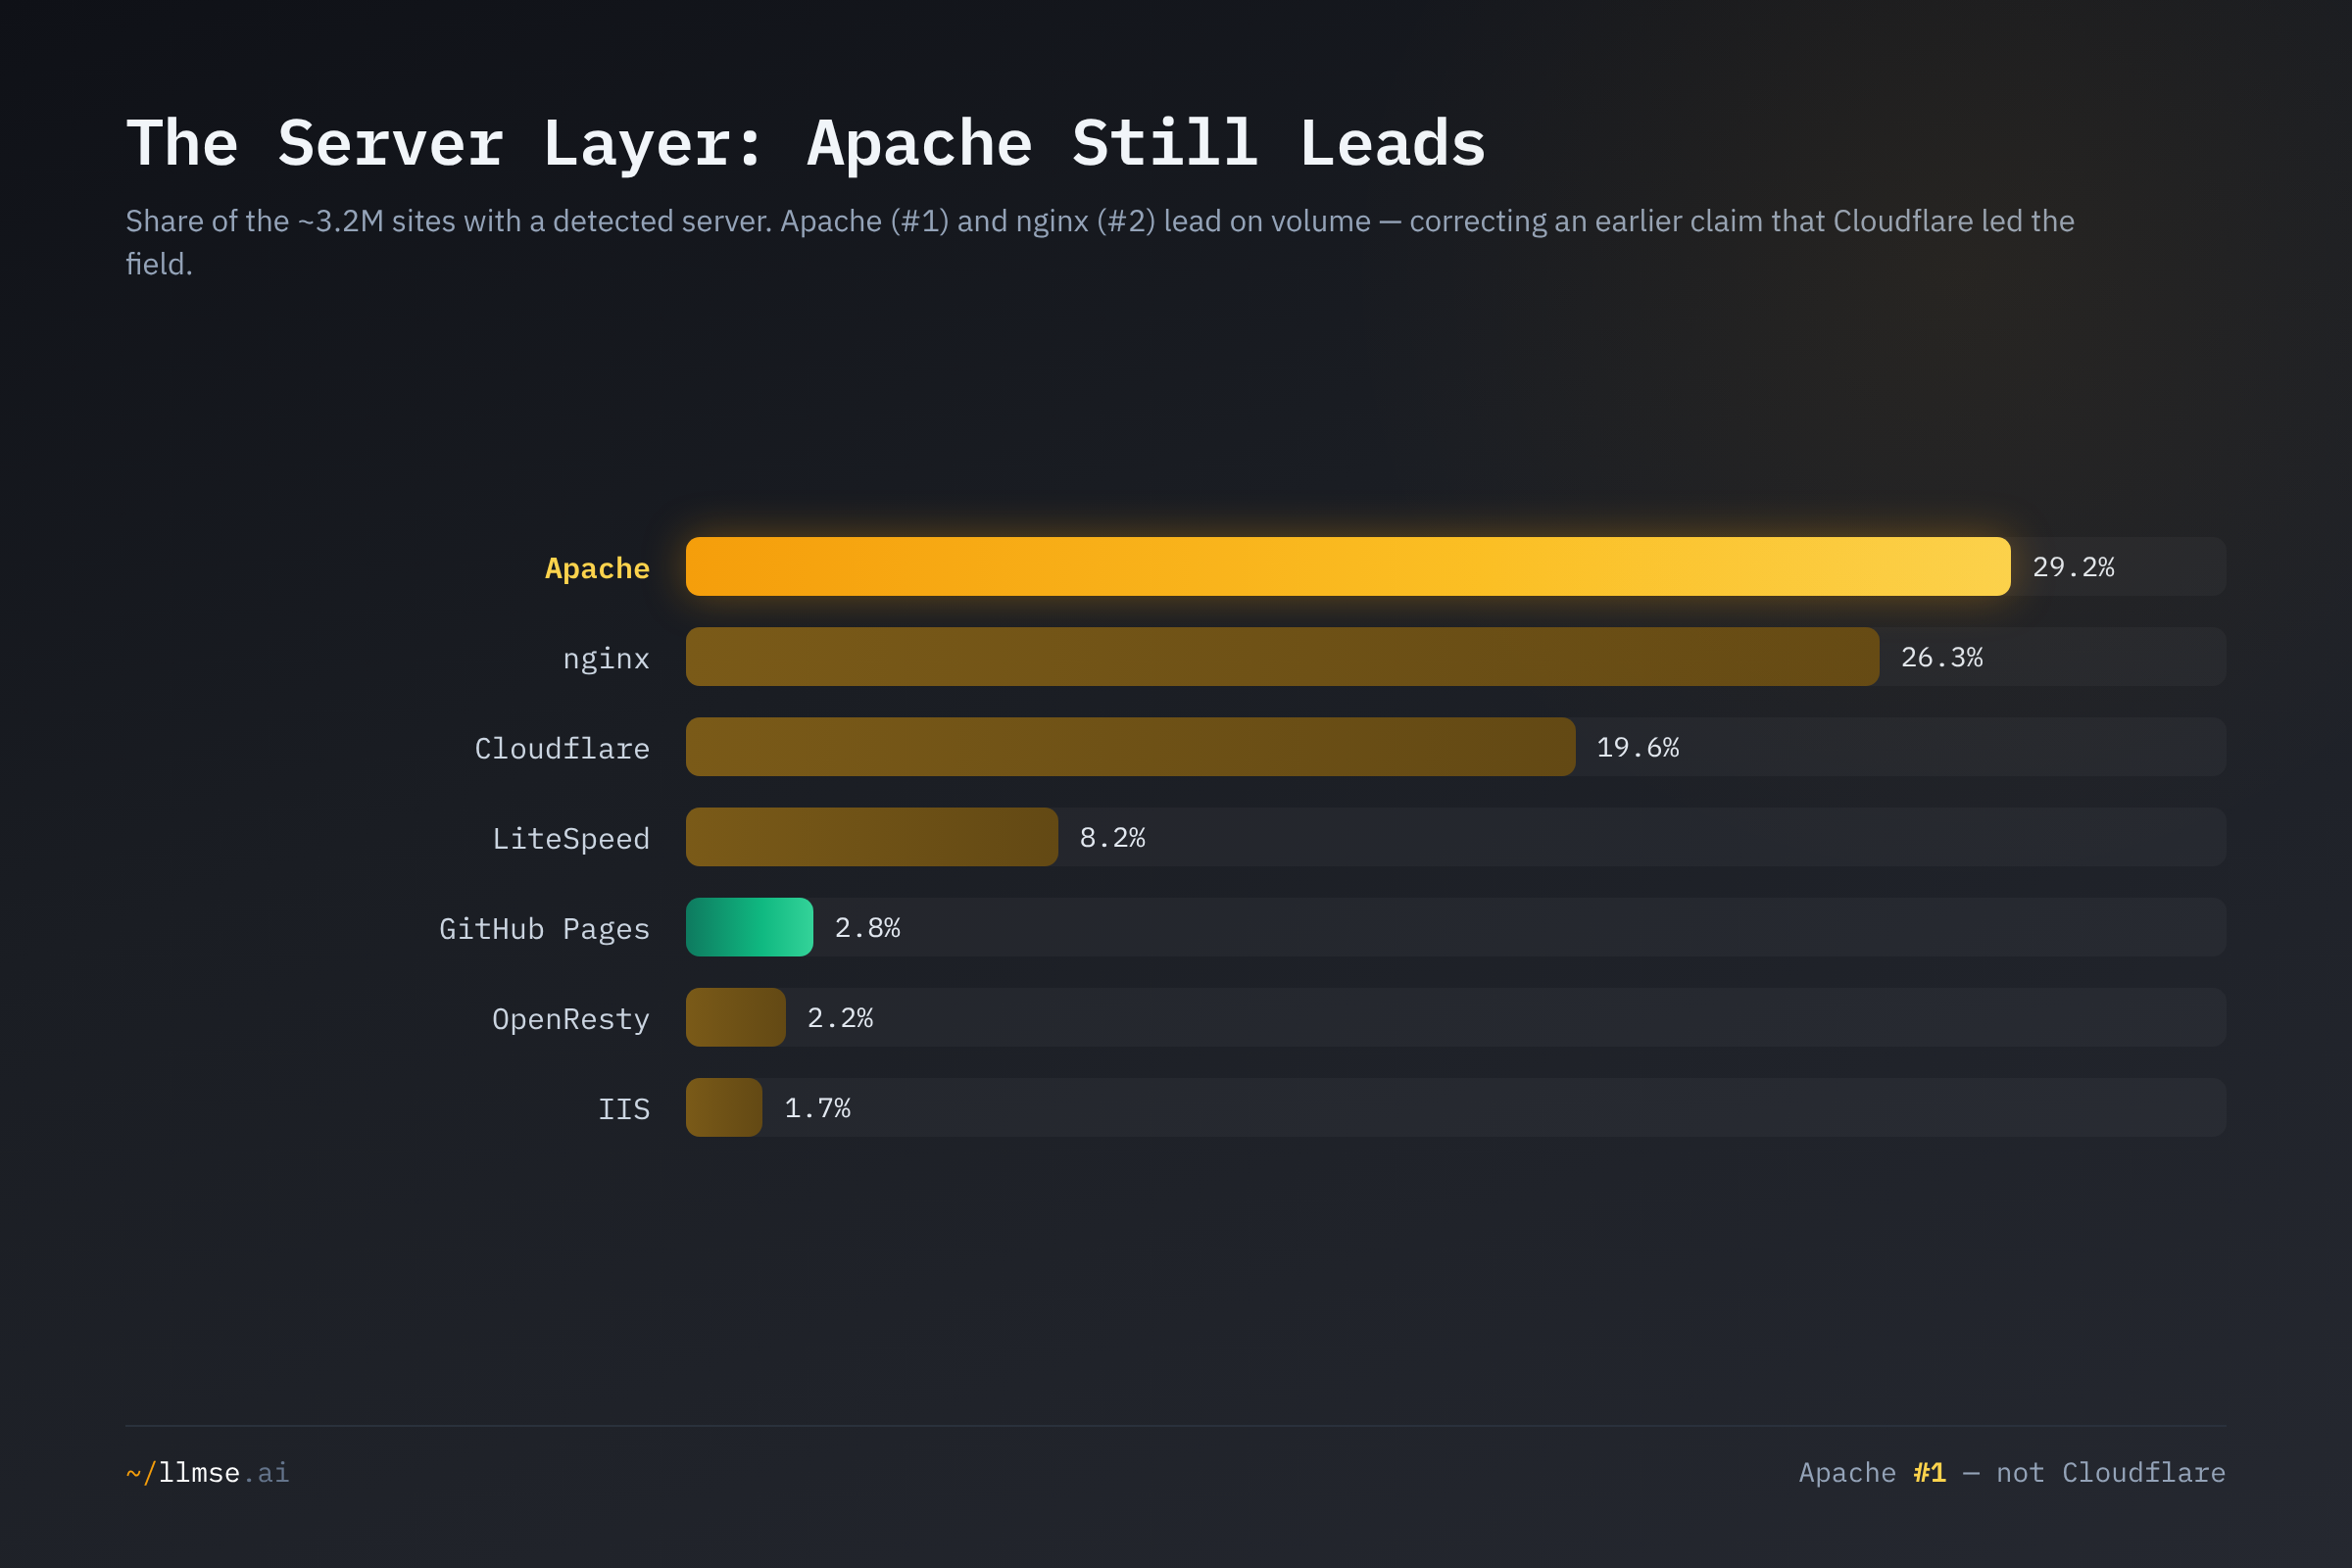
Apache leads the server layer at 29.2%, nginx is second at 26.3%, and Cloudflare is third at 19.6% — not the "Cloudflare leads" ordering the original reported. The correction matters for the carbon argument because of what sits underneath it: the two highest-share servers, Apache and nginx, post the lowest SEO pass rates (1.2% and 1.3%), while the edge platforms below them score several times higher — Cloudflare 4.1%, Vercel 6.3% and Netlify 5.4% (each on smaller populations). The same inversion repeats: the most-adopted infrastructure is the least optimised, and the edge-cached delivery that the carbon models favour — content served from the nearest node rather than round-tripping to a single origin — remains a minority. We state this as a correlation, not proof that the server causes the SEO outcome; CDN-edge hosting and modern build practices tend to be chosen together.
The Modeled Carbon Cost
What does the weight difference between a lean static page and a bloated one actually model to? Applying SWDM v4 (0.30 kWh/GB × 494 gCO2e/kWh ≈ 148 gCO2e/GB) to the HTTP Archive 2025 mobile page-weight percentiles gives a transparent first-load estimate at each point of the distribution.
| Page-weight band (HTTP Archive, mobile) | Page weight | Modeled CO2e / pageview |
|---|---|---|
| Lean static (p10) | 0.5 MB | 0.07 g |
| Light (p25) | 1.1 MB | 0.16 g |
| Median page (p50) | 2.1 MB | 0.31 g |
| Heavy (p75) | 4.1 MB | 0.58 g |
| Bloated (p90) | 8.3 MB | 1.18 g |
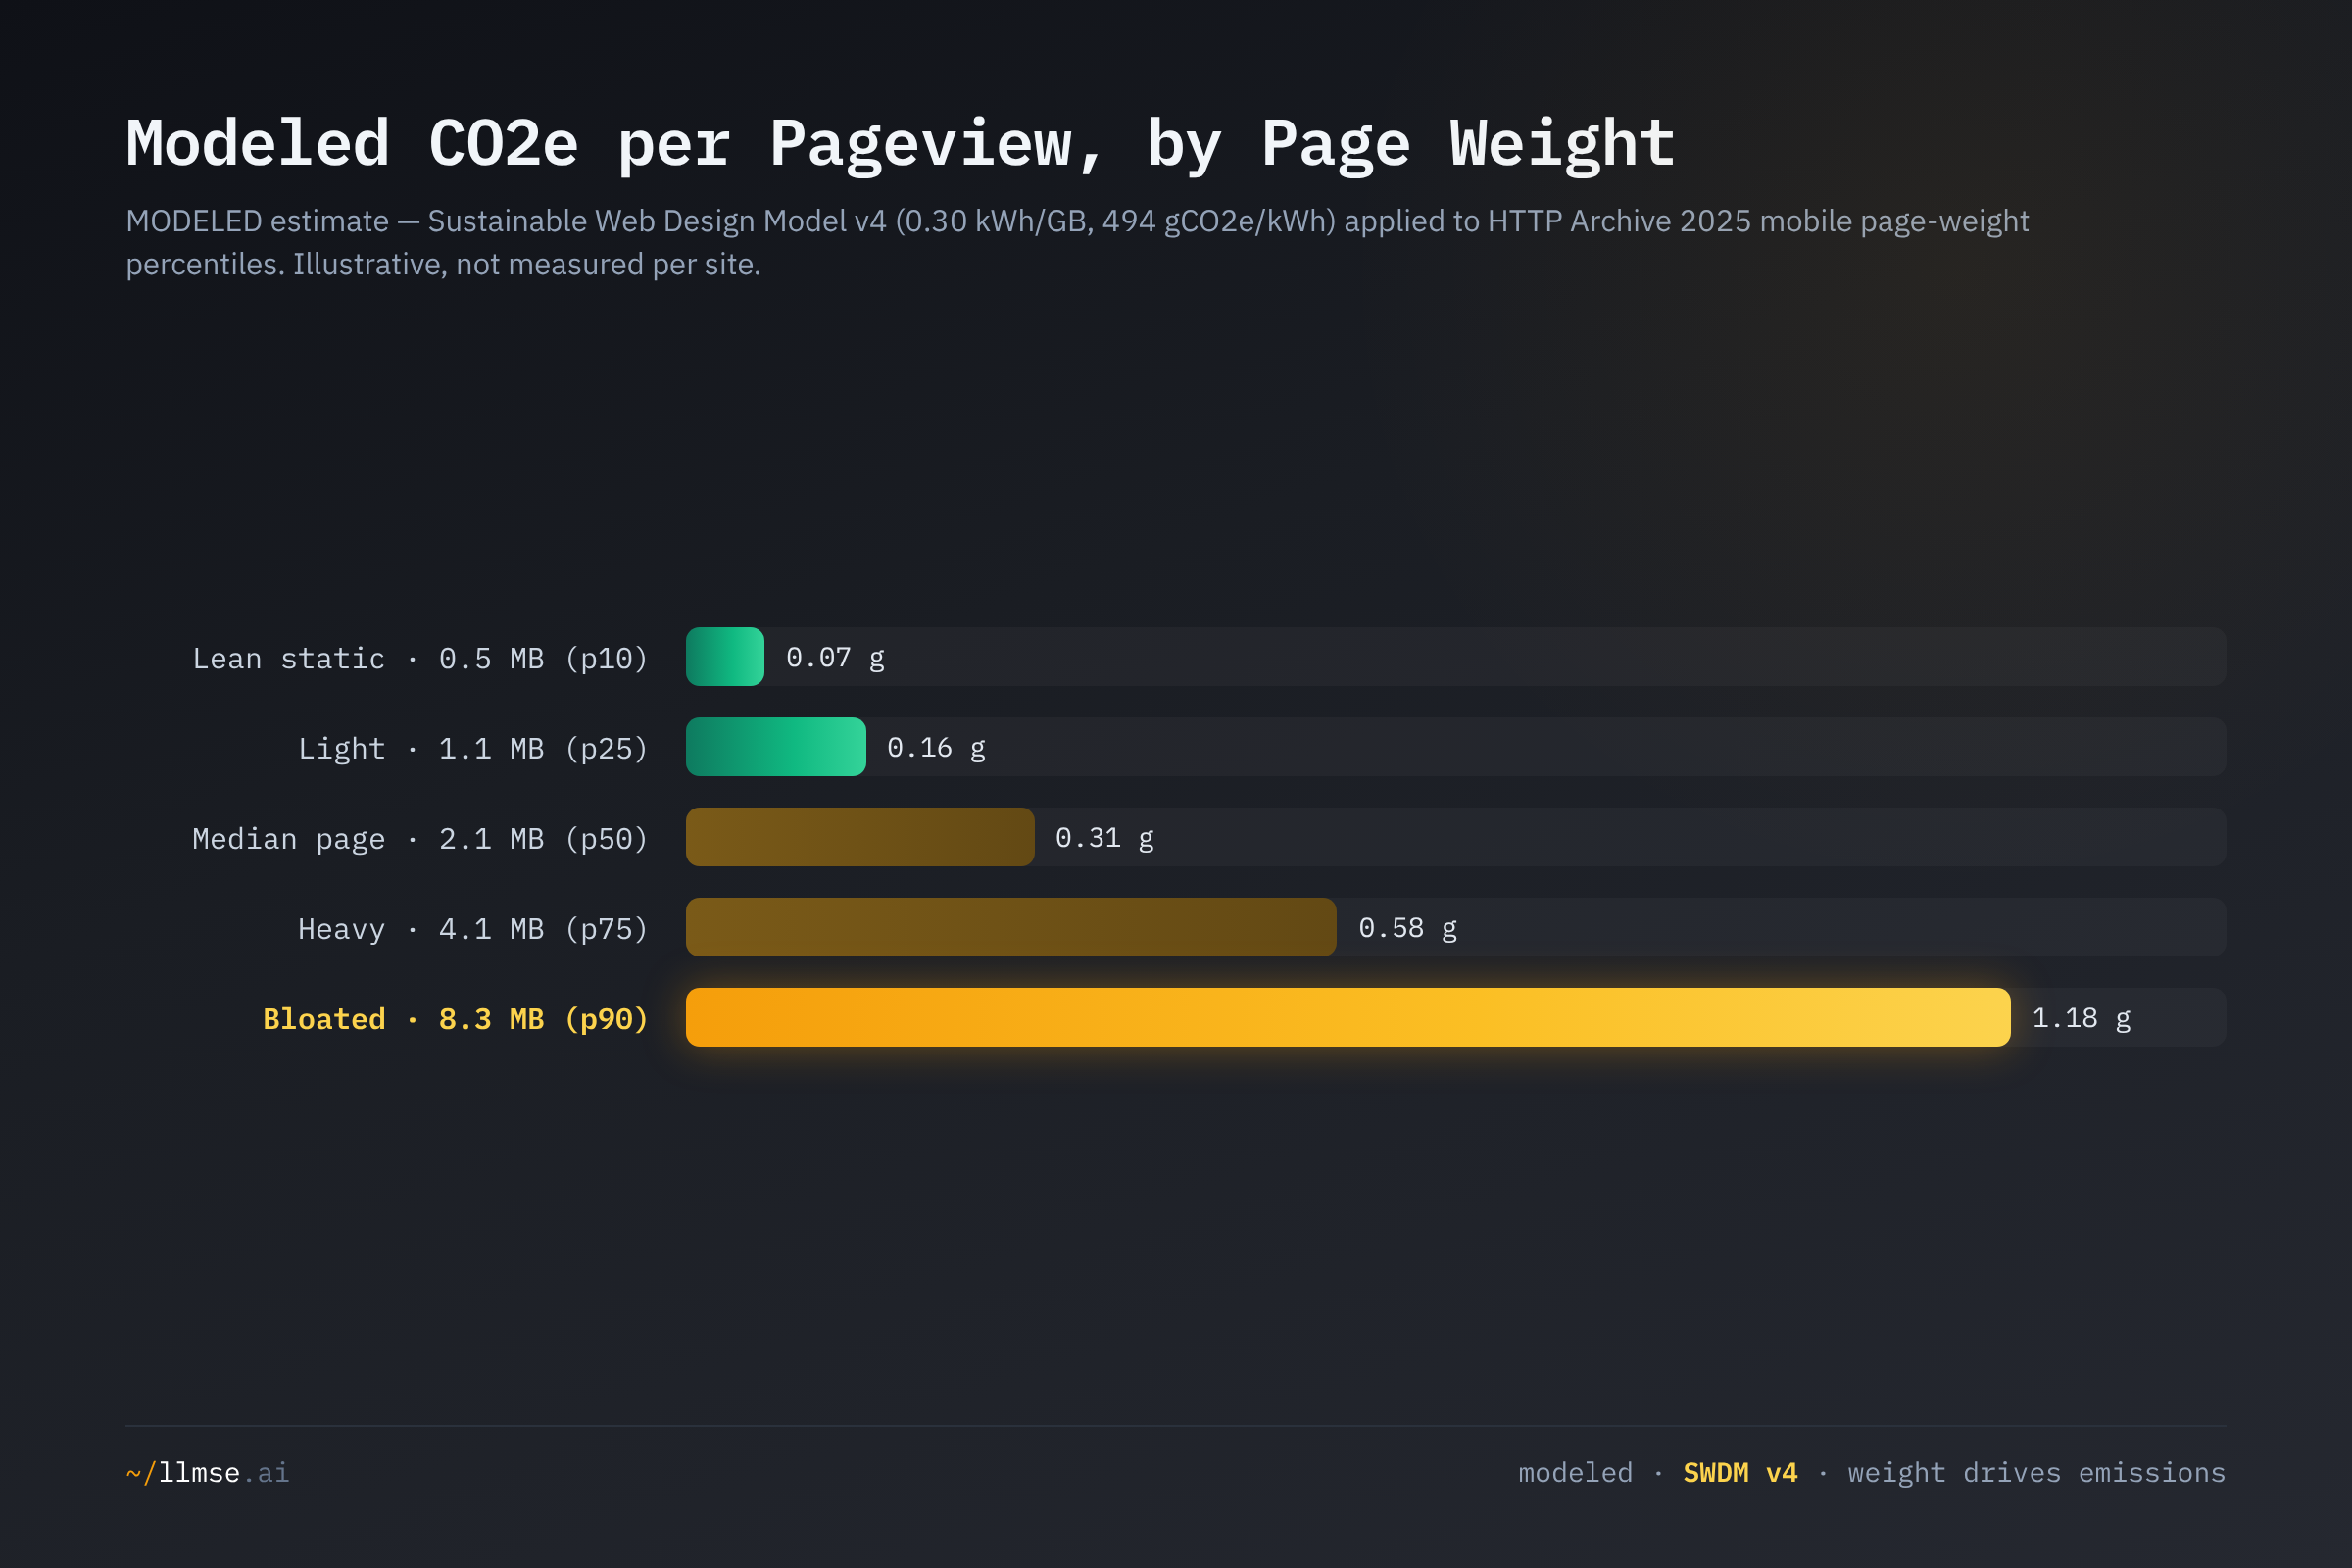
A page at the heaviest decile (8.3 MB) models to roughly 1.18 g CO2e per pageview — about 17 times the 0.07 g of a lean page at the lightest decile. These are modeled estimates, not measurements: the model maps bytes to grams using global-average energy and grid intensities, and a real page's footprint depends on the visitor's device, network, and grid. But the direction is exact and the driver is page weight, which is exactly what architecture sets. A static generator that emits 0.5 MB of HTML sits at the green end of this curve; a WordPress install layered with jQuery, a slider plugin, and an un-lazy-loaded image grid sits at the heavy end. The architecture choice is, in the model's terms, a multiplier on every pageview the site will ever serve — and the multiplier compounds across the billions of pageviews the web handles daily.
What's at Stake
- The default is the heavy path. Dynamic CMS platforms outnumber static generators ~21 to 1, so the web's modal new site starts at the wrong end of the page-weight curve — a structural bias toward higher modeled emissions that no individual hosting choice reverses.
- JavaScript bloat is a recurring tax. 300,000 sites still ship jQuery, and the median page carries 632 KB of JavaScript (a modeled ~0.09 g per load before anything else renders). Unlike images, that weight is paid in CPU on every device, every visit.
- Efficiency and quality are the same investment. Static generators lead both SEO and accessibility while sitting at the light end of the carbon model. Treating sustainability as a trade-off against quality misreads the data — the engineering that produces fast, findable, accessible pages is the engineering that produces light ones.
- Reporting pressure is arriving, and it points upstream. The EU Corporate Sustainability Reporting Directive brings digital operations into scope-3 disclosure, and the W3C's Web Sustainability Guidelines (80 guidelines, 226 success criteria) establish the standard regulation will likely reference. Both push the question past "is the hosting green?" toward "why does each page ship this much?" — and the Green Web Foundation's 2026 State of the Fossil-Free Internet report warns that hyperscaler energy disclosure is getting worse, leaving page weight as the variable site owners can actually control.
What Would Help
- Site owners: weigh your page before you offset it. The cheapest decarbonisation is bytes you never send. Run your URL through a page-weight and quality check at llmse.ai/classify and compare against the 2.1 MB median — if you are above the 4.1 MB (p75) line, architecture, not hosting, is where the modeled savings are.
- Developers: question the dynamic default. Most content sites do not need per-request database rendering. A static generator (Astro, Hugo, Jekyll, Gatsby) or pre-rendered hybrid eliminates origin compute per visitor and tends to ship lighter pages — and, in this data, passes SEO at roughly double WordPress's rate. The greenest request is the one the server answers from cache.
- Front-end teams: retire the legacy layer. 300,000 jQuery sites are carrying a library modern browsers made optional. Auditing and removing duplicated JavaScript is a direct page-weight reduction that the SEO and AEO grades reward (jQuery passes both at the bottom of the field).
- Platform and CMS vendors: make the light path the default. WordPress's WCAG pass rate rose to 45.1% as the ecosystem improved defaults; the same is possible for page weight. Ship leaner themes, lazy-load by default, and surface a per-page weight budget in the admin UI.
- Compliance and procurement teams: treat page weight as a reportable metric. As CSRD-style scope-3 disclosure expands, "we use a heavy CMS because we always have" is a weak answer. Make modeled per-pageview emissions — page weight × a published model such as SWDM v4 — part of how you evaluate a stack, alongside the quality dimensions in the cross-industry report card.
This analysis was conducted using LLMSE, which has classified over 3.4 million websites across SEO, EEAT, AEO, WCAG accessibility, readability, GARM brand safety, and privacy dimensions, with technology detection covering 388+ web technologies. Technology shares reflect live detection counts in the index as of June 2026. All carbon figures are modeled estimates derived from the Sustainable Web Design Model v4, IEA data-centre energy reporting, and HTTP Archive page-weight statistics — they are not measurements of any individual site. To analyze your own site across every dimension in this post, visit llmse.ai/classify.