The Multilingual Quality Divide: SEO, Trust, and Accessibility Across 17 Languages and 3.4 Million Websites
Update — 2026-06-29: Refreshed against LLMSE's current index of 3.4 million classified URLs (up from ~1.5M at first publication) and expanded to seven dimensions, adding AEO (AI-answer optimization) and Privacy. All per-language numbers were recomputed on LLMSE's standard pass basis — A+B+C for SEO, AEO, EEAT, WCAG, and privacy; A+B for readability — so they are not directly comparable to the original post's top-tier "A+B" figures, but every headline ranking survives: Dutch still leads trust (and still beats English), Vietnamese still leads SEO, Japanese still leads accessibility, and the readability "ranking" is still a Flesch English-calibration artifact. The one claim we dropped: the original called Vietnamese the least accessible language; on the standard A+B+C basis Vietnamese now sits second on WCAG, so that finding is retired. Russian-language sites are excluded throughout (sanctions). The core thesis — quality is multi-dimensional and English's volume does not make it the quality leader — holds, and the two new dimensions sharpen it.
Half of the web is in English, and most quality conversations stop there. According to W3Techs, English is the content language of 49.7% of all websites whose language is known (June 2026) — a plurality, not a monopoly. The other half, spread across dozens of languages and billions of users, is rarely benchmarked on the things that actually decide whether a page is findable, trustworthy, or usable. International SEO is mostly discussed in terms of hreflang tags and translation workflows, not measured quality.
The prevailing assumption is that English is the quality standard the rest of the web is catching up to — that the markets with the most money and the most mature web cultures (English, German, the Nordics) produce the best sites, and that "quality" is one axis a page is either good or bad on. Neither holds up. Quality is at least seven loosely-correlated axes, and the language that leads one routinely trails on another.
We cross-referenced 17 content languages — every language with more than ~14,000 indexed URLs, together about 3.1 million sites — against SEO, AEO, EEAT (trust), WCAG accessibility, readability, privacy, and sentiment grades from LLMSE's automated pipeline, the same graders applied to the rest of the index. The point was to see what the aggregate data says about quality across the language map, not to score a handful of flagship sites in each market.
The result is a divide with no single winner. Dutch-language sites carry the strongest trust signals on the board and beat English outright. Vietnamese sites pass technical SEO at nearly seven times the English rate. Japanese builds the most accessible web. English — 61% of our index — leads none of the six quality dimensions, landing mid-pack on one after another. And the readability scores, which appear to rank Korean and Japanese far above Spanish and Italian, measure nothing of the kind: they are an artifact of a formula calibrated for English.
The Data
LLMSE auto-detects a content language for every URL it classifies. The 17 languages below each have enough indexed sites to support reliable cross-references. Counts are raw indexed URLs; the share column is of the ~3.34M-URL index.
| Rank | Language | Indexed URLs | Share of index |
|---|---|---|---|
| 1 | English | 2,040,829 | 61.1% |
| 2 | German | 288,676 | 8.6% |
| 3 | French | 130,764 | 3.9% |
| 4 | Dutch | 116,976 | 3.5% |
| 5 | Spanish | 98,891 | 3.0% |
| 6 | Japanese | 73,541 | 2.2% |
| 7 | Portuguese | 69,780 | 2.1% |
| 8 | Chinese | 58,276 | 1.7% |
| 9 | Polish | 49,794 | 1.5% |
| 10 | Czech | 34,532 | 1.0% |
| 11 | Italian | 24,956 | 0.7% |
| 12 | Danish | 24,765 | 0.7% |
| 13 | Vietnamese | 24,511 | 0.7% |
| 14 | Swedish | 22,927 | 0.7% |
| 15 | Turkish | 21,630 | 0.6% |
| 16 | Indonesian | 16,152 | 0.5% |
| 17 | Korean | 14,234 | 0.4% |
English dominates our index even more than it dominates the web. At 61.1% of classified URLs, English is over-represented relative to W3Techs' 49.7% content-language share — a crawl-frontier effect: LLMSE discovers sites by following links, and the English-language web is the most densely interlinked. The figure is a property of the sample, not a claim about the true language mix of the web; we report rates within each language, which are unaffected by how many of each we hold. Beyond English, the long tail is real: German, French, Dutch, and Spanish each exceed 98,000 URLs, and the index carries 140+ detected languages in total. We exclude the empty/unknown language buckets and, under sanctions, all Russian-language sites.
Not every URL carries every grade. Pass rates are computed over the population actually graded on each dimension, against these web-wide baselines:
| Dimension | URLs graded (web-wide) | Web-average pass rate |
|---|---|---|
| SEO | 3,366,196 | 1.9% |
| AEO (AI answers) | 3,341,184 | 1.5% |
| EEAT (trust) | 3,362,068 | 45.4% |
| WCAG (accessibility) | 3,345,107 | 43.8% |
| Readability | 3,345,258 | 32.8% |
| Privacy | 3,339,371 | 37.0% |
Methodology
This post makes quantitative comparisons across languages, so the definitions and limits matter.
- Grades and "pass." Each site is graded A-F by a dedicated automated analyzer (there is no E grade). "Pass" means A+B+C for SEO, AEO, EEAT, WCAG, and Privacy, and A+B for Readability (a Flesch Reading Ease score of roughly 50+, ≈ 8th-grade level or below). SEO grades technical fundamentals; AEO grades answer-extractability and AI-citation signals; EEAT grades experience/expertise/authoritativeness/trust signals; WCAG covers automated accessibility checks (~30-40% of WCAG 2.1 Level A — manual testing is required for full conformance); Privacy grades consent gating, policy presence, and tracker behavior. Sentiment is a separate Good/Neutral/Bad classification, not an A-F grade.
- Language detection is automated per URL and may misclassify mixed-language or boilerplate-heavy pages; it is a coarse proxy for market.
- Cross-references are computed as set intersections (Redis
ZINTERCARD) between a language index (lang-<Language>) and each grade index (e.g.seo-A). All counts are aggregate; no individual site is identified. - Known limits. Pass rates are over graded populations, which are smaller than raw language counts (e.g. English is SEO-graded on 2,026,489 of its 2,040,829 URLs). The graders were built around English-web conventions, which may disadvantage languages with different structural norms. The Readability grade uses Flesch scoring, which is calibrated for English and is invalid as a cross-language comparison — we treat the readability table as a worked example of that bias, not a quality ranking. Counts are a live snapshot and drift as classification continues.
- Why these numbers differ from the 2026-02 original. Two things changed. First, the graded population grew from ~1.5M to ~3.4M URLs; early grades were biased toward higher-quality, more-visible sites, so coverage broadened as classification continued. Second, and more important here: the original reported top-tier A+B rates for EEAT, WCAG, and SEO, while this rework uses LLMSE's standard A+B+C pass definition (matching every current post) for those dimensions and A+B for readability. Because A+B+C folds in the large "C" band, the absolute EEAT and WCAG figures are higher than the original's even though grading got stricter — so compare rankings, not absolute values, against the first edition.
The Scorecard
Pass rates by language, ordered by indexed site count. The standout (best) cell in each column is bolded; readability is shown but not bolded because it is not comparable across languages (see The Readability Artifact).
| Language | Sites | SEO | AEO | EEAT | WCAG | Read.* | Privacy |
|---|---|---|---|---|---|---|---|
| English | 2,040,829 | 1.5% | 2.0% | 44.7% | 45.6% | 29.6% | 39.2% |
| German | 288,676 | 2.9% | 0.4% | 41.1% | 48.7% | 31.3% | 67.2% |
| French | 130,764 | 3.5% | 0.7% | 50.7% | 43.0% | 35.2% | 27.5% |
| Dutch | 116,976 | 2.5% | 0.8% | 59.1% | 44.6% | 56.3% | 44.3% |
| Spanish | 98,891 | 2.0% | 0.8% | 54.0% | 35.1% | 5.8% | 27.1% |
| Japanese | 73,541 | 0.8% | 0.0% | 46.5% | 50.0% | 63.0% | 31.5% |
| Portuguese | 69,780 | 1.5% | 0.7% | 50.4% | 37.1% | 10.9% | 27.8% |
| Chinese | 58,276 | 1.1% | 0.2% | 40.1% | 34.8% | 53.1% | 5.8% |
| Polish | 49,794 | 2.3% | 0.7% | 42.1% | 41.8% | 18.5% | 17.7% |
| Czech | 34,532 | 1.7% | 0.3% | 48.6% | 42.2% | 63.0% | 19.5% |
| Italian | 24,956 | 1.7% | 1.1% | 58.3% | 32.4% | 3.3% | 53.2% |
| Danish | 24,765 | 2.1% | 0.4% | 34.4% | 43.8% | 59.0% | 21.0% |
| Vietnamese | 24,511 | 10.3% | 9.5% | 54.6% | 49.0% | 62.9% | 3.5% |
| Swedish | 22,927 | 3.9% | 0.8% | 35.3% | 46.5% | 46.4% | 19.8% |
| Turkish | 21,630 | 8.8% | 0.6% | 44.5% | 37.2% | 29.3% | 8.5% |
| Indonesian | 16,152 | 6.3% | 3.9% | 52.1% | 31.8% | 9.8% | 22.5% |
| Korean | 14,234 | 2.5% | 0.8% | 52.9% | 34.4% | 77.3% | 31.2% |
| Web average | 3.4M | 1.9% | 1.5% | 45.4% | 43.8% | 32.8% | 37.0% |
*Readability is Flesch A+B and is not comparable across languages; it is included to demonstrate the bias, not to rank.
The Superlatives
| Dimension | Best language | Rate | Lowest of the 17 | Rate |
|---|---|---|---|---|
| SEO | Vietnamese | 10.3% | Japanese | 0.8% |
| AEO | Vietnamese | 9.5% | Japanese | 0.0% |
| EEAT | Dutch | 59.1% | Danish | 34.4% |
| WCAG | Japanese | 50.0% | Indonesian | 31.8% |
| Privacy | German | 67.2% | Vietnamese | 3.5% |
No language leads more than two dimensions, and every leader has a conspicuous weakness. Vietnamese tops both discovery axes (SEO and AEO) but is dead last on privacy. Dutch owns trust but is unremarkable on discovery. Japanese builds the most accessible pages while posting the worst SEO and a rounding-error AEO. German leads privacy yet sits below the web average on trust. English — by far the largest language — leads nothing: it is at or near the web average on SEO, AEO, EEAT, and WCAG, and below average on privacy and readability. The rest of this report is the story of those gaps.
SEO and AEO: Vietnamese Wins Discovery, and the Reason Is Composition
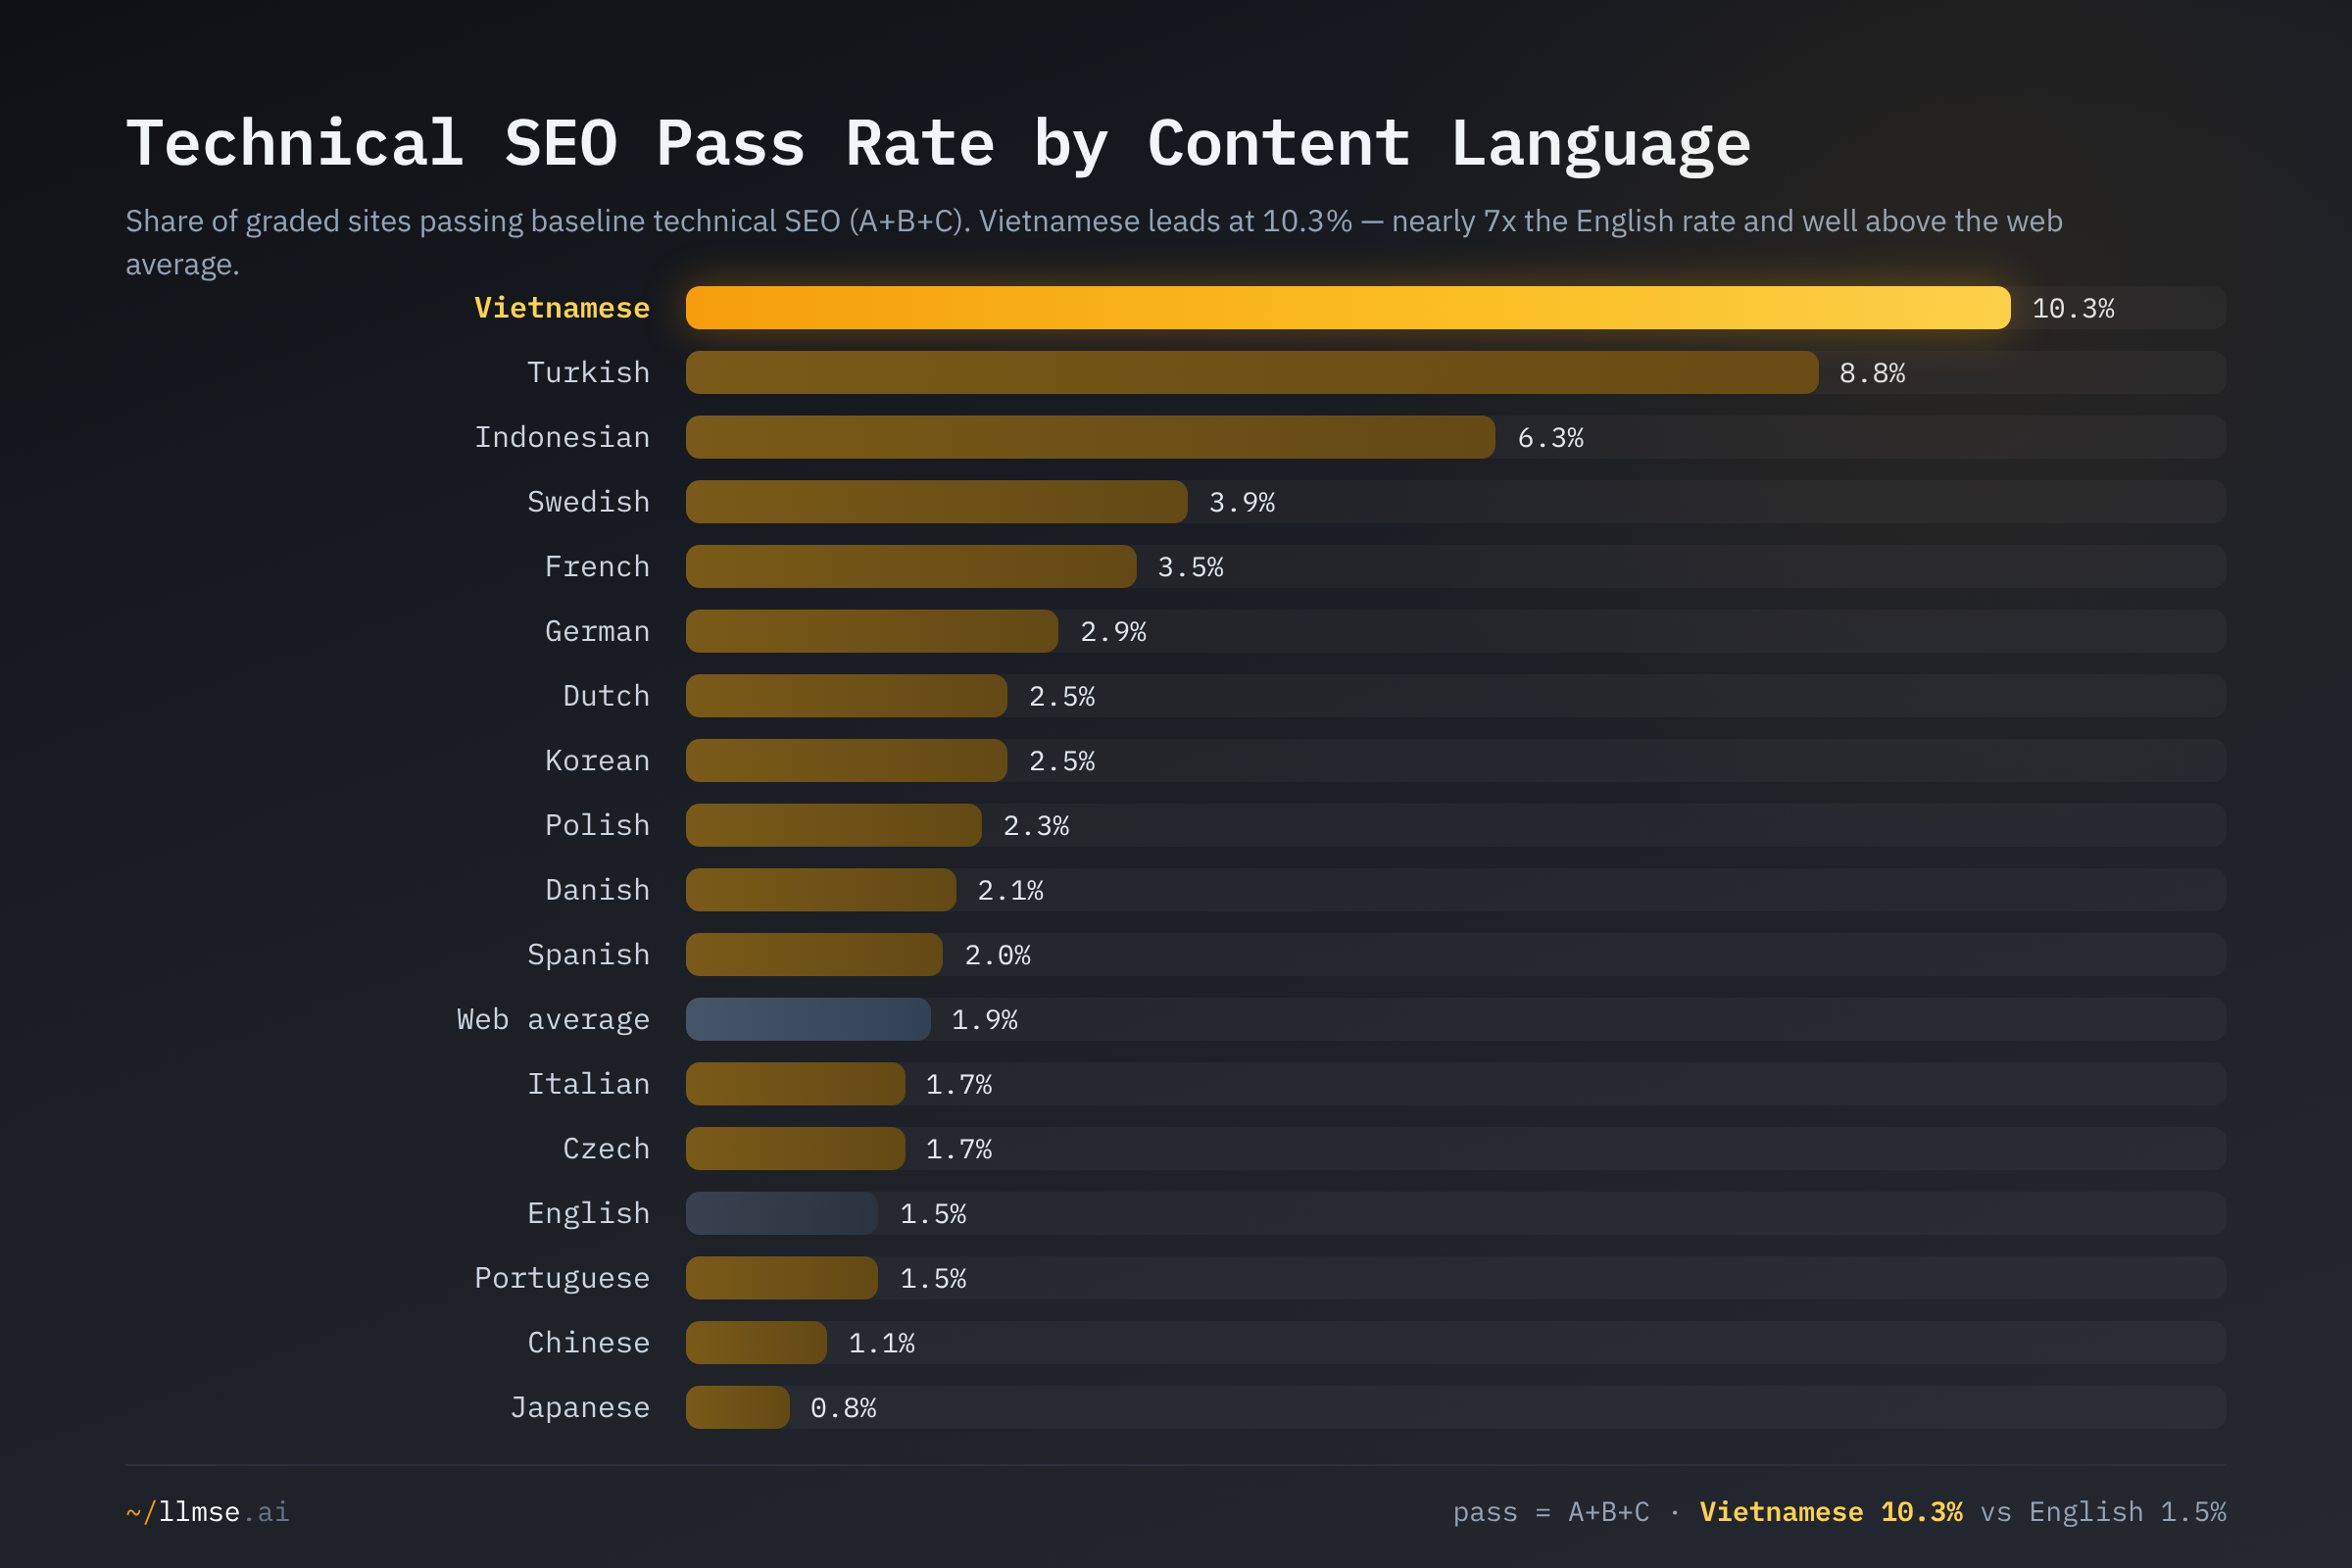
Vietnamese-language sites pass technical SEO at 10.3% and AEO at 9.5% — the top of both discovery axes, roughly seven times the English SEO rate (1.5%) and six times the web's AEO rate (1.5%). Turkish (8.8% SEO) and Indonesian (6.3% SEO, 3.9% AEO) round out a trio that towers over the Western-European and CJK languages, where SEO clusters between 0.8% and 3.9%.
This is not evidence that Vietnamese web developers are simply better at SEO. It is a composition effect, and it is reproducible. Cross-referencing each language against the Gambling category shows how skewed these samples are:
| Language | Indexed URLs | Gambling-categorized | Gambling share |
|---|---|---|---|
| Indonesian | 16,152 | 7,404 | 45.8% |
| Vietnamese | 24,511 | 7,546 | 30.8% |
| Turkish | 21,630 | 2,326 | 10.8% |
| English | 2,040,829 | 33,063 | 1.6% |
Nearly a third of indexed Vietnamese URLs — and almost half of Indonesian — are gambling sites, versus 1.6% for English. Gambling is the most search-optimized category on the web, and its non-English markets optimize hardest of all: Vietnamese-language gambling sites pass SEO at 30.9% and Turkish at 27.0%, as documented in The House Always Optimizes. When a third of a language's sample is the single most-optimized vertical online, that language's aggregate SEO rate is pulled sharply upward. The English web, by contrast, dilutes its commercial core with hundreds of millions of personal pages, blogs, and parked domains. The takeaway is the inverse of the obvious reading: the SEO leaderboard ranks what each language's indexed sites are made of, not how skilled its developers are. We state this as a correlation; content language is a coarse proxy for market, and these rates describe the sample's composition, not national capability.
Japanese anchors the bottom of both discovery axes — 0.8% SEO and an essentially-zero 0.0% AEO (20 passing sites out of 72,887). Japanese SEO and AEO conventions diverge from the Google-centric, schema-heavy patterns the graders reward, and the result is a discovery profile that looks weak by a Western yardstick even where the underlying sites are well-built.
EEAT: Dutch Beats English on Trust
EEAT measures the signals Google's Search Quality Rater Guidelines treat as evidence of experience, expertise, authoritativeness, and trustworthiness — author identity, organizational transparency, citations, and policy presence, scrutinized most heavily for "Your Money or Your Life" topics. On the standard A+B+C basis, the trust leaderboard does not put English on top.
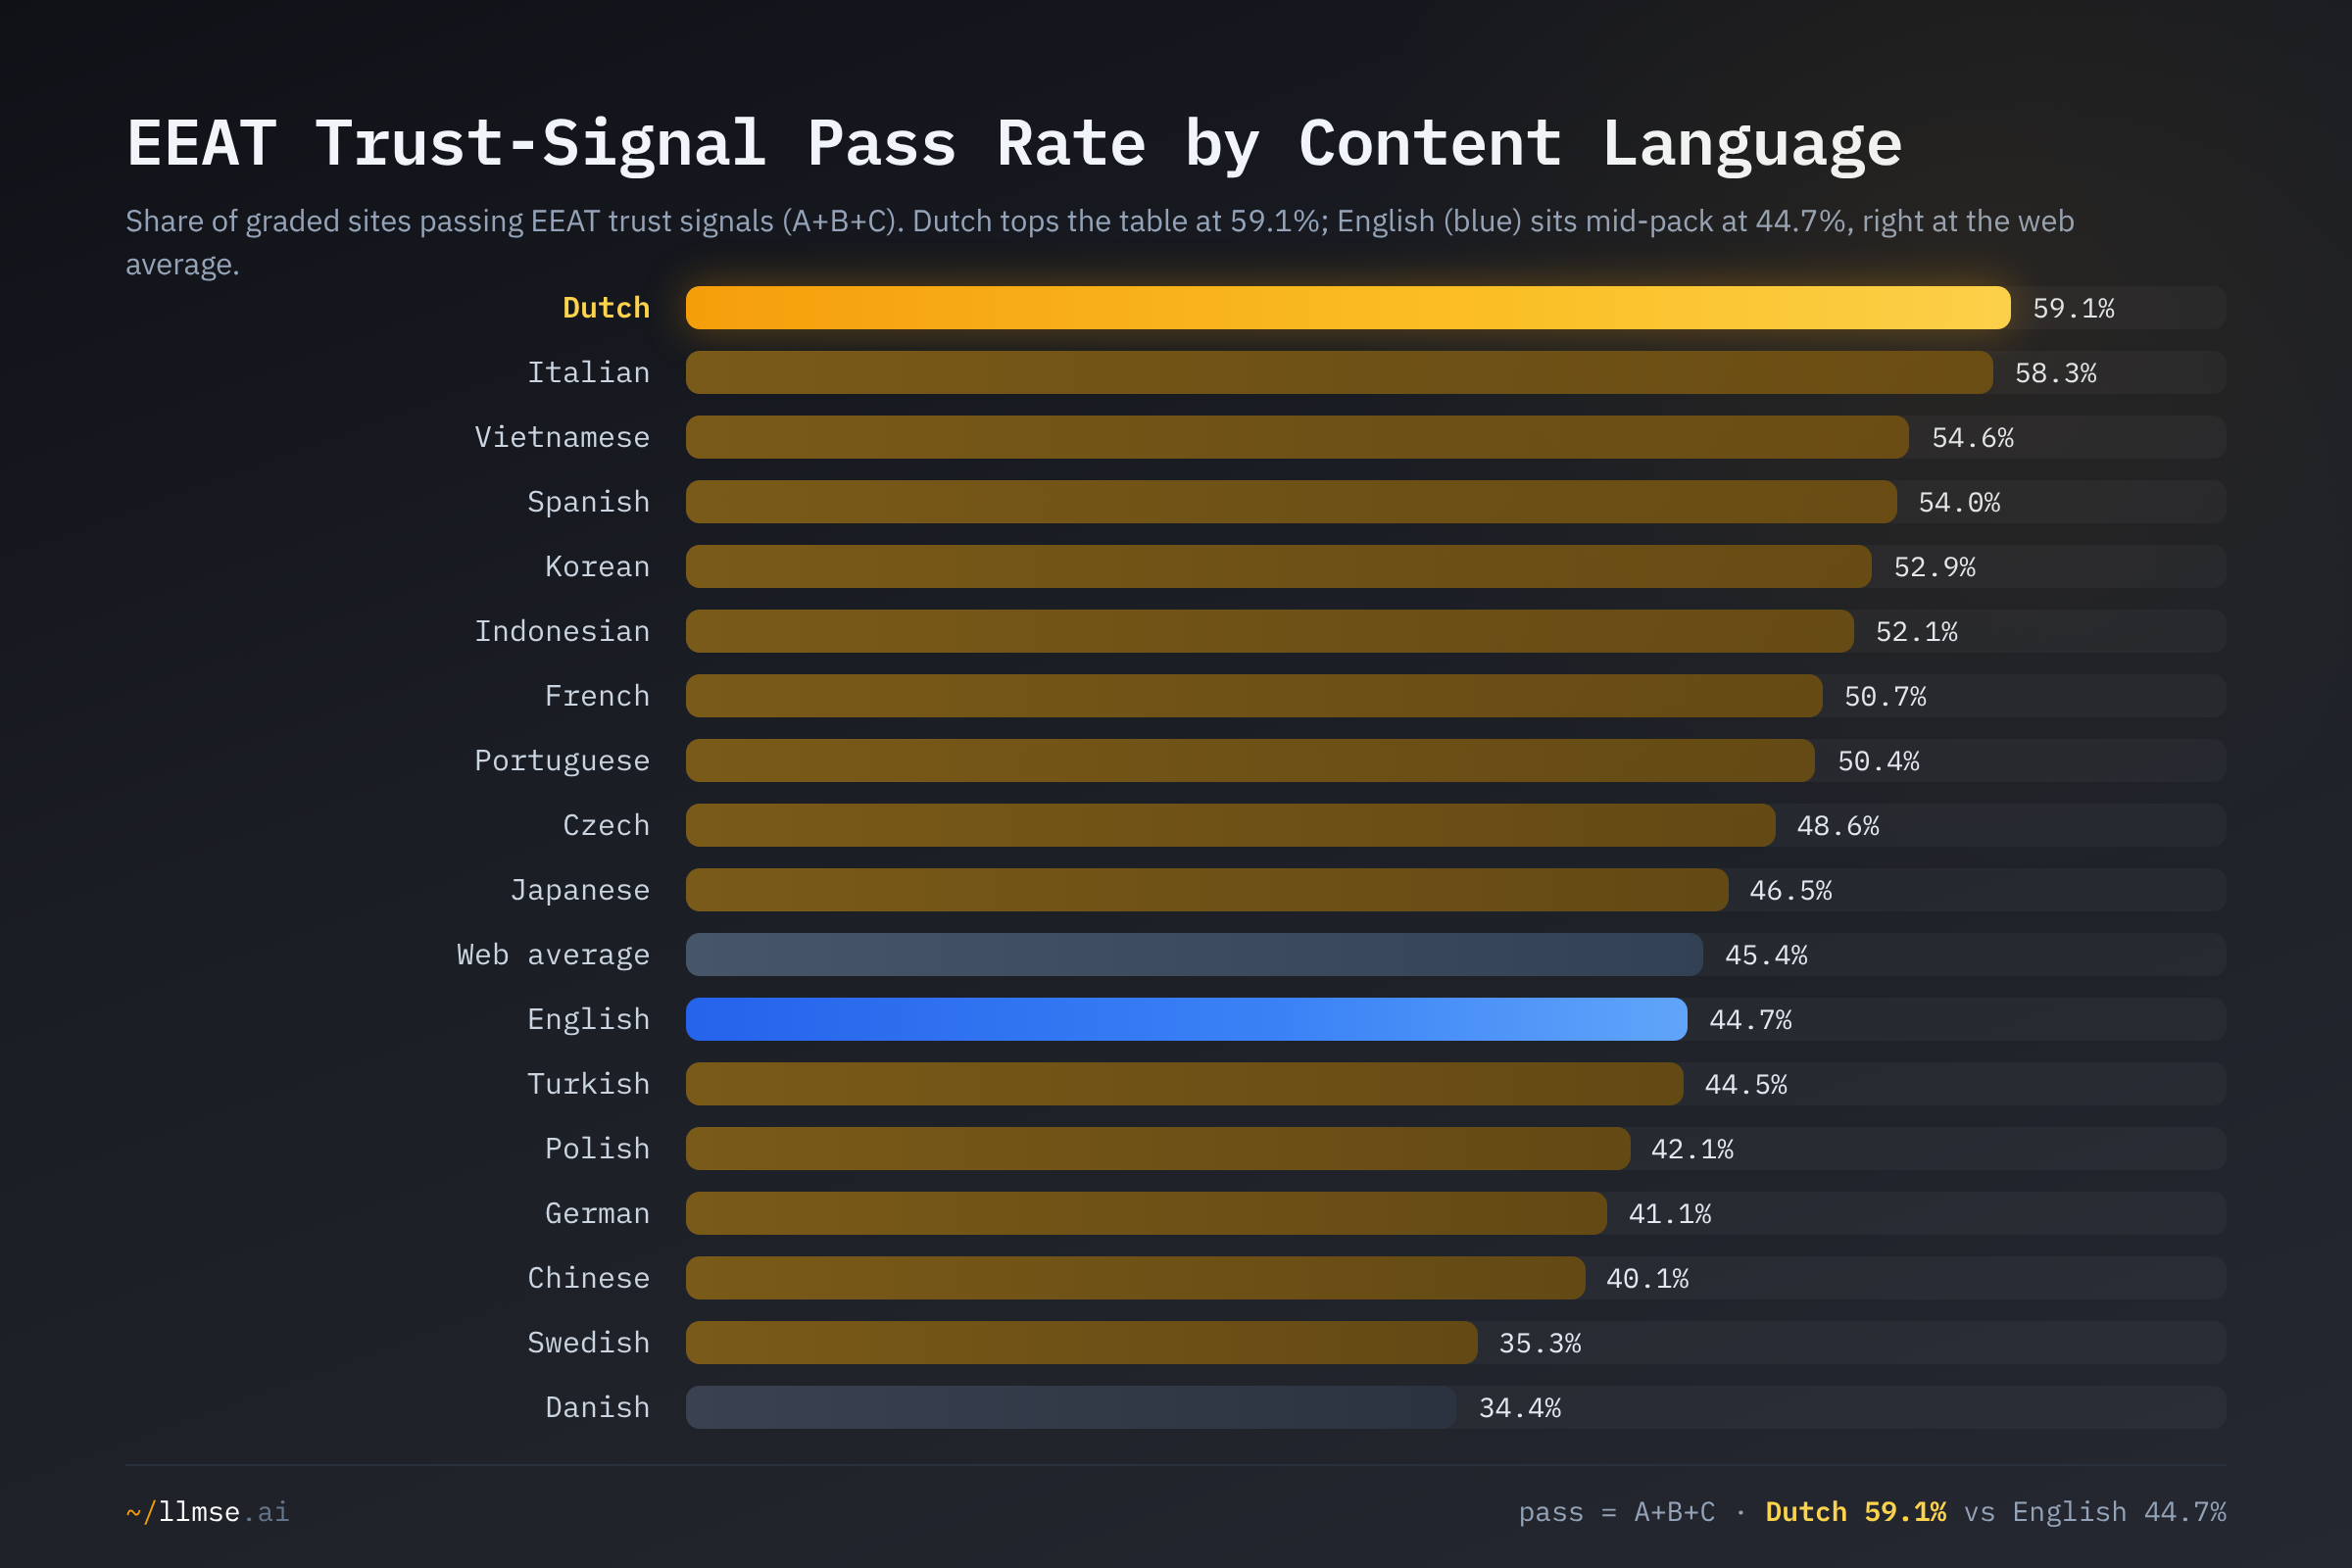
Dutch-language sites lead trust at 59.1% — nearly 14 points ahead of English (44.7%), which sits almost exactly on the 45.4% web average. The Netherlands is one of the most digitally mature markets in Europe, and the result is consistent with a web culture that defaults to organizational transparency and clear ownership. Dutch is not alone in beating English: a Romance-language bloc — Italian (58.3%), Spanish (54.0%), French (50.7%), Portuguese (50.4%) — clusters near the top, along with Korean (52.9%) and Indonesian (52.1%).
English finishing eleventh of seventeen on trust is the single clearest rebuttal to the "English is the quality standard" assumption. Its 44.7% is mid-pack, dragged down by the same long tail of thin and abandoned pages that depresses its SEO. At the bottom sit the Nordic languages — Danish (34.4%) and Swedish (35.3%) — and German (41.1%), where sites tend toward functional, identity-light designs. Trust signals are a content-and-disclosure investment, not a wealth or web-maturity index, and the ranking reflects editorial convention more than GDP.
WCAG: Japan's Standards Build the Most Accessible Web
WCAG accessibility — alt text, form labels, heading hierarchy, landmark structure — is the dimension where national policy is most visible in the aggregate data.
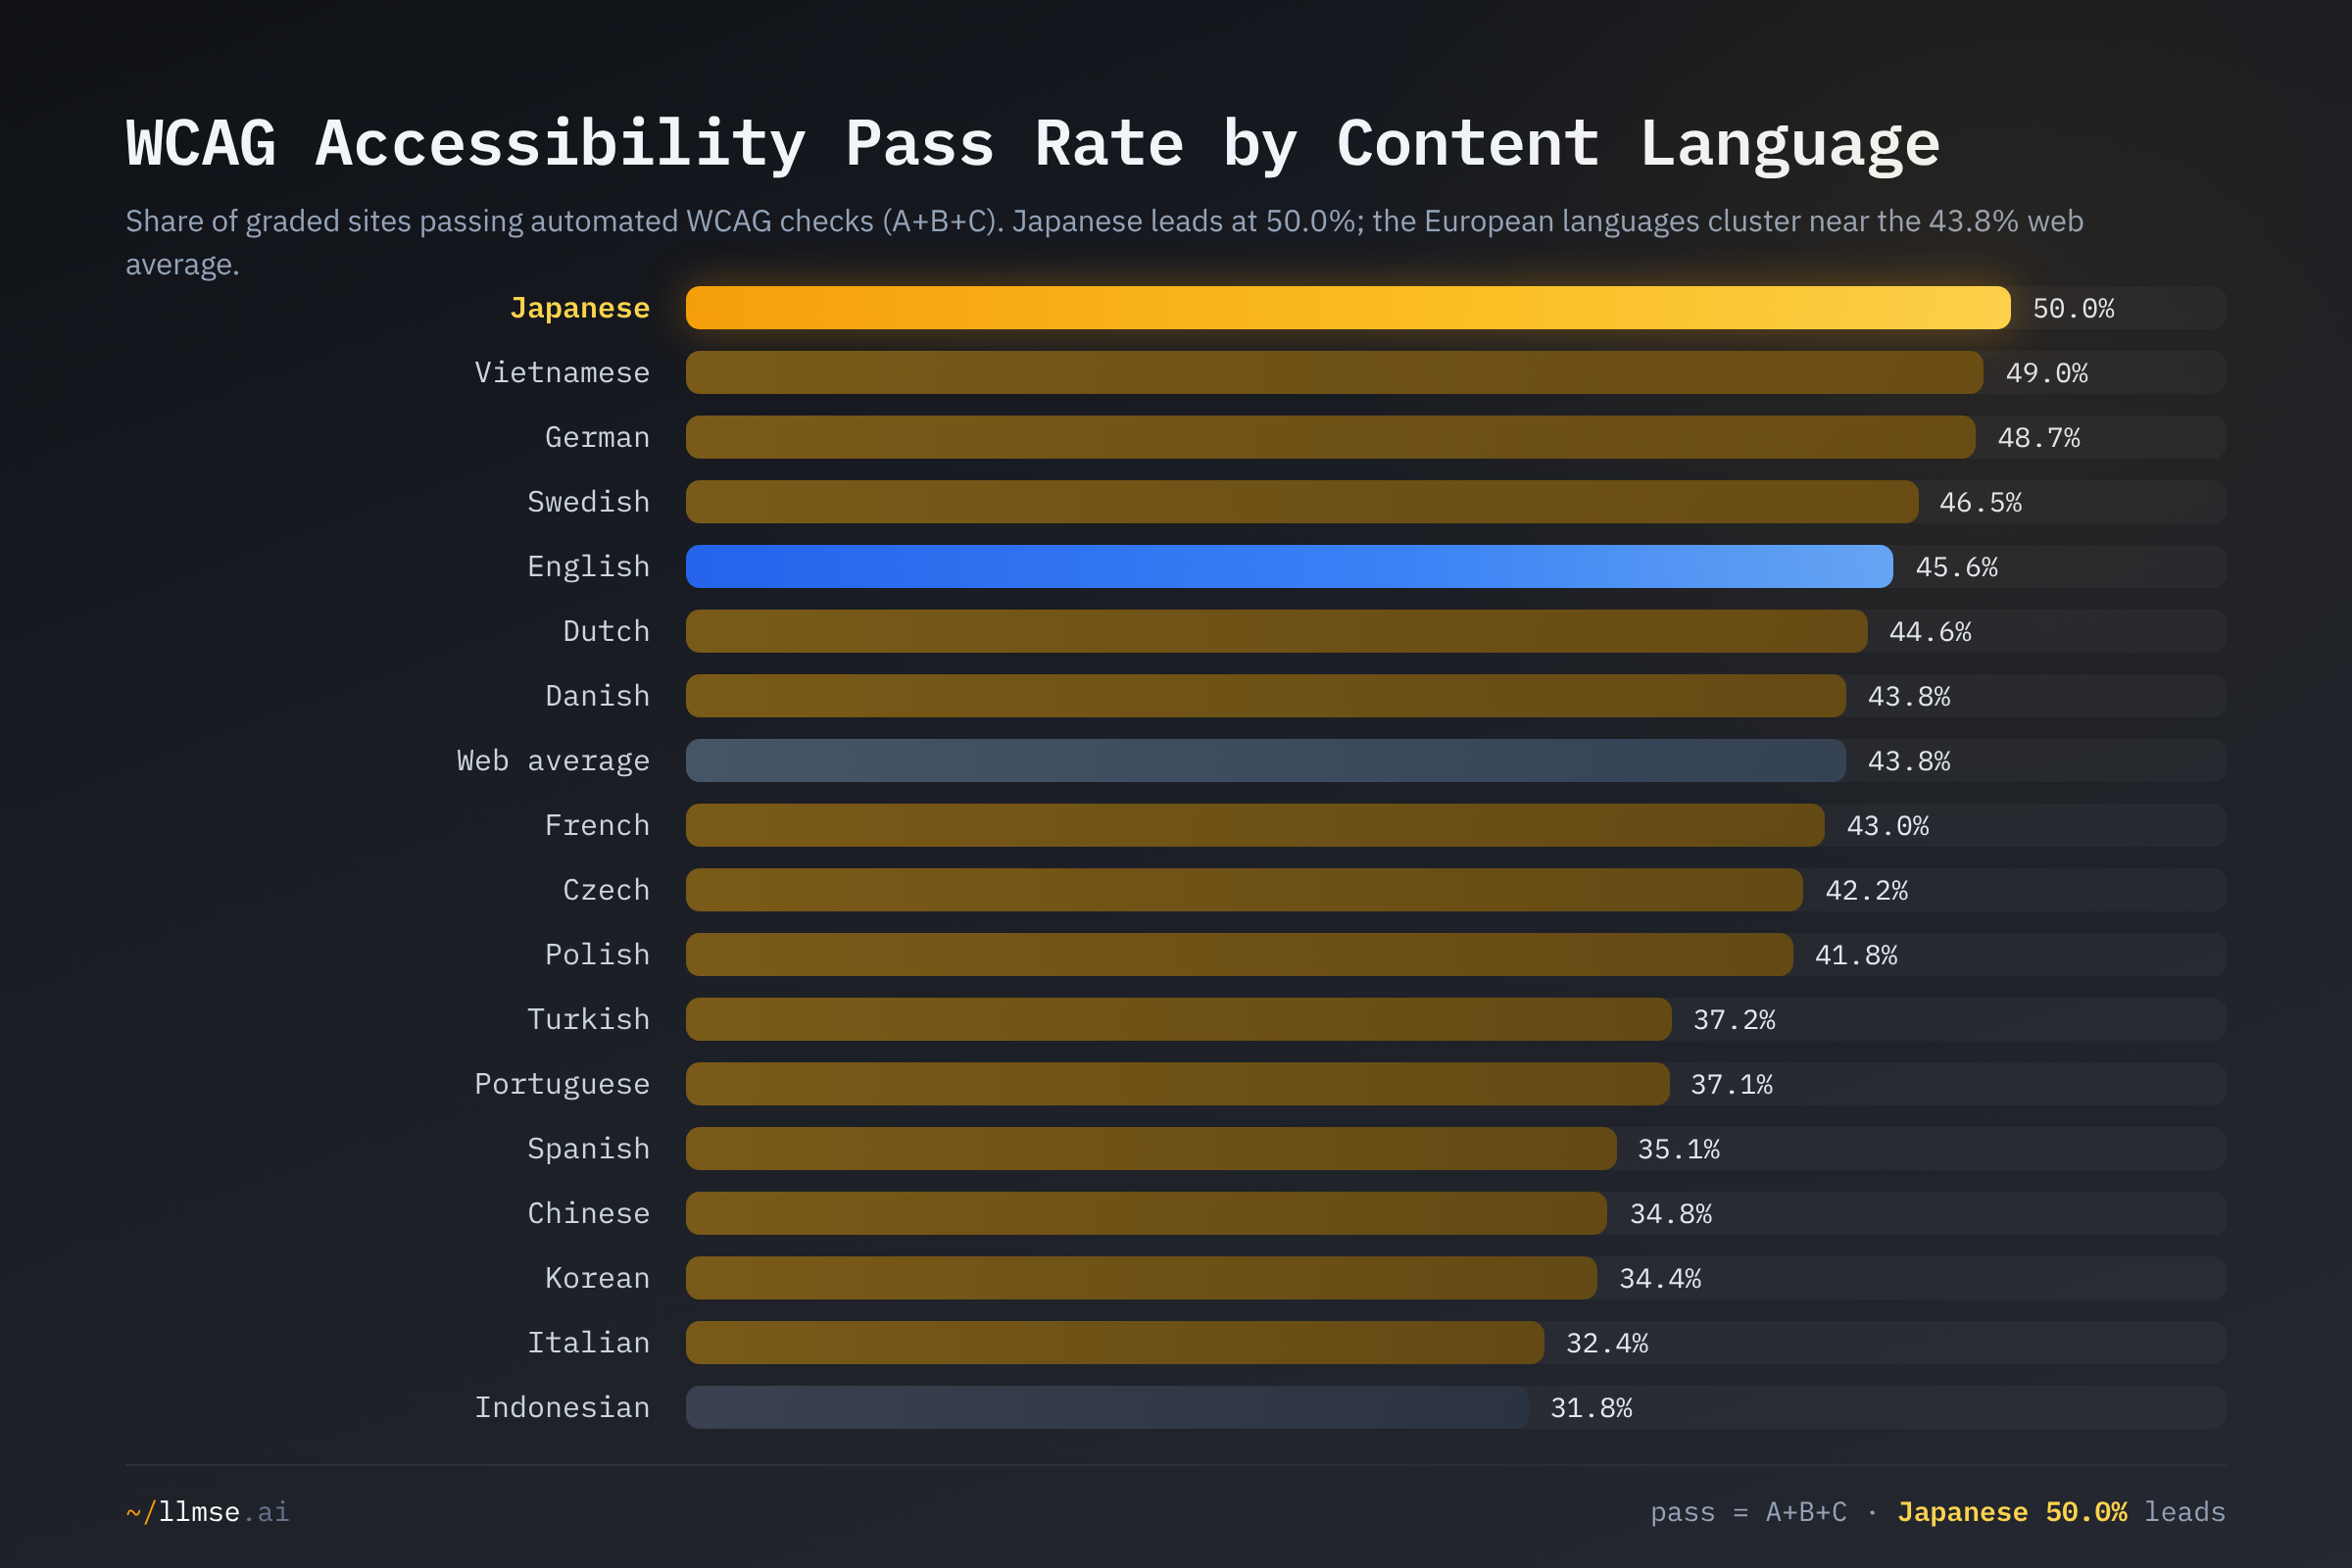
Japanese-language sites pass automated WCAG checks at 50.0% — the highest of any language and over six points above the web average. Japan's JIS X 8341-3:2016 standard mirrors WCAG 2.0's success criteria and is the basis for the Ministry of Internal Affairs' public-sector accessibility guidelines; the broad adoption of a WCAG-derived national standard is consistent with the measured lead. The pattern triangulates with the WebAIM Million 2025 report, which found English-language home pages average ~40 accessibility errors versus ~86 for Korean — and Korean sits near the bottom of our WCAG table at 34.4%, while Japanese tops it.
The European languages cluster tightly around the web average — German 48.7%, Swedish 46.5%, English 45.6%, Dutch 44.6%, Danish 43.8%, French 43.0% — consistent with the leveling pressure of the EU Web Accessibility Directive and the European Accessibility Act, which became enforceable on 28 June 2025 with penalties reaching 4% of turnover. At the bottom are Indonesian (31.8%), Italian (32.4%), Korean (34.4%), and Chinese (34.8%).
This is the finding the original got wrong, and the correction is instructive. The first edition, using a top-tier A+B cutoff, ranked Vietnamese last on accessibility. On the standard A+B+C basis Vietnamese now sits second at 49.0% — its sites earn a great many "C" (partially accessible) grades but few top marks. The two readings are not contradictory: Vietnamese sites mostly clear the automated bar but rarely excel. We retire the "least accessible language" claim; on the consistent measure used across every LLMSE post, Vietnamese is firmly above average.
Readability: The Formula That Only Speaks English
LLMSE's readability grade uses the Flesch Reading Ease formula, and the per-language results look dramatic: Korean "scores" 77.3% A+B, Japanese and Czech 63.0%, while Italian sits at 3.3% and Spanish at 5.8%. Taken at face value, this would say Korean web content is twenty times more readable than Italian. It says nothing of the kind.
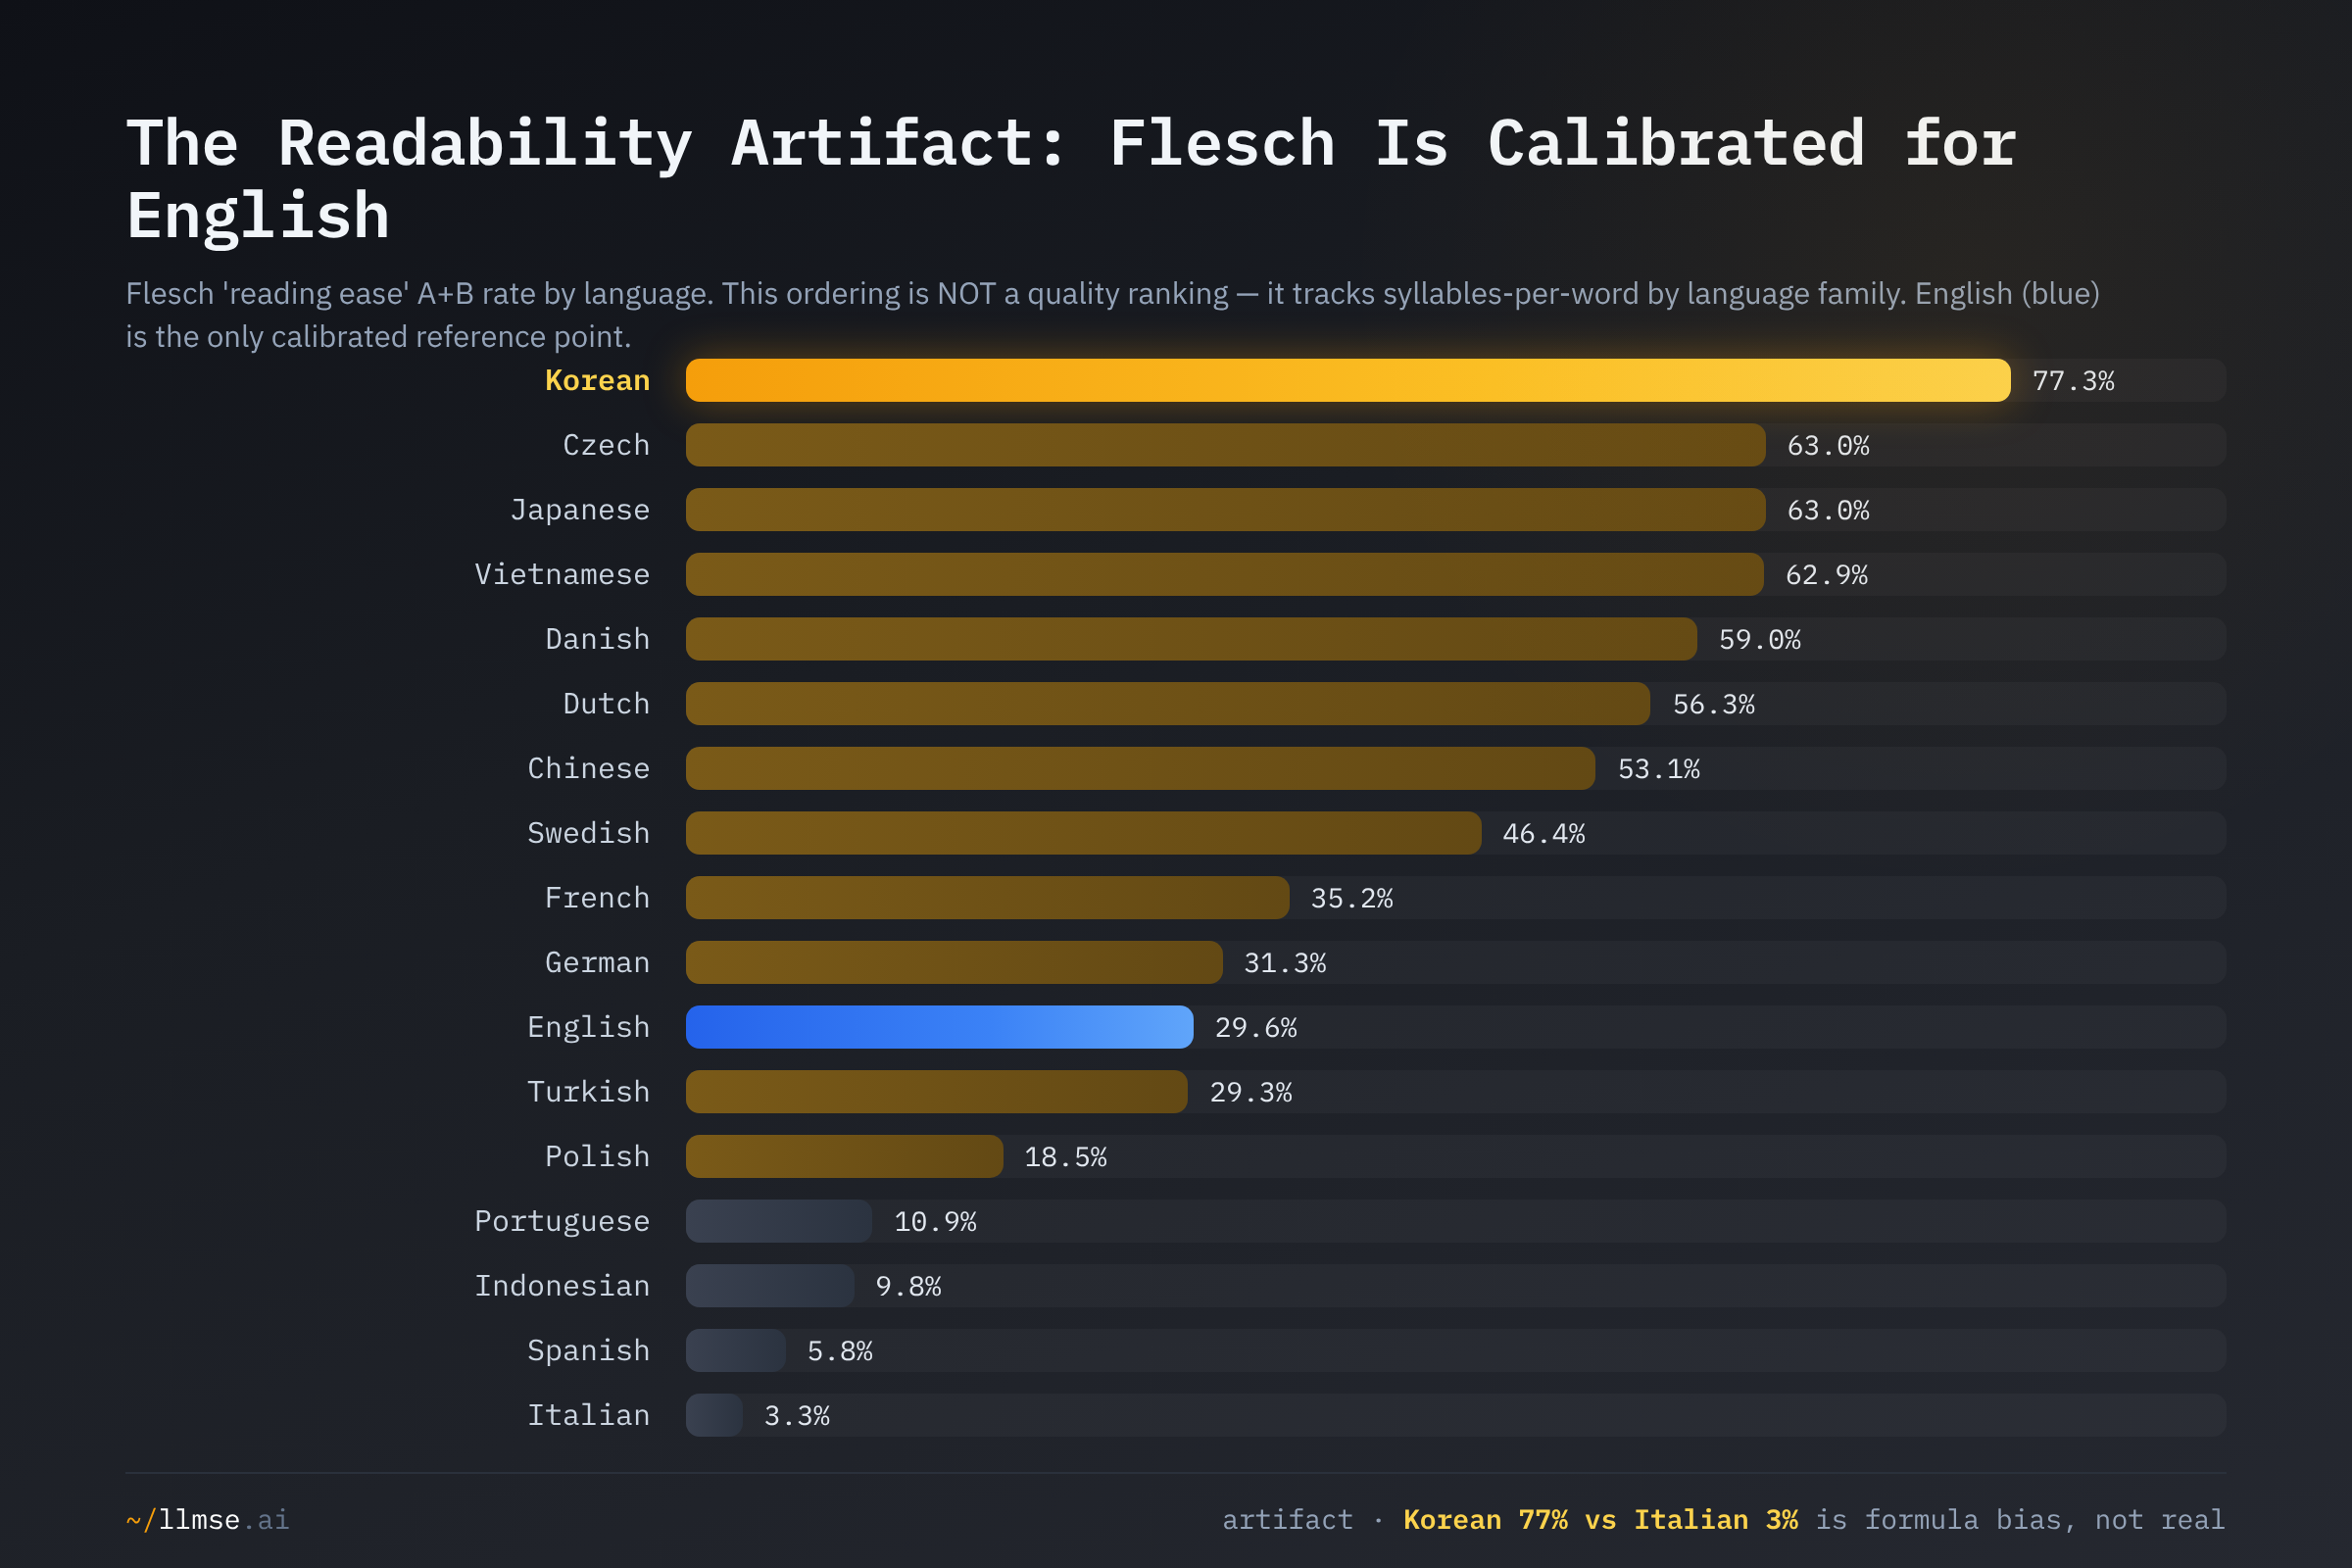
This ordering is a measurement artifact, not a ranking. Flesch Reading Ease was built to "indicate how difficult a passage in English is to understand" (Flesch-Kincaid readability tests), and its constants reward short sentences and few syllables per word. Those two quantities vary systematically by language family, not by writing quality: Romance languages (Italian, Spanish, Portuguese) use longer, more polysyllabic words, so even crystal-clear Romance prose "scores" as difficult, while a language with short orthographic words scores as easy regardless of how dense the writing is. The chart above is essentially a ranking of average word length, dressed up as readability.
The fix is well understood and underscores the problem: every serious readability practice uses language-specific formulas with different constants — the Fernández Huerta formula for Spanish, Flesch-Vacca/Franchina for Italian, the Amstad adaptation for German, Douma's for Dutch (overview of Flesch adaptations), and even a parallel-corpus adaptation for Czech. Each reweights the syllable and sentence terms precisely because the English constants do not transfer. No universal cross-language readability metric exists at scale.
The practical rule: our English readability grades are meaningful; cross-language readability comparisons are not. English's 29.6% A+B is the one calibrated reference point on the chart (shown in blue). Every other bar should be read only against other sites in the same language, never against English or each other. We include the dimension in this post solely to make the bias visible — which is why it is excluded from the scorecard's bolding and from any "which language is best" claim.
Sentiment: Czech Content Runs Negative
Sentiment classifies content as Good, Neutral, or Bad. Across every language the overwhelming majority is positive — the web-wide Bad rate is 0.75% — but the negative tail varies by more than an order of magnitude.
| Language | Good | Neutral | Bad | Bad rate |
|---|---|---|---|---|
| English | 91.8% | 7.8% | 0.36% | lowest |
| German | 95.0% | 4.5% | 0.51% | — |
| Dutch | 93.9% | 5.6% | 0.56% | — |
| Japanese | 83.4% | 15.3% | 1.23% | — |
| Chinese | 76.8% | 21.8% | 1.40% | — |
| Spanish | 92.0% | 6.6% | 1.49% | — |
| French | 92.6% | 5.8% | 1.55% | — |
| Turkish | 80.6% | 17.4% | 1.94% | — |
| Czech | 80.1% | 12.1% | 7.73% | highest |
Czech-language content carries the highest Bad-sentiment rate on the board at 7.73% — more than ten times the web average and over twenty times English's 0.36%. The result is consistent with two non-exclusive explanations: the Czech Republic hosts an unusually active infosec and security-research community whose threat-and-vulnerability content reads as negative to a sentiment classifier, and Czech web publishing leans toward direct, critical prose. Chinese (1.40%) and Japanese (1.23%) also run negative-heavy relative to their volume, driven by a higher share of news and discussion content. We frame these as plausible compositional explanations, not proven causes; sentiment-classifier accuracy itself varies across languages.
What's at Stake
- English volume is not English quality — and AI answer engines inherit the gap. English is 61% of the index but leads none of the six graded quality dimensions, sitting at or below the web average on trust, privacy, and readability. As AI answer engines lean on EEAT-style signals to choose sources, the languages with stronger trust signals (Dutch, the Romance bloc) may be over-represented in citations while large, mid-quality English corpora are treated as the undifferentiated default.
- Discovery rankings reward composition, not craft. Vietnamese and Indonesian top SEO and AEO because gambling and affiliate content — the web's most aggressively optimized vertical — makes up 30-46% of their indexed sites. Anyone benchmarking "international SEO" against raw per-language averages is measuring vertical mix, not opportunity. Compare within-vertical, or the number misleads.
- Accessibility tracks policy, and the map proves it. Japan's WCAG-derived national standard (50.0%) and the EU's directive-driven cluster (~43-49%) sit visibly above markets without comparable mandates. With the European Accessibility Act now enforceable at up to 4% of turnover, the gap between regulated and unregulated language markets is a live compliance exposure, not a curiosity.
- Readability scores are dangerous when compared across languages. A team that "optimizes" Spanish or Italian content to lift a Flesch score is chasing an artifact and may degrade real clarity. The only valid readability comparison is within a single language against a language-specific formula.
- Privacy is the widest divide of all. German sites pass privacy at 67.2% while Vietnamese sit at 3.5% and Chinese at 5.8% — a gap shaped by GDPR's reach into German- and EU-language markets and its near-absence elsewhere. Low-privacy language markets that add forms, accounts, or analytics inherit obligations their sites are not built to meet.
What Would Help
- International SEO teams: benchmark against language and vertical, not a global average. A Vietnamese site's 10.3% SEO peer rate is inflated by a gambling-heavy sample; a German site's looks low next to it for the opposite reason. Pull your own per-dimension grades at llmse.ai/classify and compare to same-language, same-category peers rather than the world.
- Content strategists expanding abroad: study local trust conventions instead of translating English templates. Dutch and Romance-language sites out-signal English on EEAT; the patterns that build trust in those markets (organizational transparency, author identity, citations) are learnable from local leaders, not from a translated English page.
- Developers and CMS vendors in under-regulated markets: treat accessibility as a default, not a mandate-driven afterthought. The Japan-versus-Indonesia gap (50.0% vs 31.8%) shows accessibility responds to standards. Semantic structure, alt text, and labeled forms are cheap relative to the European Accessibility Act exposure now spreading globally.
- Anyone reporting readability: never compare Flesch scores across languages. Use the language-specific adaptation (Fernández Huerta, Amstad, Franchina, Douma) and report only within-language. Our readability analysis is calibrated for English; a Spanish score from the same formula is not the same metric.
- AI platforms: weight provenance per language, and watch the optimized fringe. Because non-English discovery rates are dominated by gambling and affiliate content, naive retrieval will over-surface the optimized margin in exactly the markets where licensing and trust matter most. Prefer authoritative, AEO-ready sources within each language rather than whatever is best formatted.
This analysis was conducted using LLMSE, which has classified over 3.4 million websites across SEO, EEAT, AEO, WCAG accessibility, readability, GARM brand safety, and privacy dimensions. Per-language pass rates reflect the populations graded on each dimension as of June 2026; Russian-language sites are excluded under sanctions. To analyze your own site across every dimension in this report, visit llmse.ai/classify.