Age of the Internet Audience: 3.36 Million URLs Show the Web Is Built for 30-45, Not 25-34
Update — 2026-06-29: Refreshed against LLMSE's current index of 3.4M classified URLs (up from ~1.4M at first publication) and re-graded across six quality dimensions, adding AEO (AI-answer optimization) and Privacy. The structural findings hold: the web's target audience still peaks at 30-45 (now +14.7% over 25-34, a gap that has narrowed from +27.6%), older-audience content still earns the highest trust signals, and the 30-45 bracket is still 99.9% male. Two 2026-snapshot artifacts are now corrected — Gen Z (18-24) was reported as the worst-trust and least-positive cohort; against a 2.4x-larger graded population it is now mid-to-upper on trust (60.3% EEAT) and 88.8% positive, so both anomalies are dropped. The accessibility claim is reframed: under the standard A+B+C pass definition, older-audience content actually leads basic WCAG pass — its real blind spot is discoverability and readability, not accessibility. The thesis survives, sharpened: the web is built for mid-career buyers, and trust and discoverability are inversely distributed across audience age.
The advertising industry has a number: 25-34. It is the demographic that commands the highest ad rates and the most aggressive targeting, the segment every media plan is built to capture. The premise is simple — win 25-34 and you win the web's spending power. Google Ads encodes that worldview directly, offering advertisers exactly seven age brackets — 18-24, 25-34, 35-44, 45-54, 55-64, 65+, and Unknown — to slice the entire adult internet.
We tested the premise against the content itself. LLMSE classifies each URL by the target-audience age its content is written for, and the web's actual demographic center of gravity sits older than the industry assumes — and on a far finer grid than seven buckets. The internet's content uses 154 distinct age brackets, from age-2-10 children's content to age-65-90 senior sites, and the mass does not pile up where the media plans point.
This is an aggregate analysis, not a curated sample. We cross-referenced every age bracket in LLMSE's index of 3.36 million age-classified URLs — roughly 98% of the 3.4M-URL index carries a target-age bracket — against six automated quality grades (SEO, AEO, EEAT, WCAG accessibility, readability, privacy), plus the audience-gender and sentiment classifications, using Redis set intersections. Every grade comes from the same automated pipeline applied uniformly across the index.
The most-targeted age bracket on the web is not 25-34. It is 30-45, with 387,821 URLs — 14.7% more than the "golden demographic's" 338,259. Mid-career adults, not young professionals just entering their spending power, are who the web's content is built for. And the deeper the data goes, the sharper the divide between who the web serves and who actually uses it the most: content targeting concentrates where purchasing authority sits, while the heaviest internet use sits a decade younger.
The Data
LLMSE assigns every classified URL a target-audience age range during LLM classification. Of the 3.4M URLs in the index, 3,362,343 carry an age bracket, spread across 154 distinct ranges. Pass rates throughout this post are computed over the population actually graded on each dimension — not every URL carries every grade — so per-dimension denominators differ. The web-wide baselines each bracket is measured against:
| Dimension | URLs graded (web-wide) | Web-average pass rate |
|---|---|---|
| SEO | 3,362,226 | 1.9% |
| AEO (AI answers) | 3,337,211 | 1.5% |
| EEAT (trust) | 3,358,095 | 45.4% |
| WCAG (accessibility) | 3,341,134 | 43.8% |
| Readability | 3,341,285 | 32.8% |
| Privacy | 3,335,398 | 37.0% |
The concentration of target-age content is steep. The single most-targeted bracket, 30-45, accounts for 11.5% of all age-classified URLs on its own; the top two brackets (30-45 and 25-34) together hold more than a fifth of the web.
| Rank | Age bracket | URLs | Share |
|---|---|---|---|
| 1 | 30-45 | 387,821 | 11.5% |
| 2 | 25-34 | 338,259 | 10.1% |
| 3 | 25-44 | 260,082 | 7.7% |
| 4 | 35-55 | 165,732 | 4.9% |
| 5 | 25-54 | 138,984 | 4.1% |
| 6 | 25-55 | 120,563 | 3.6% |
| 7 | 35-60 | 115,626 | 3.4% |
| 8 | 30-50 | 113,114 | 3.4% |
| 9 | 18-65 | 108,687 | 3.2% |
| 10 | 22-44 | 102,309 | 3.0% |
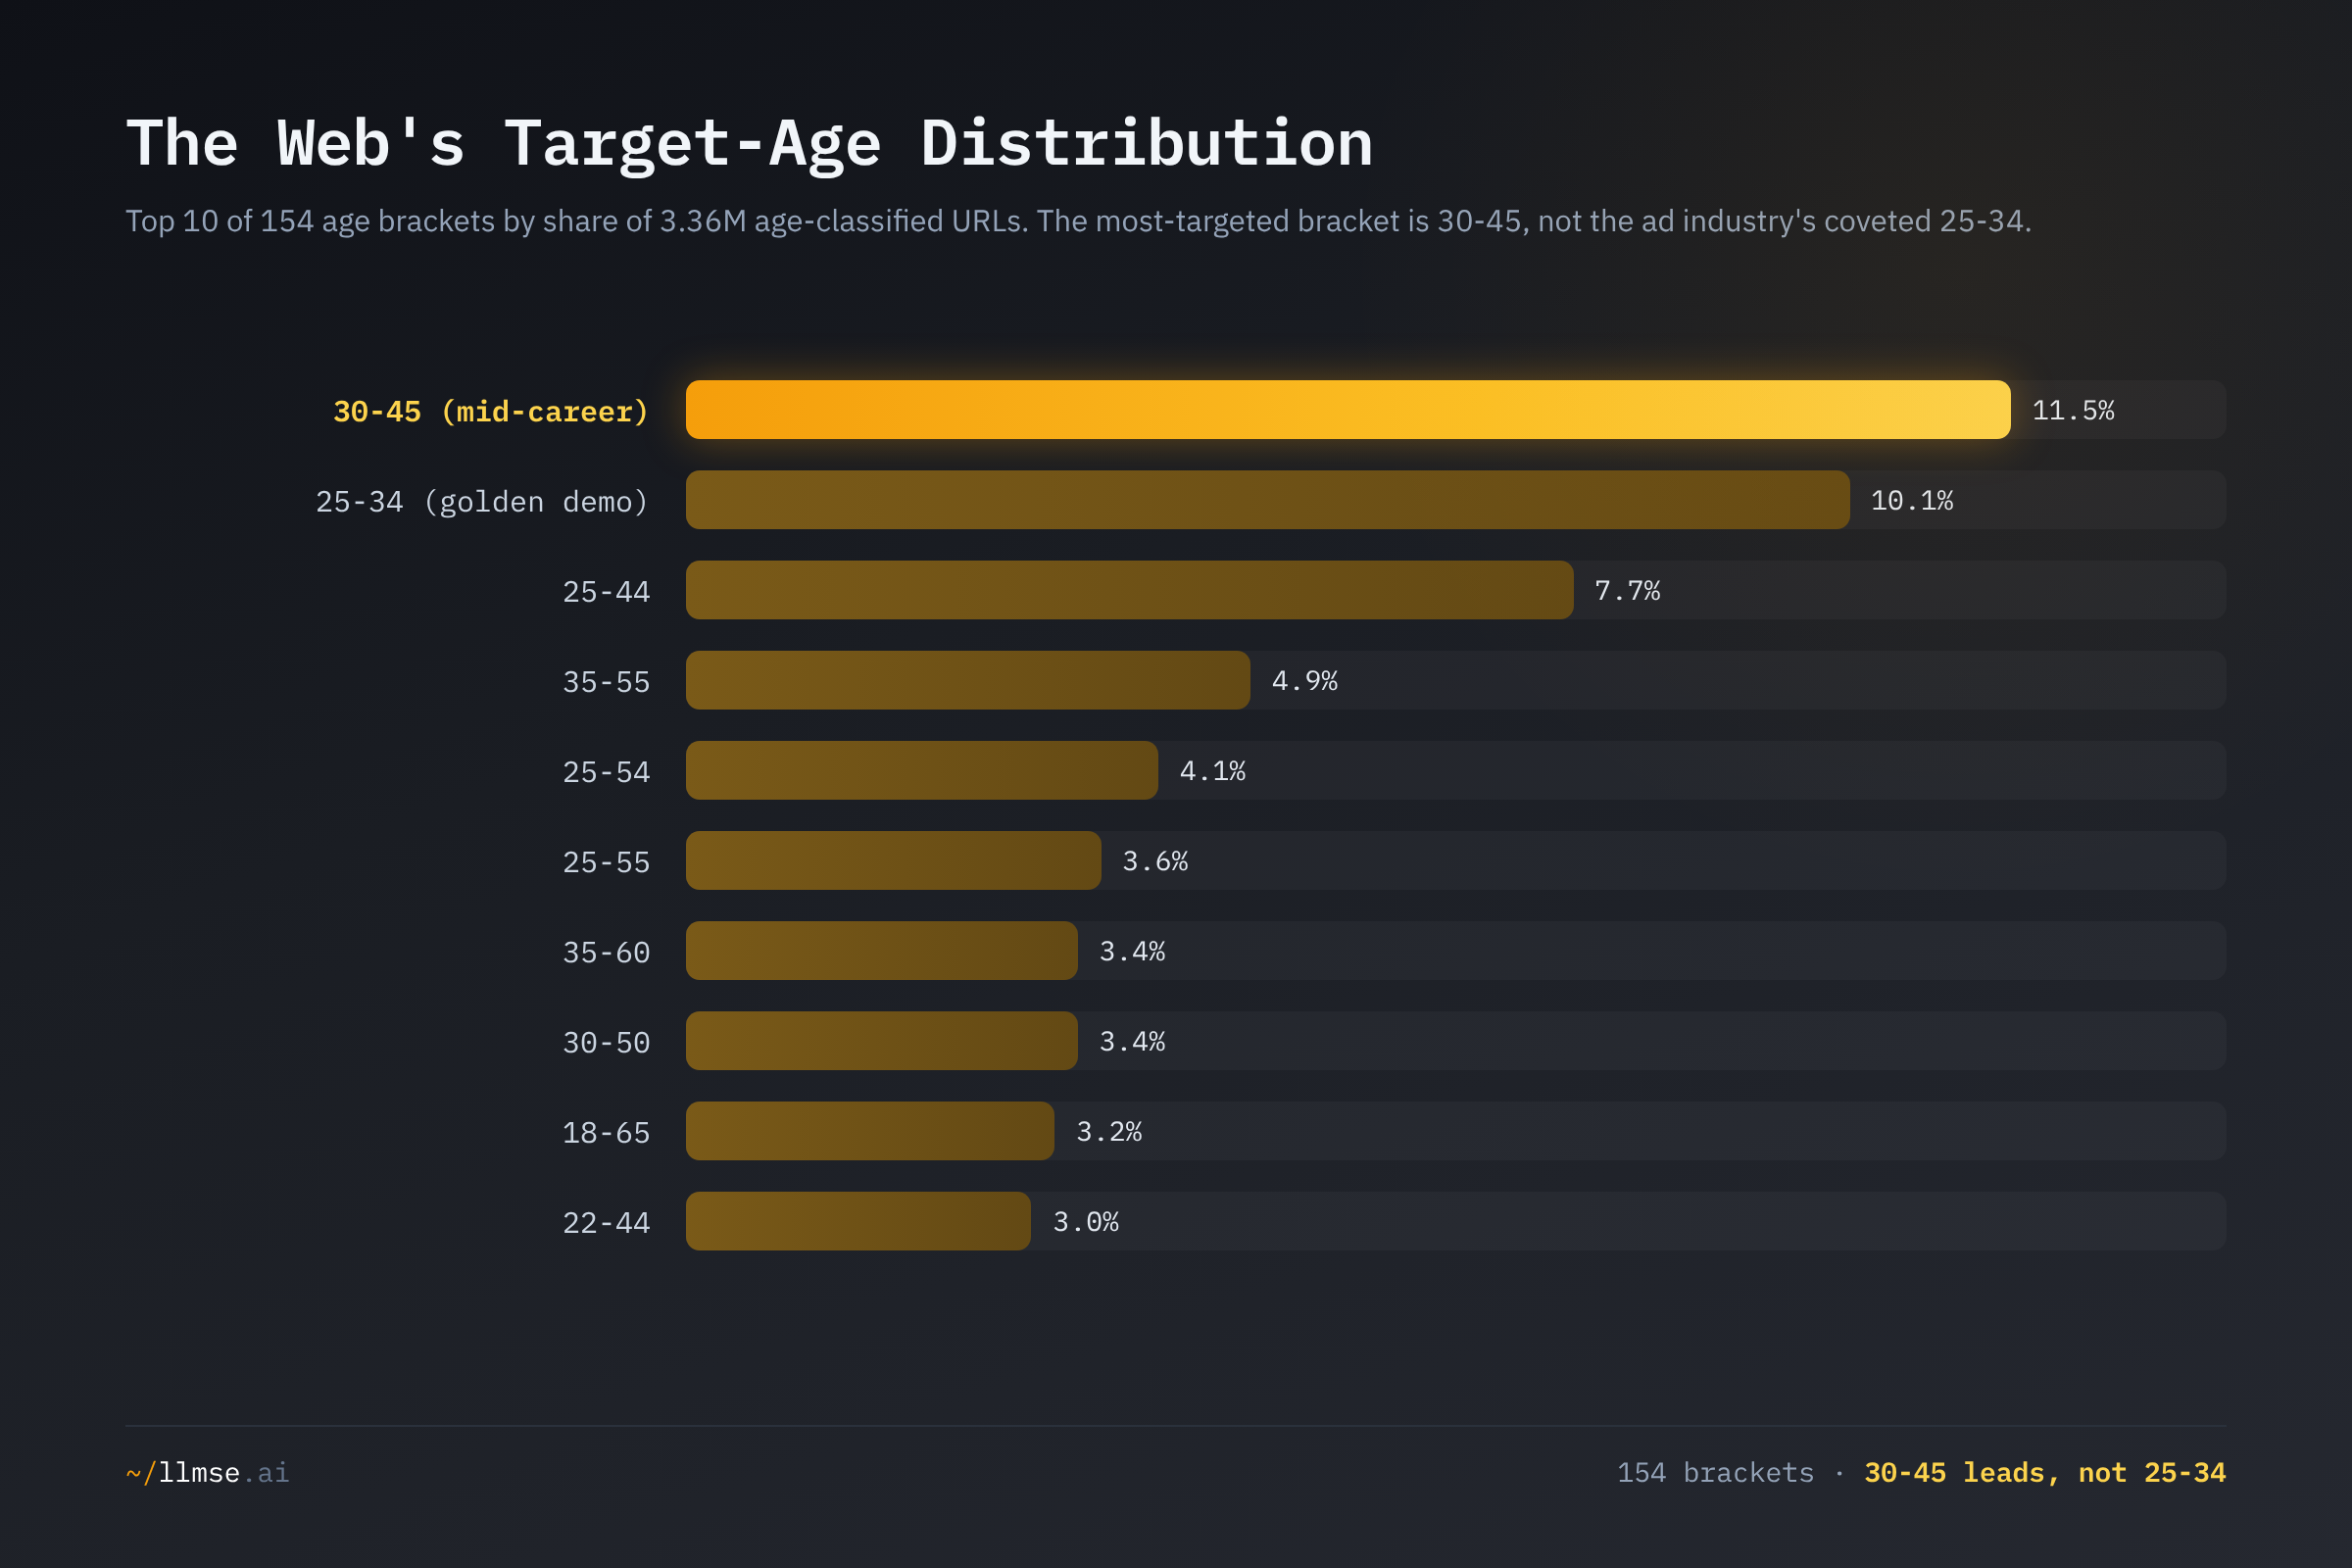
Nine of the top ten brackets overlap the 35-44 mid-career core (only 25-34 stops short of it), and eight of the ten start at age 25 or above. The web's demographic sweet spot is not "young adult" — it is the mid-career professional with a budget. The granularity is the second story: against Google's seven brackets, content creators target 154, and the most common bracket width is 20 years (57 of the 154 brackets are 11-20 years wide; only 29 are 10 years or narrower). A site built for "30-50 year-old professionals" spans both of Google's 25-34 and 35-44 buckets and fits neither — the way content is created and the way advertising is bought are modeling different things.
As a coarse generational lens, normalizing the 154 brackets by midpoint puts roughly 51.8% of age-classified URLs in the Millennial range (midpoint 28-39), 34.4% in Gen X (40-54), 10.5% in Gen Z (18-27), and 3.1% in Boomer+ (55+). These cohort shares depend on an arbitrary midpoint rule and overlapping brackets — a "25-55" bracket spans three generations — so treat them as indicative only; the bracket-level counts above are the reproducible figures.
Methodology
This post makes quantitative comparisons across age brackets, so the definitions and limits matter.
- Grades and "pass." Each site is graded A-F by a dedicated automated analyzer (there is no E grade). "Pass" means A+B+C for SEO, AEO, EEAT, WCAG, and Privacy, and A+B for Readability (a Flesch Reading Ease score of roughly 50+, ≈ 8th-grade level or below). GARM "brand-safe" means A only. SEO grades technical fundamentals; AEO grades answer-extractability and AI-citation signals; EEAT grades experience/expertise/authoritativeness/trust signals; WCAG covers automated accessibility checks (~30-40% of WCAG 2.1 Level A — manual testing is required for full conformance); Privacy grades consent gating, policy presence, and tracker behavior.
- Classification basis. The target-age range, audience gender, and sentiment are assigned by LLM classification from page content; each quality grade is an independent automated analyzer.
- Cohort proxies. Rather than rely on the midpoint generational partition (which is not independently reproducible from the toolkit), the per-dimension analysis below uses five representative single brackets as named proxies: 18-24 (young adults), 25-34 (the golden demographic), 30-45 (mid-career, the web's largest bracket), 35-55 (established adults), and 45-75 (older adults). Every figure for these proxies is a direct cross-reference and reproducible.
- Cross-references are computed as set intersections (Redis
ZINTERCARD) between anage-{lo}-{hi}index and each grade, category,sex-{male|female|all}, orsentiment-{Good|Neutral|Bad}index. All of these are URL-keyed, so the intersections are valid; all counts are aggregate and no individual site is identified. - Known limits. Target age is the model's assessment of intended audience, not measured audience data. Brackets overlap — a URL sits in exactly one bracket, but those brackets do not partition cleanly into generations. The index is biased toward the commercial web and is not a random sample of all internet content. Readability uses Flesch scoring, which is calibrated for English and understates readability for non-English content. Russian-language sites are excluded from every aggregate.
- Why these numbers differ from the original. The age-classified population grew from ~1.4M to ~3.36M URLs. Early grades skewed toward higher-quality, more-visible sites, so most absolute pass rates fell a few points as coverage broadened (and several per-bracket samples that were only a few hundred sites in February 2026 — Boomer readability was 397 graded then, it is 29,056 now — are no longer fragile). Separately, this rework reports EEAT and WCAG on the standard A+B+C pass definition; the original reported them on an A+B basis. That definitional change, combined with the larger sample, is what flips the WCAG ranking discussed below.
The Scorecard
Pass rates across all six dimensions for the five representative brackets, against the web average. The standout (best) cell in each column is bolded.
| Bracket | Sites | SEO | AEO | EEAT | WCAG | Read. | Privacy |
|---|---|---|---|---|---|---|---|
| 18-24 (young adults) | 59,665 | 2.1% | 2.3% | 60.3% | 44.8% | 25.0% | 37.4% |
| 25-34 (golden demo) | 338,259 | 1.7% | 1.4% | 45.7% | 43.7% | 38.0% | 41.5% |
| 30-45 (mid-career) | 387,821 | 2.4% | 2.0% | 56.0% | 42.0% | 26.7% | 47.3% |
| 35-55 (established) | 165,732 | 1.9% | 1.2% | 55.6% | 39.0% | 32.7% | 37.9% |
| 45-75 (older adults) | 29,245 | 1.0% | 0.6% | 69.2% | 64.4% | 20.4% | 64.0% |
| Web average | 3.4M | 1.9% | 1.5% | 45.4% | 43.8% | 32.8% | 37.0% |
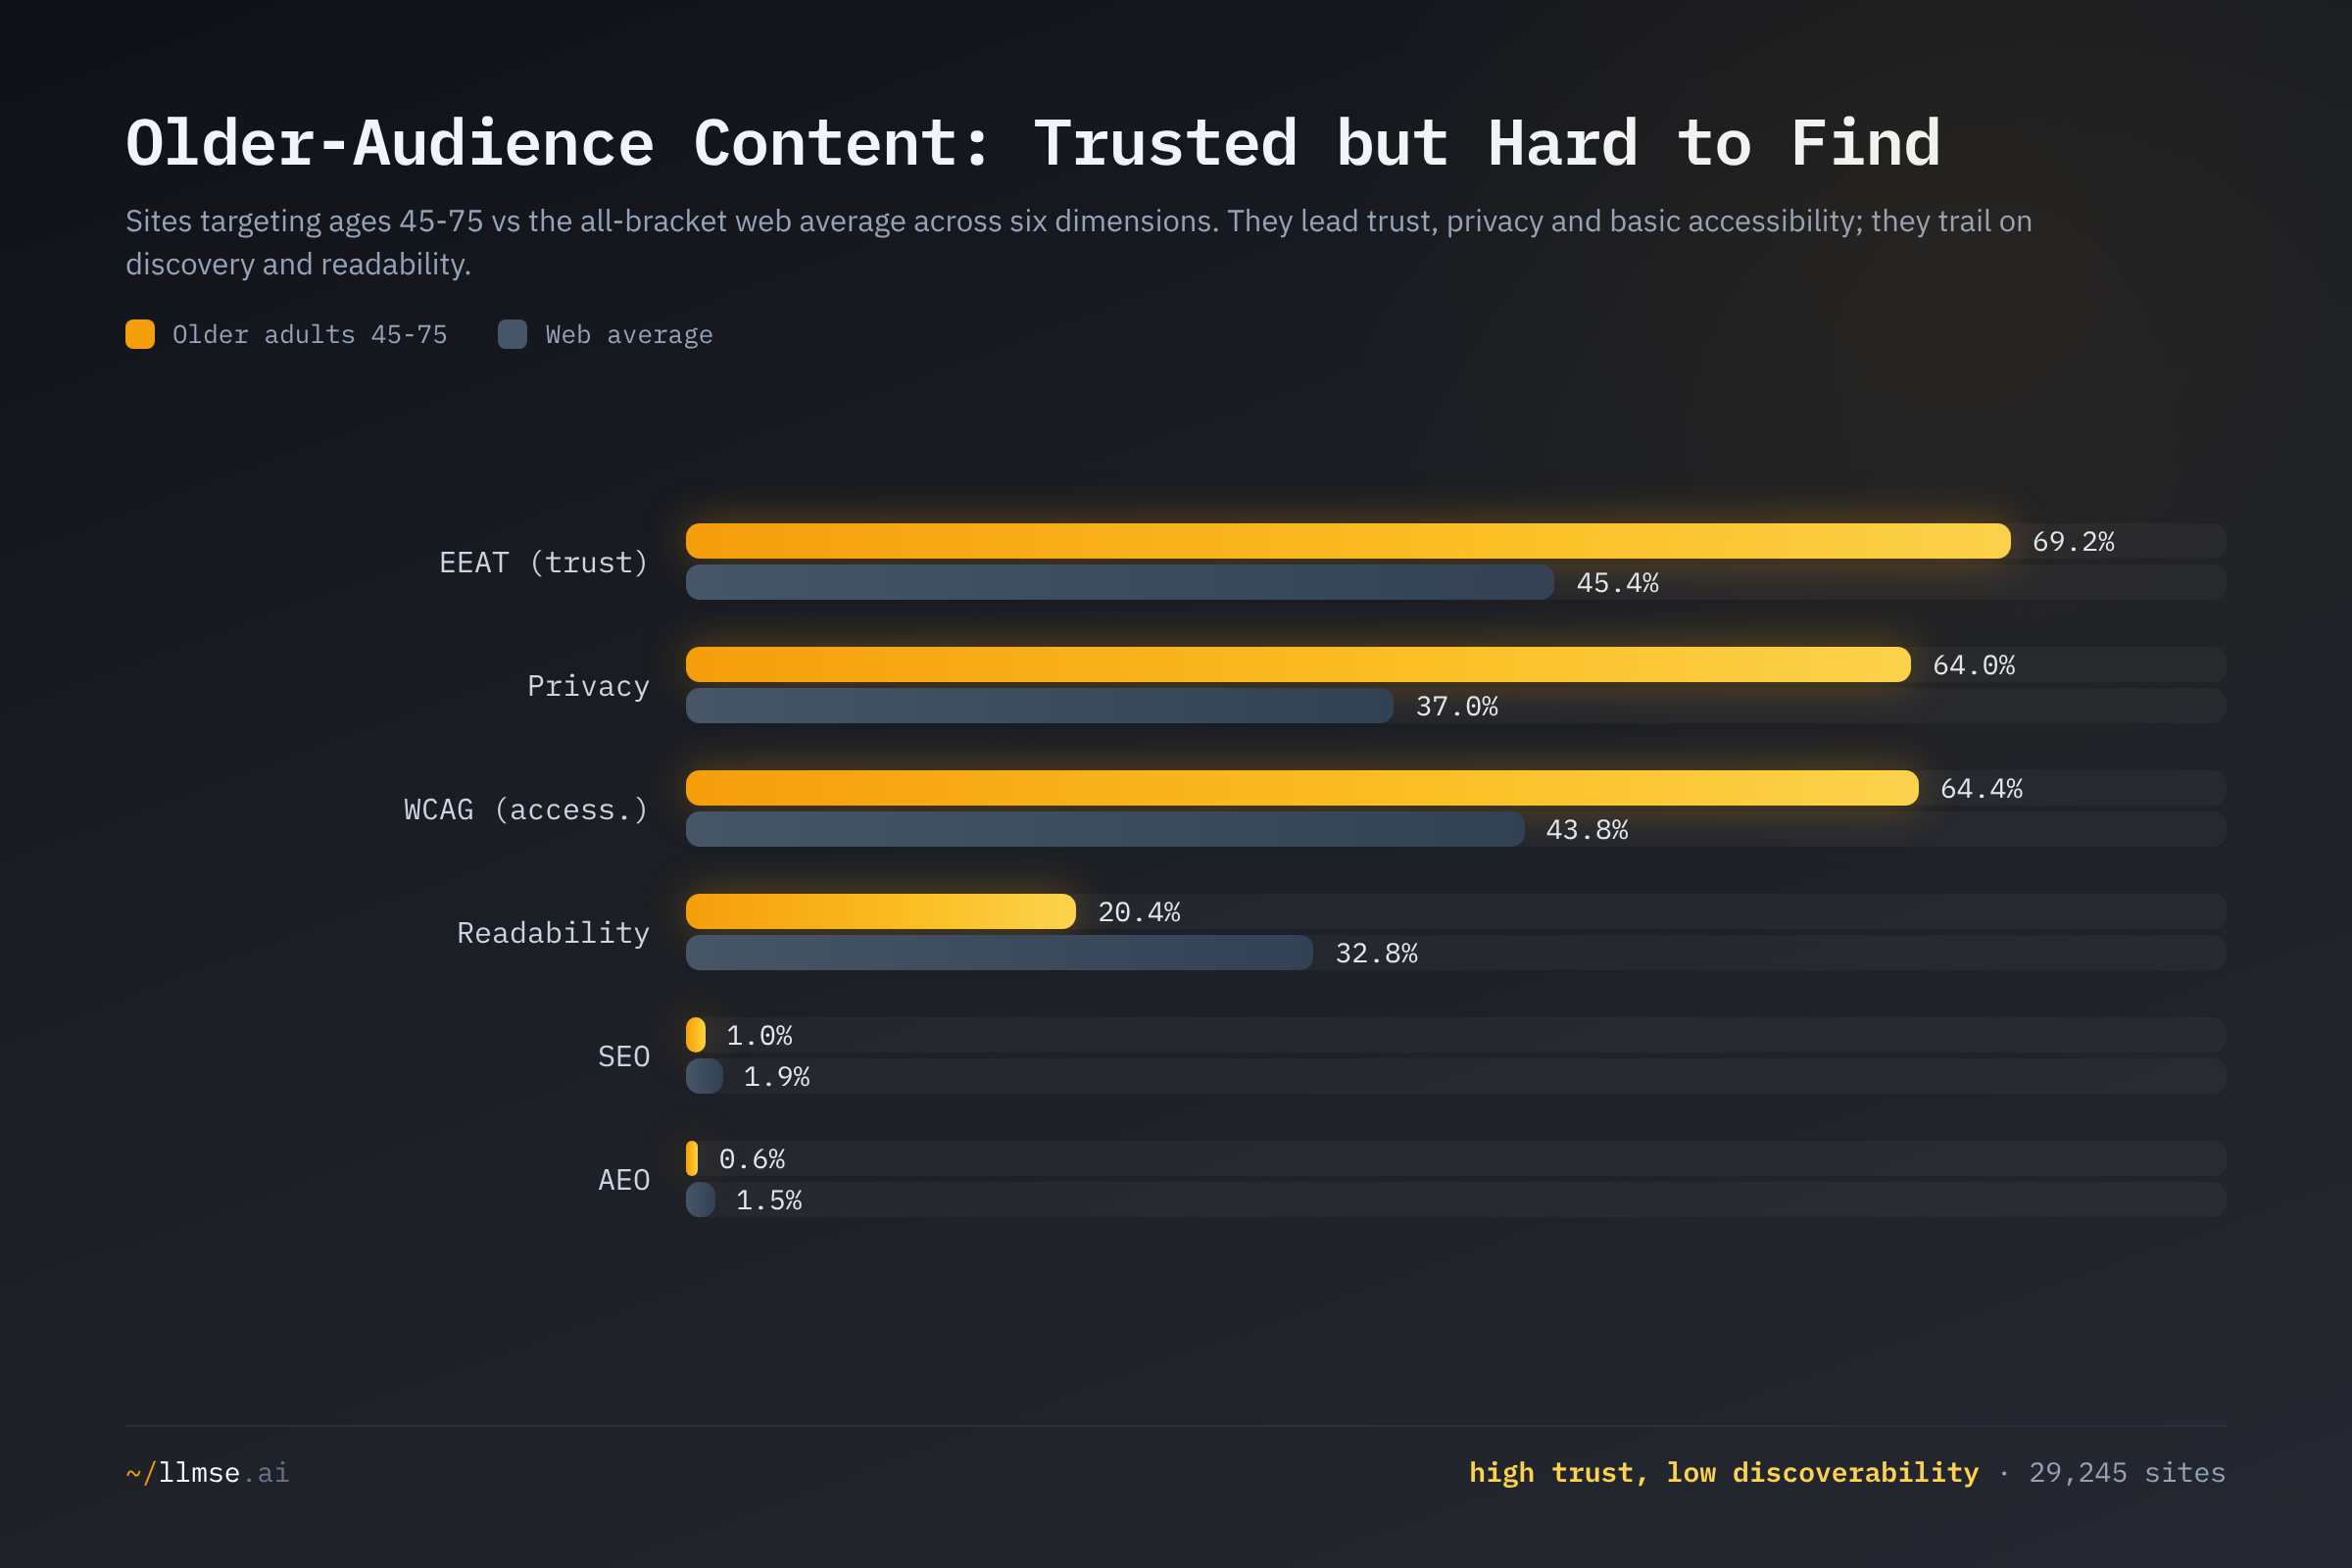
The clearest signal in the table is a single inversion, visible at the extremes of the age range. Content built for older audiences (45-75) leads the entire board on three dimensions — trust (69.2%), basic accessibility (64.4%), and privacy (64.0%) — and trails it on the other three — readability (20.4%), SEO (1.0%), and AEO (0.6%). The dimensions it leads are the ones that say this is a legitimate, safe, navigable site; the dimensions it trails are the ones that decide whether anyone finds it or can easily read it. The same content that earns the most trust is the hardest to discover. The rest of this post is the story of that trade-off and the category mix that drives it.
What Each Age Gets: A Narrow Internet
The quality differences across brackets are not random; they track the categories each age group attracts. And outside the diversified middle, every bracket is a one- or two-category internet.
| Bracket | Top category | #2 | #3 |
|---|---|---|---|
| 18-24 | Education 81.5% | Adult 14.3% | Career 3.8% |
| 25-34 | Business & Industry 78.6% | Education 9.8% | Shopping 3.8% |
| 30-45 | Business & Industry 99.9% | Family & Relationships 0.1% | — |
| 35-55 | Business & Industry 36.8% | Arts & Entertainment 20.8% | Home & Garden 10.5% |
| 45-75 | Entertainment 55.8% | News & Media 17.8% | Hobbies & Interests 16.6% |
The 30-45 bracket — the largest on the web — is effectively a single-category internet: 99.9% Business & Industry. This is the web's commercial engine, the content layer built for people with purchasing authority, hiring budgets, and vendor-evaluation responsibilities, and it grades accordingly (100% GARM brand-safe, above-average trust and privacy). The 18-24 bracket is a two-category internet — 81.5% Education and 14.3% Adult — and that 14.3% drags its GARM brand-safe rate to 82.8%, the lowest of any bracket and well below the 90.2% web norm. Only the 35-55 bracket has genuine diversity, with six categories above 5% (business, arts/entertainment, home & garden, internet/telecom, games, finance). Older-audience content concentrates in Entertainment and News — consistent with Pew's finding that major broadcast and cable news audiences carry median ages of 55-58, the oldest of any news format measured.
This category mix is the mechanism behind the quality scores. It is a plausible explanation, not a proven cause — but every quality finding below lines up with the content each age group is served.
Trust: The Oldest Audiences Get the Most Credible Content
EEAT trust signals rise monotonically with audience age at the top of the range: older-audience content (45-75) passes at 69.2%, more than 1.5x the web average and the highest of any bracket. EEAT measures author credentials, organizational identity, editorial transparency, and citation behavior — exactly the signals Google's Search Quality Rater Guidelines demand of "Your Money or Your Life" content. The categories older audiences consume — established news organizations, broadcast entertainment brands, long-running hobby and history sites — are inherently high-trust domains with mastheads, bylines, and institutional authority.
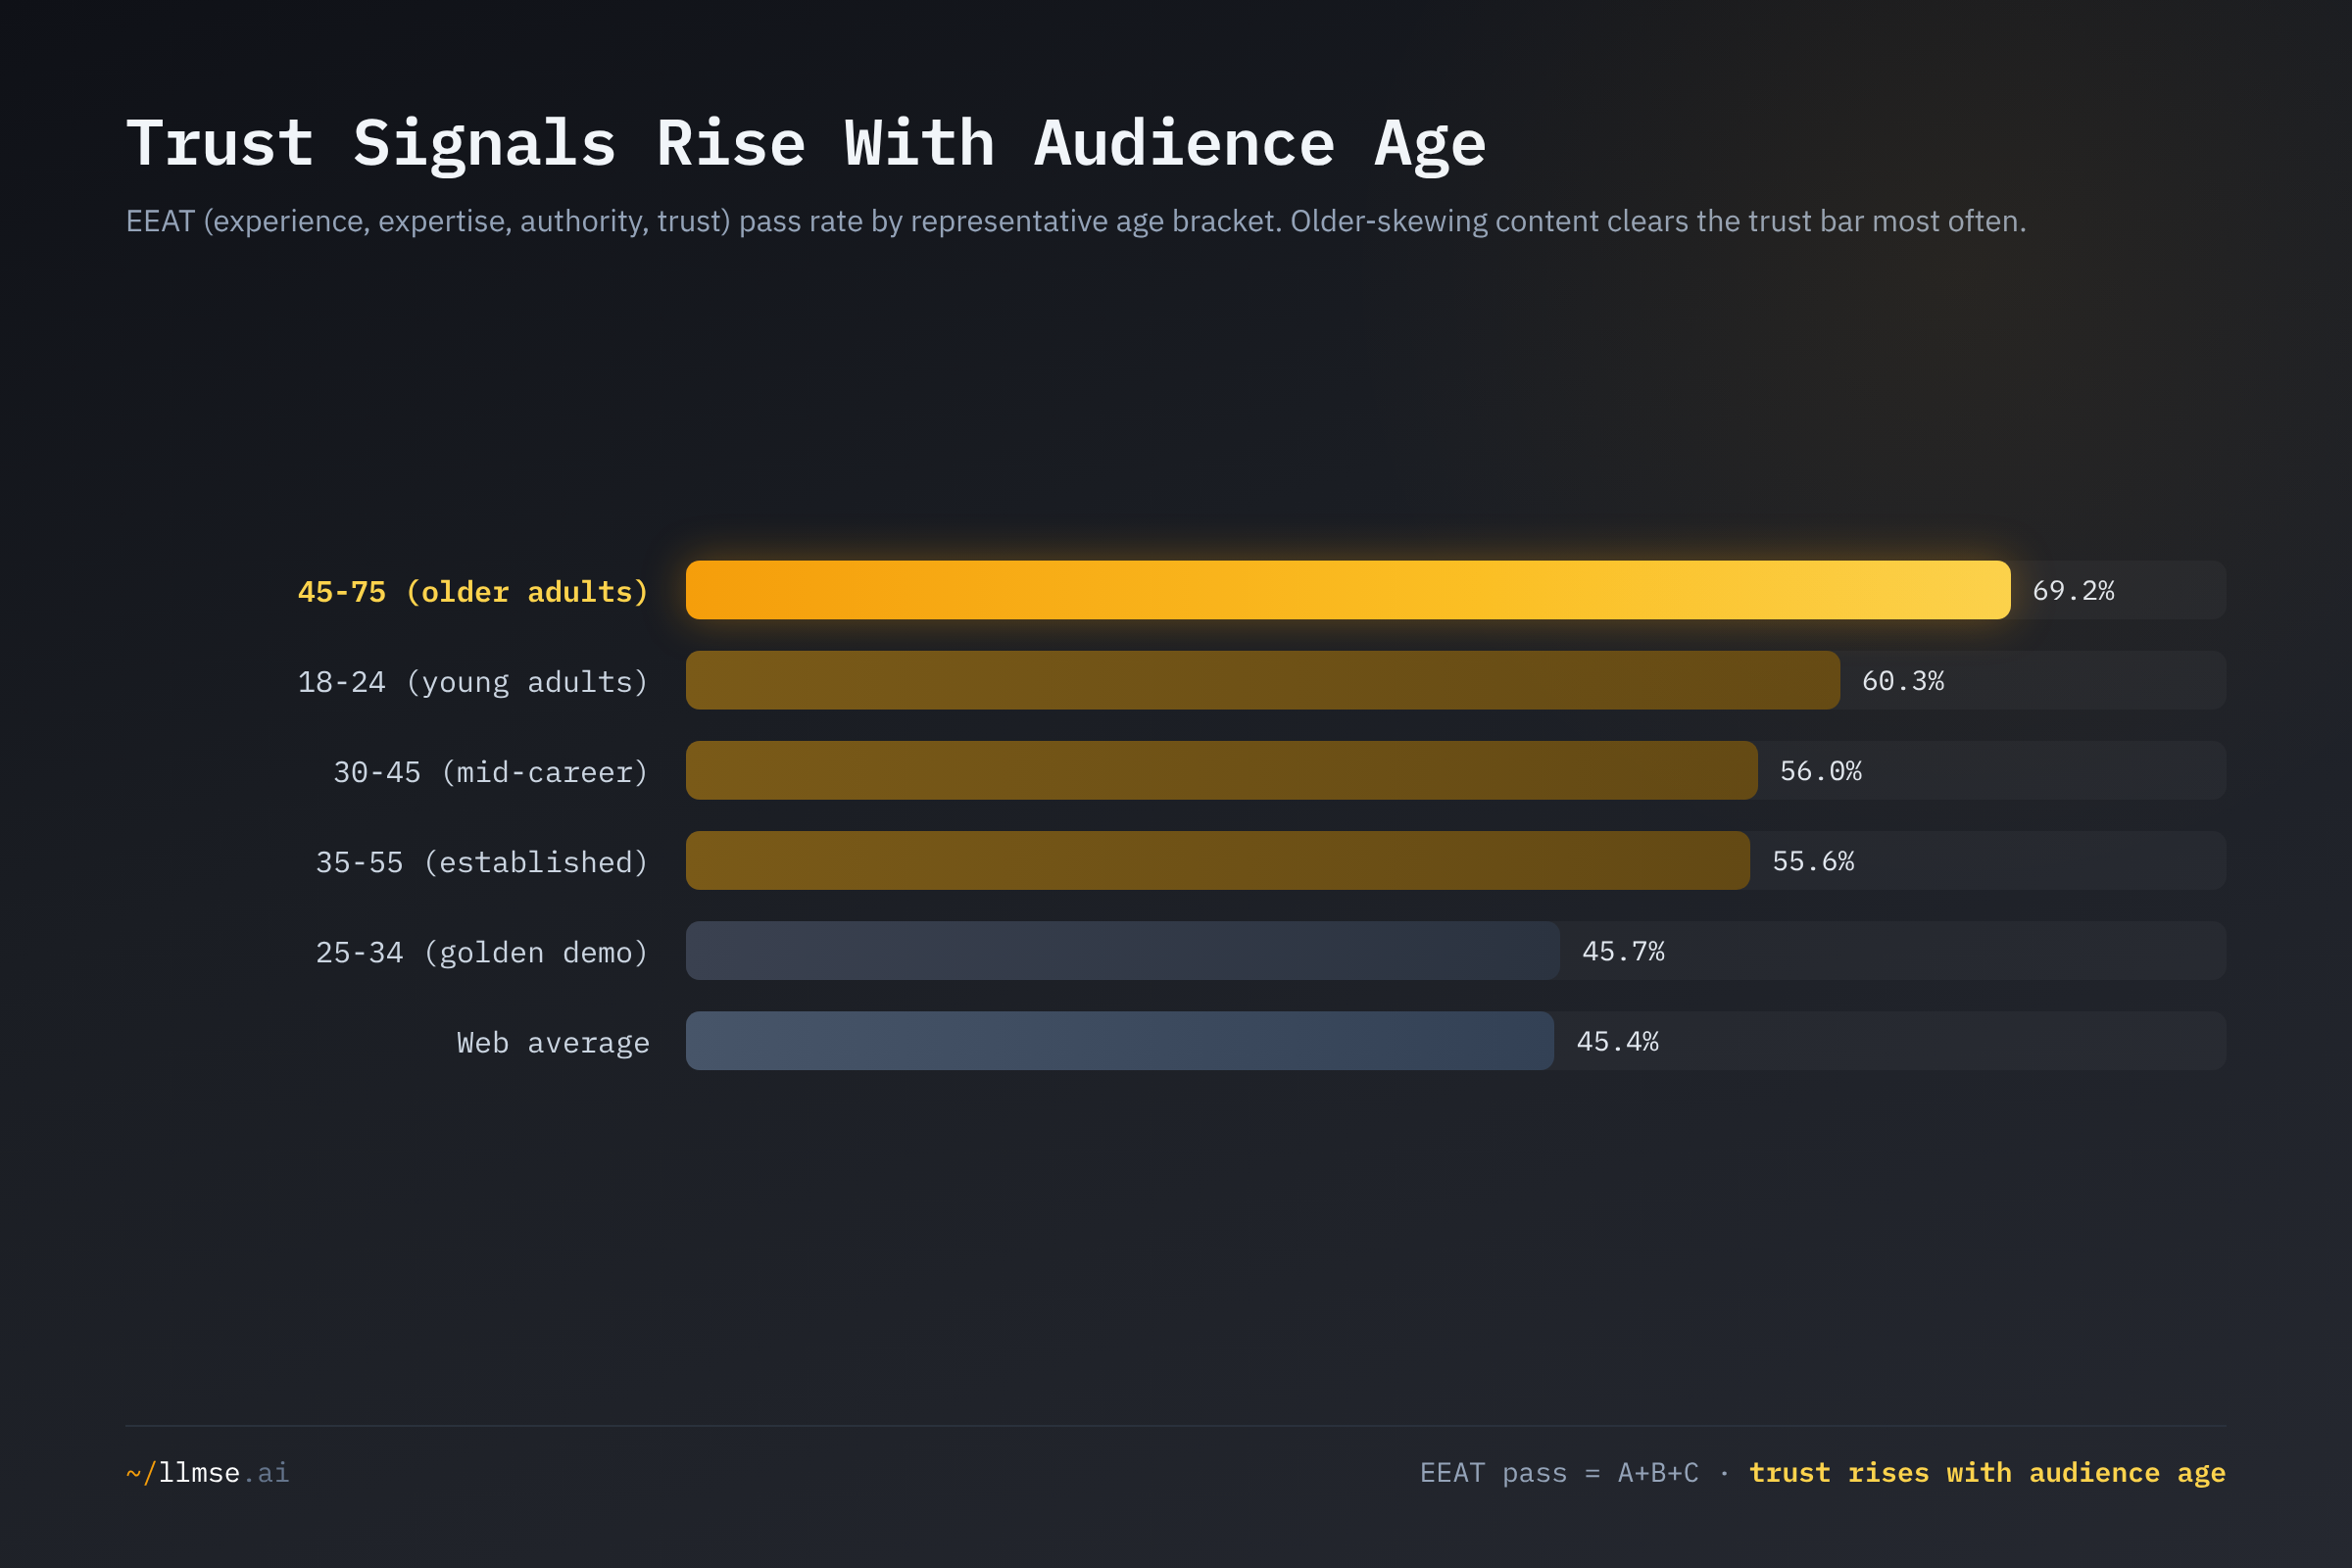
This is also where the original analysis was wrong, and the refresh corrects it. In February 2026, on a sample of only 6,247 graded sites, Gen Z (18-24) content posted the worst EEAT of any cohort. Against a graded population that is now nearly ten times larger, 18-24 content passes EEAT at 60.3% — the second-highest bracket on the board, behind only older adults. The cohort that looked like the trust laggard was a small-sample artifact; the College Education and Career content that dominates the bracket carries real institutional authority once enough of it is graded. The genuine trust laggard is the golden demographic itself: 25-34 content sits at 45.7%, essentially the web average, weighed down by the sheer volume of ordinary small-business pages that fill it. The sentiment anomaly washed out the same way — 18-24 content, once reported as just 37% positive, is now 88.8% positive, in line with every other bracket (89-95% Good). Both Gen Z "anomalies" were snapshot noise, and both are dropped.
Discoverability: The Older-Audience Blind Spot
If trust rises with audience age, discoverability collapses with it. Older-audience content passes technical SEO at just 1.0% and AI-answer optimization at 0.6% — the worst of any bracket on both axes, roughly a third of the already-low web rate for AEO. The mid-career 30-45 bracket leads SEO at 2.4% and 18-24 leads AEO at 2.3%, but the spread is narrow because discoverability is a near-universal failure: no bracket clears 2.5% SEO, and the whole web passes at 1.9%.
The pattern is consistent with how older-audience content reaches its users. Entertainment brands, broadcast-news sites, and local outlets rely on direct navigation, broadcast cross-promotion, and established habit rather than search crawlers or answer engines — so the structured markup, clean metadata, and extractable-answer formatting that SEO and AEO reward are an afterthought. It is the same dynamic the State of Website SEO 2026 documented across the whole web, concentrated at the older end of the audience spectrum. As AI answer engines replace blue links for more queries, the content that is most trusted but least optimized is precisely the content that will be hardest for those engines to surface and cite.
Readability and Accessibility: A Definitional Correction
Readability moves the opposite way from trust. The golden demographic (25-34) leads readability at 38.0%, while older-audience content trails at 20.4% — the worst bracket and well below the 32.8% web average. Business, shopping, and service content written for conversion rewards plain, scannable prose; the dense news, history, and hobby content older audiences consume does not. This finding held from the original analysis and is now on a far larger sample.
Accessibility is where the definition matters, and where the original's headline does not survive. On the standard A+B+C WCAG pass — the same definition used across LLMSE's quality reporting — older-audience content actually leads the board at 64.4%, against a 43.8% web average. That reverses the original post's claim that older-audience sites were the least accessible, which was computed on an A+B basis over a 375-site sample. The reconciliation is in the grade distribution: 51% of older-audience sites land at WCAG grade C — borderline-passing, not excellent. At the strict top tier (A+B "strong accessibility"), older-audience content is in fact lowest, at 13.8%, versus 30.7% for 18-24. So the corrected reading is narrower and more accurate: older-audience content clears the basic accessibility bar at the highest rate (large WordPress-built media and news templates tend to pass static checks), but reaches the top accessibility tier least often. The same C-grade clustering explains its category-leading privacy (64.0%) and basic-WCAG scores — consistent mid-grade templates, rarely excellent, rarely failing.
Gender: Targeting Splits Hard by Age
Audience age and audience gender are tightly coupled, and the swing across the range is extreme.
| Bracket | Male | Female | All (neutral) |
|---|---|---|---|
| 18-24 | 18.2% | 67.2% | 14.6% |
| 25-34 | 48.2% | 51.8% | 0.0% |
| 30-45 | 99.9% | 0.1% | 0.0% |
| 35-55 | 56.6% | 42.0% | 1.4% |
| 45-75 | 9.4% | 17.6% | 73.0% |
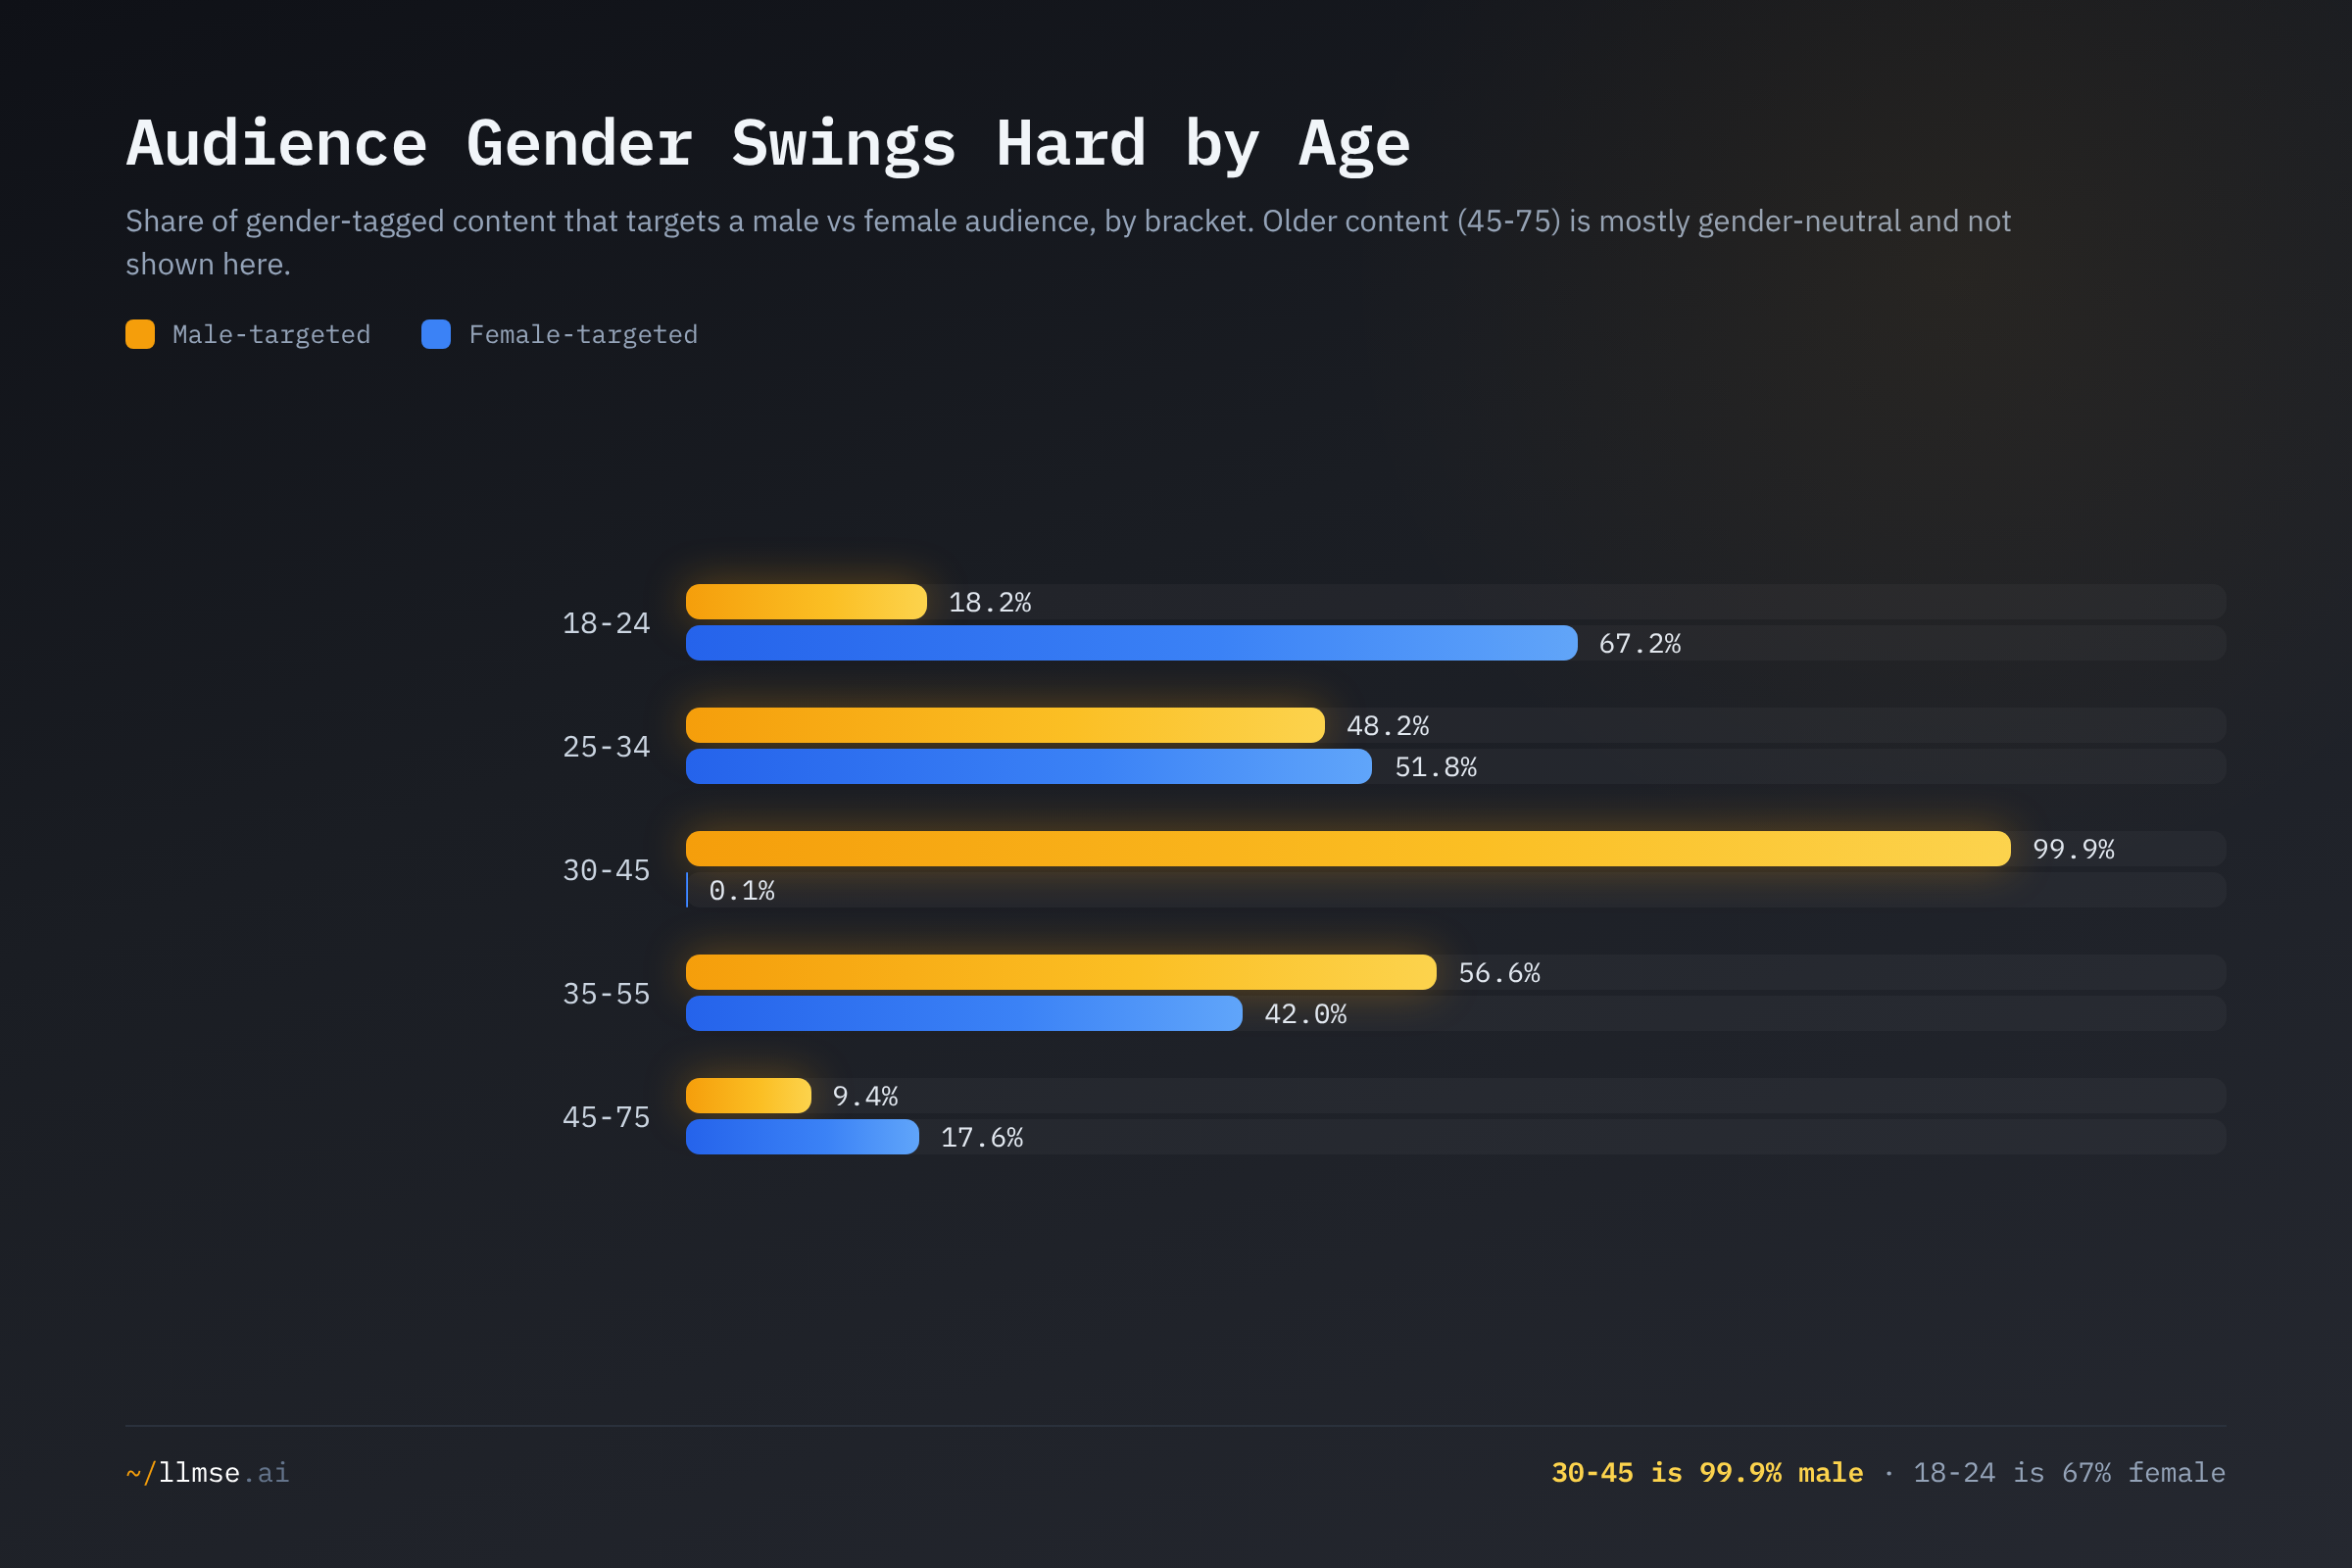
Young-adult content (18-24) skews 67.2% female — driven by the education and lifestyle content that dominates the bracket — while the mid-career 30-45 bracket is 99.9% male-targeted, a direct reflection of its Business & Industry monoculture. The 25-34 bracket is the most balanced, near 50/50, and older-audience content (45-75) is 73.0% gender-neutral, consistent with broadcast entertainment and general-interest news written for everyone. The largest, most commercially valuable bracket on the web is also its most gender-lopsided, which is a structural fact worth sitting with: the content built for the people who sign purchase orders is modeled almost entirely as male.
What's at Stake
- The web serves buyers, not users. Content targeting peaks at 30-45 while the heaviest internet use sits younger — Pew finds 63% of 18-29 year-olds are online "almost constantly" versus 54% of 30-49 and just 14% of those 65+. The web follows purchasing authority and decision-making, not eyeball-hours. As Gen Z's spending power matures, the gap between where attention concentrates and where content is built will be a standing commercial opportunity for whoever closes it first.
- The most trusted content is the least findable. Older-audience content leads trust, privacy, and basic accessibility but trails badly on SEO and AEO. As AI answer engines inherit discovery from blue links, credible, authoritative content that was never optimized for extraction risks being invisible to the very systems users increasingly ask — while thinner, better-optimized content gets surfaced in its place.
- The accessibility gap is a top-tier gap, not a pass/fail gap. Older-audience content clears basic WCAG checks at the highest rate but reaches the strong (A+B) accessibility tier least often (13.8%). With 78% of adults 65+ now owning a smartphone and the WEF flagging design as a core barrier for older users, "borderline-passing" is not good enough for the audience most likely to need larger text, higher contrast, and cleaner navigation.
- 154 brackets do not fit 7. Content is created on a 154-bracket, mostly-20-year-wide grid; advertising is bought on Google's seven decade-long buckets. That mismatch quietly misallocates spend — a "30-50 professional" site is split across two ad brackets and fully captured by neither — and it grows as targeting shifts from cookie-based demographics toward first-party behavioral signals.
What Would Help
- Brand and media teams: plan against the real distribution, not the legacy bracket. The web's content mass sits at 30-45, not 25-34, and on a 20-year-wide grid. Audit where your audience's content actually concentrates with age-filtered search (
a:30-45,a:25-34,a:18-24) before assuming the seven-bracket model describes your market. - Publishers serving older audiences: fix discoverability, not credibility. Your trust and privacy signals already lead the web; your SEO (1.0%) and AEO (0.6%) are the worst of any bracket. Clean metadata, structured data, and extractable answers are the cheapest wins available, and they are what decides whether AI answer engines cite your authoritative content or someone else's optimized content.
- Editorial teams targeting older and YMYL-adjacent audiences: treat readability as a first-class obligation. Older-audience content is the hardest to read on the web (20.4% pass) and search rewards plain language for no one. Plain-language editing is the one quality investment that pays off only for your users — and they are the audience least served by dense prose.
- Accessibility teams: move older-audience content from grade C to grade A. The basic-pass rate is high but the strong-accessibility tier (13.8%) is the lowest on the board. Contrast, focus order, and semantic structure on the WordPress-heavy media and news templates that dominate this bracket would lift the audience that benefits most. Check any site's grades with the WCAG analyzer.
- Advertisers and ad platforms: reconcile the 7-bracket model with 154-bracket reality. Content targeting and ad targeting are modeling different grids. Mapping campaigns to the wide, overlapping ranges content is actually built for — rather than forcing it into decade-long buckets — would reduce the systematic mismatch between how content is created and how it is monetized.
This analysis was conducted using LLMSE, which has classified over 3.4 million websites across SEO, EEAT, AEO, WCAG accessibility, readability, GARM brand safety, and privacy dimensions. Age figures reflect 3,362,343 age-classified URLs across 154 brackets in the index as of June 2026. To analyze your own site across every dimension in this post, visit llmse.ai/classify.