The Gender Skew of the Web: 55% of Content Targets Men, but Female-Targeted Content Scores Higher on Trust
Update — 2026-06-29: Refreshed against LLMSE's current index of 3.4 million classified URLs (up from ~1.4M at first publication), now graded across six quality dimensions including the added AEO and Privacy axes, on grade samples that are 20-60x larger than the original's. The headline split is essentially unchanged — 55.0% male / 27.5% female / 17.5% neutral — and female-targeted content still scores markedly higher on trust, so the core thesis holds. But two original sub-claims have reversed on the larger data and are corrected here: the male WCAG-accessibility edge is gone (gender-neutral content now leads accessibility), and male content no longer carries roughly triple the "Bad"-sentiment rate (it is now statistically even across genders). The EEAT trust gap also halved, from ~17 points to 9. Curated subcategory tables the original could not reproduce (Programming, Clothing, Tennis, Mental Health) have been dropped in favor of all-category aggregates.
Who is the web built for? Not who visits it — who its content appears designed to reach. We classified 3.36 million sites by the target-audience gender their content signals, then cross-referenced that against 58 content categories and six quality dimensions. The result is the largest public measurement of the gender composition of web content, as distinct from the gender composition of web traffic.
The two are diverging. Access has nearly equalized: the ITU's 2024 figures put global internet use at 70% of men and 65% of women, a gender-parity score of 0.94 that has climbed steadily from 0.91 in 2019, and in the United States Pew Research now measures women's internet use at 97% against men's 96% — women are, if anything, slightly ahead. Women are roughly half of the people online.
They are not roughly half of who the web is written for. Of the 3.36 million sites tagged with a target gender, 55.0% target a male audience and just 27.5% target a female one. The access gap is closing; the content gap is not. And the interesting part is not the imbalance itself but what happens to measurable quality when content is written for women rather than men.
Each grade below comes from LLMSE's automated analysis pipeline — SEO, AEO (AI-answer optimization), EEAT (trust signals), WCAG accessibility, readability, privacy compliance, and GARM brand safety — applied uniformly across the index, not a hand-picked sample of famous brands. Target gender is inferred during LLM classification from a page's topics, tone, imagery, and product framing, with three possible values: Male, Female, or All (gender-neutral).
The web skews male, but female-targeted content is measurably higher-quality on the signals that matter most for trust. Female-targeted sites pass EEAT at 52.7% versus 43.7% for male-targeted, lead on privacy (43.9% vs 36.3%), and are the most brand-safe of any audience (97.2% GARM-safe vs 90.7%). Two advantages the original post awarded to male-targeted content — accessibility and cleaner sentiment — have evaporated on the larger dataset.
The Data
| Target gender | Sites | Share |
|---|---|---|
| Male | 1,847,993 | 55.0% |
| Female | 925,589 | 27.5% |
| Gender-neutral | 588,672 | 17.5% |
| Total tagged | 3,362,254 | 100% |
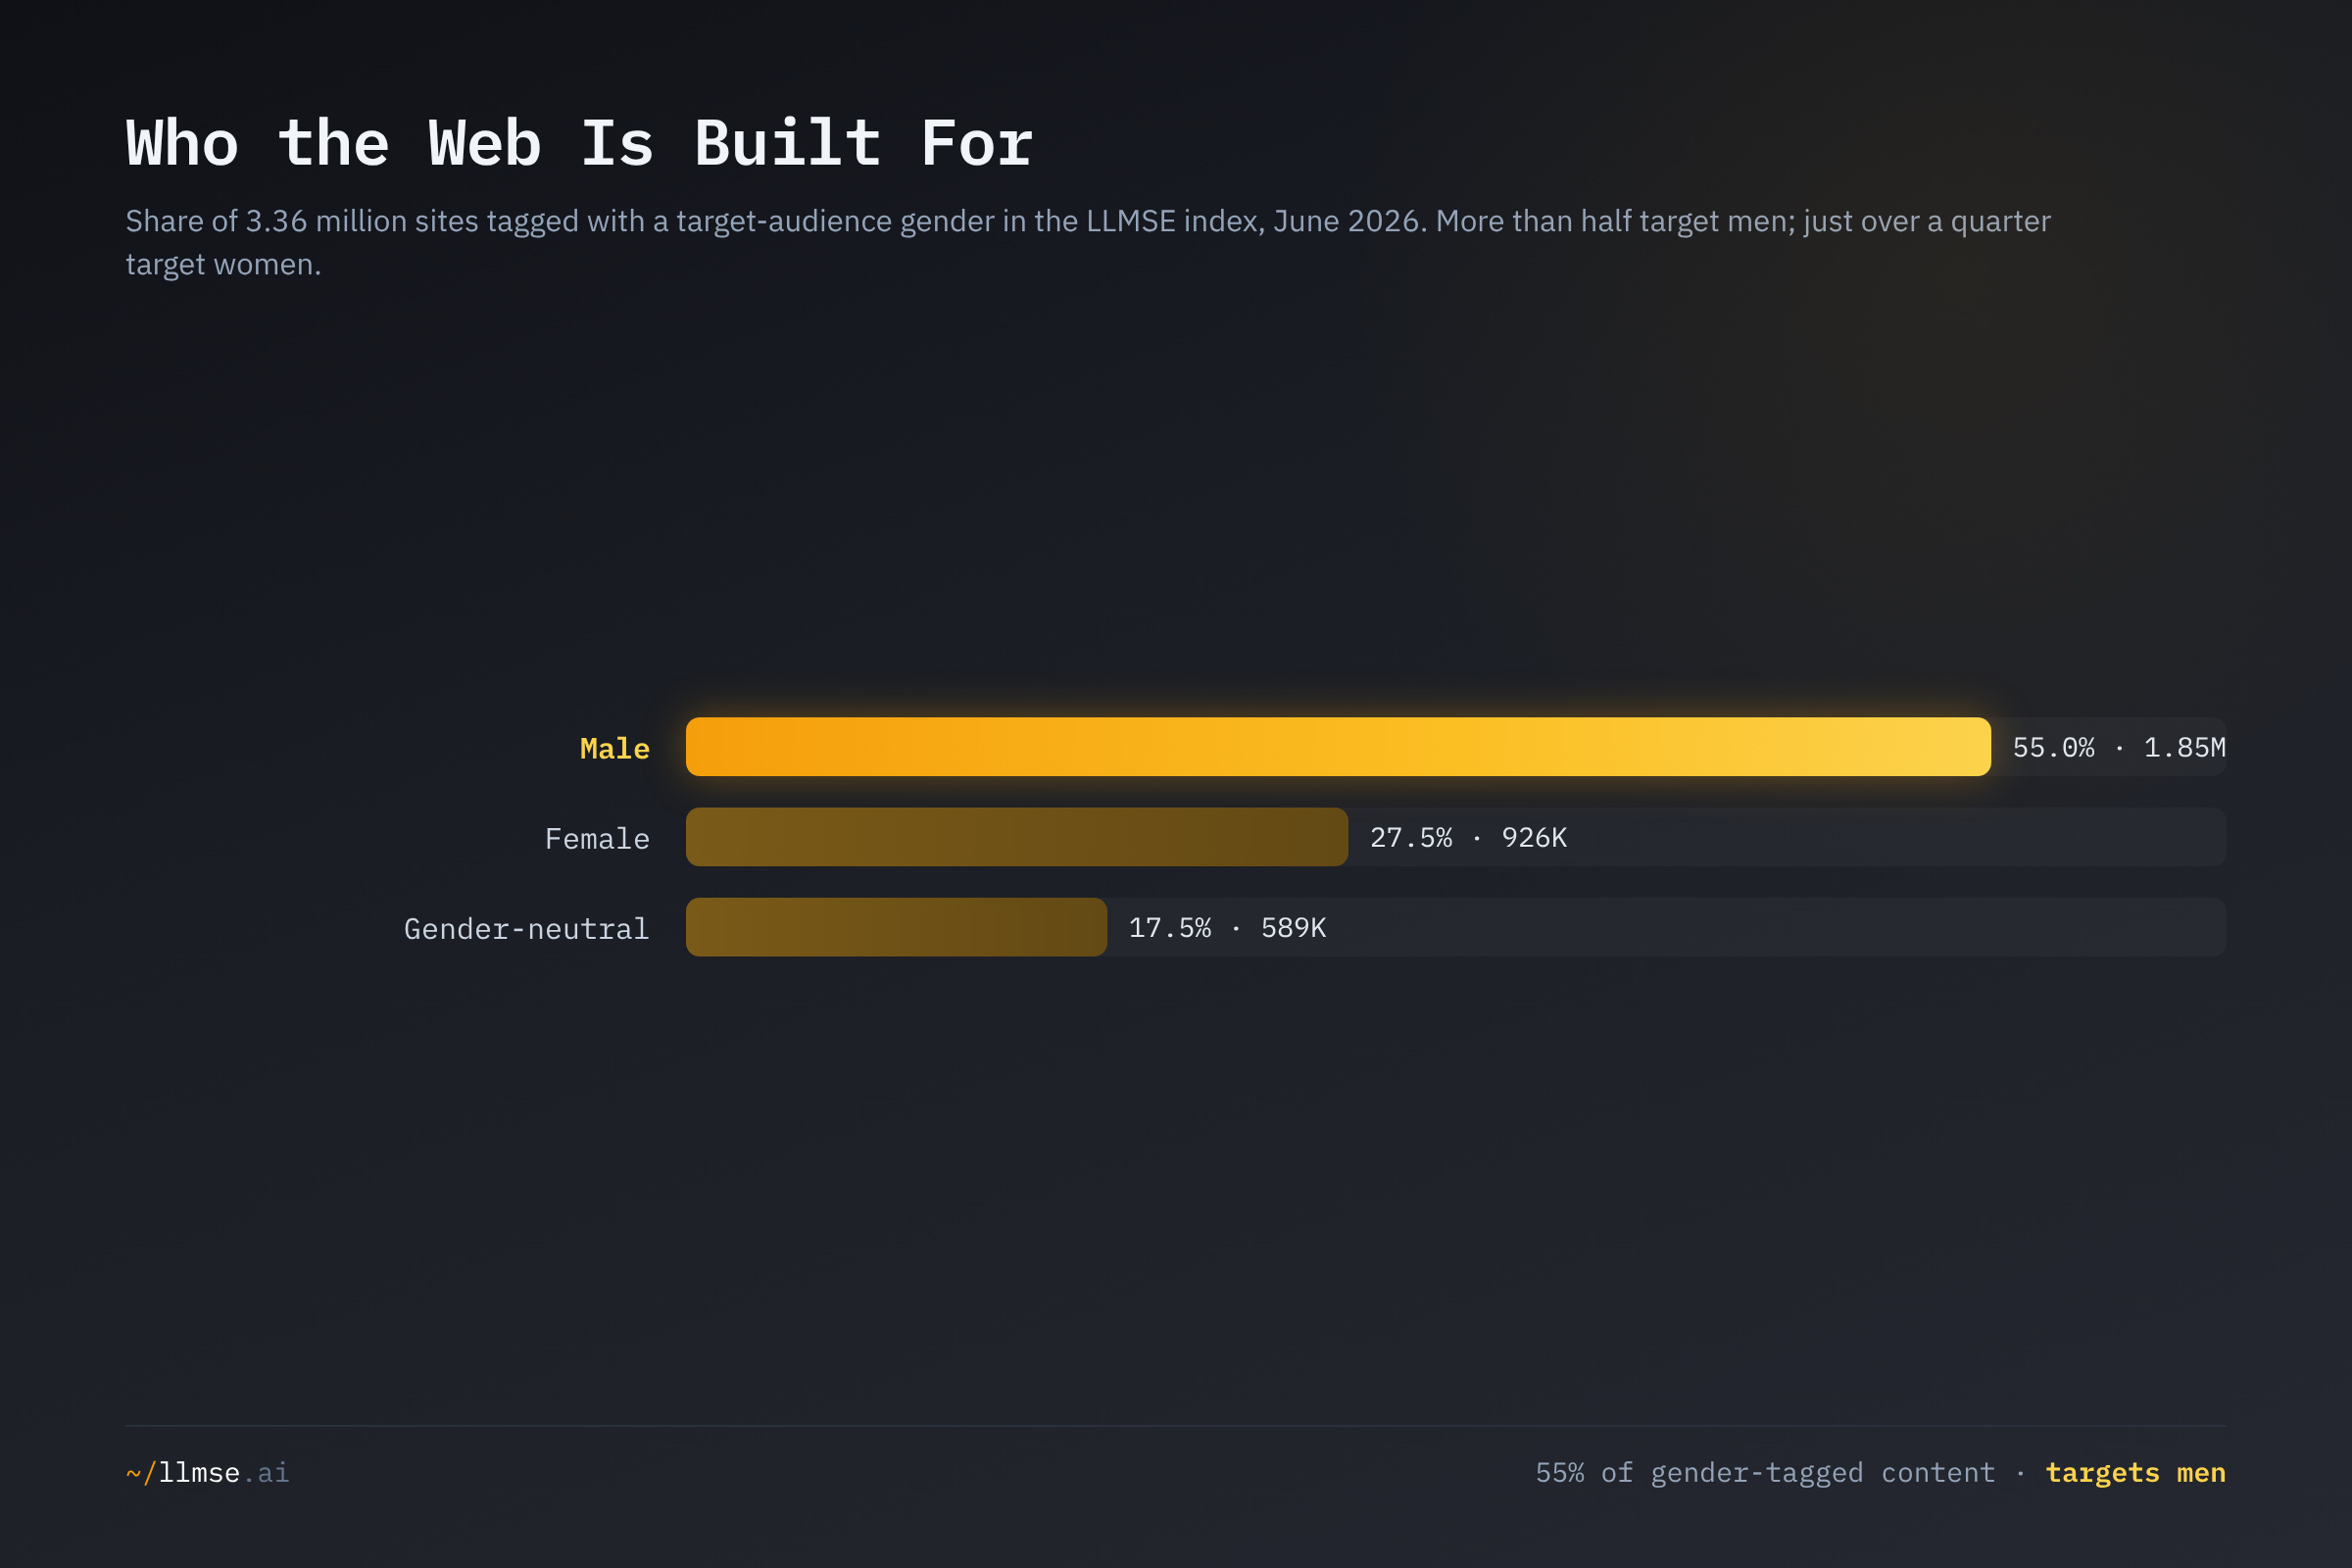
More than half of all gender-tagged web content targets a male audience; just over a quarter targets women. The remaining 17.5% — reference material, news, weather, infrastructure listings — is written for no particular gender. This measures how the web is designed, not how it is consumed: it is the dominant signal of a homepage's content, tone, and subject matter, not a count of visitors.
Coverage is now deep on every dimension, which is what makes the corrections in this update trustworthy rather than noise. Where the original post's accessibility and readability findings rested on 9,000-to-34,000-site samples per gender, the current grades cover 1.8 million male-targeted, 915,000 female-targeted, and 580,000 gender-neutral sites on each of WCAG, readability, and privacy. The small-sample caveats that hedged the original's quality claims no longer apply.
Methodology
This post makes quantitative comparisons across audiences, so the definitions and limits matter.
- Grades and "pass." Each site is graded A-F by a dedicated automated analyzer (there is no E grade). "Pass" means A+B+C for SEO, AEO, EEAT, WCAG, and Privacy, and A+B for Readability (a Flesch Reading Ease score of roughly 50+, ≈ 8th-grade level or below). GARM "brand-safe" counts A only (the GARM Brand Suitability floor). SEO grades technical fundamentals; AEO grades answer-extractability and AI-citation signals; EEAT grades experience/expertise/authoritativeness/trust signals; WCAG covers automated accessibility checks (~30-40% of WCAG 2.1 Level A — manual testing is required for full conformance); Privacy grades consent gating, policy presence, and tracker behavior.
- Gender assignment. Target gender is detected during LLM classification — Male, Female, or All — from content topics, tone, imagery, product types, and language patterns. It reflects the intended audience a page's content signals, not its actual visitors, and it encodes whatever biases exist in the classifier's training data. The binary-plus-neutral scheme does not capture non-binary targeting. Sites with mixed content (a news site with both a sports desk and a lifestyle desk) are classified on the dominant homepage signal.
- Cross-references are computed as set intersections (Redis
ZINTERCARD) between a gender index (sex-male,sex-female,sex-all) and each grade or category index. Category shares are computed over the gender-tagged population of each category — the sum of its male, female, and neutral intersections — not its raw size. All counts are aggregate; no individual site is identified. - Known limits. Pass rates are over the population actually graded on each dimension. The Readability grade uses Flesch scoring, which is calibrated for English, so cross-language readability is treated as indicative, not exact. Counts are a live snapshot and drift as classification continues. Russian-language sites are excluded from every aggregate.
- Why these numbers differ from the 2026-02 original. The graded population grew from ~1.4M to ~3.4M sites, and the quality-grade samples grew far more (early WCAG/readability coverage was a few tens of thousands of sites per gender; it is now hundreds of thousands to millions). Early grades were biased toward higher-quality, more-visible sites, so most absolute pass rates fell as coverage broadened — female EEAT moved from 60.3% to 52.7%, and the cross-gender EEAT gap narrowed from ~17 points to 9. Two findings reversed outright on the larger sample (WCAG and sentiment), and the original's hand-picked subcategory tables — which relied on indices this toolkit cannot reproduce read-only — were dropped.
The Scorecard
Pass rate by target-audience gender across all seven graded dimensions. The leading gender in each row is bolded.
| Dimension | Male | Female | Neutral | Web average |
|---|---|---|---|---|
| SEO | 2.2% | 1.8% | 1.4% | 1.9% |
| AEO (AI answers) | 1.7% | 1.3% | 1.1% | 1.5% |
| EEAT (trust) | 43.7% | 52.7% | 38.0% | 45.4% |
| WCAG (accessibility) | 43.3% | 42.4% | 48.1% | 43.8% |
| Readability | 30.5% | 35.1% | 36.1% | 32.8% |
| Privacy | 36.3% | 43.9% | 27.5% | 37.0% |
| GARM brand-safe (A) | 90.7% | 97.2% | 77.8% | 90.2% |
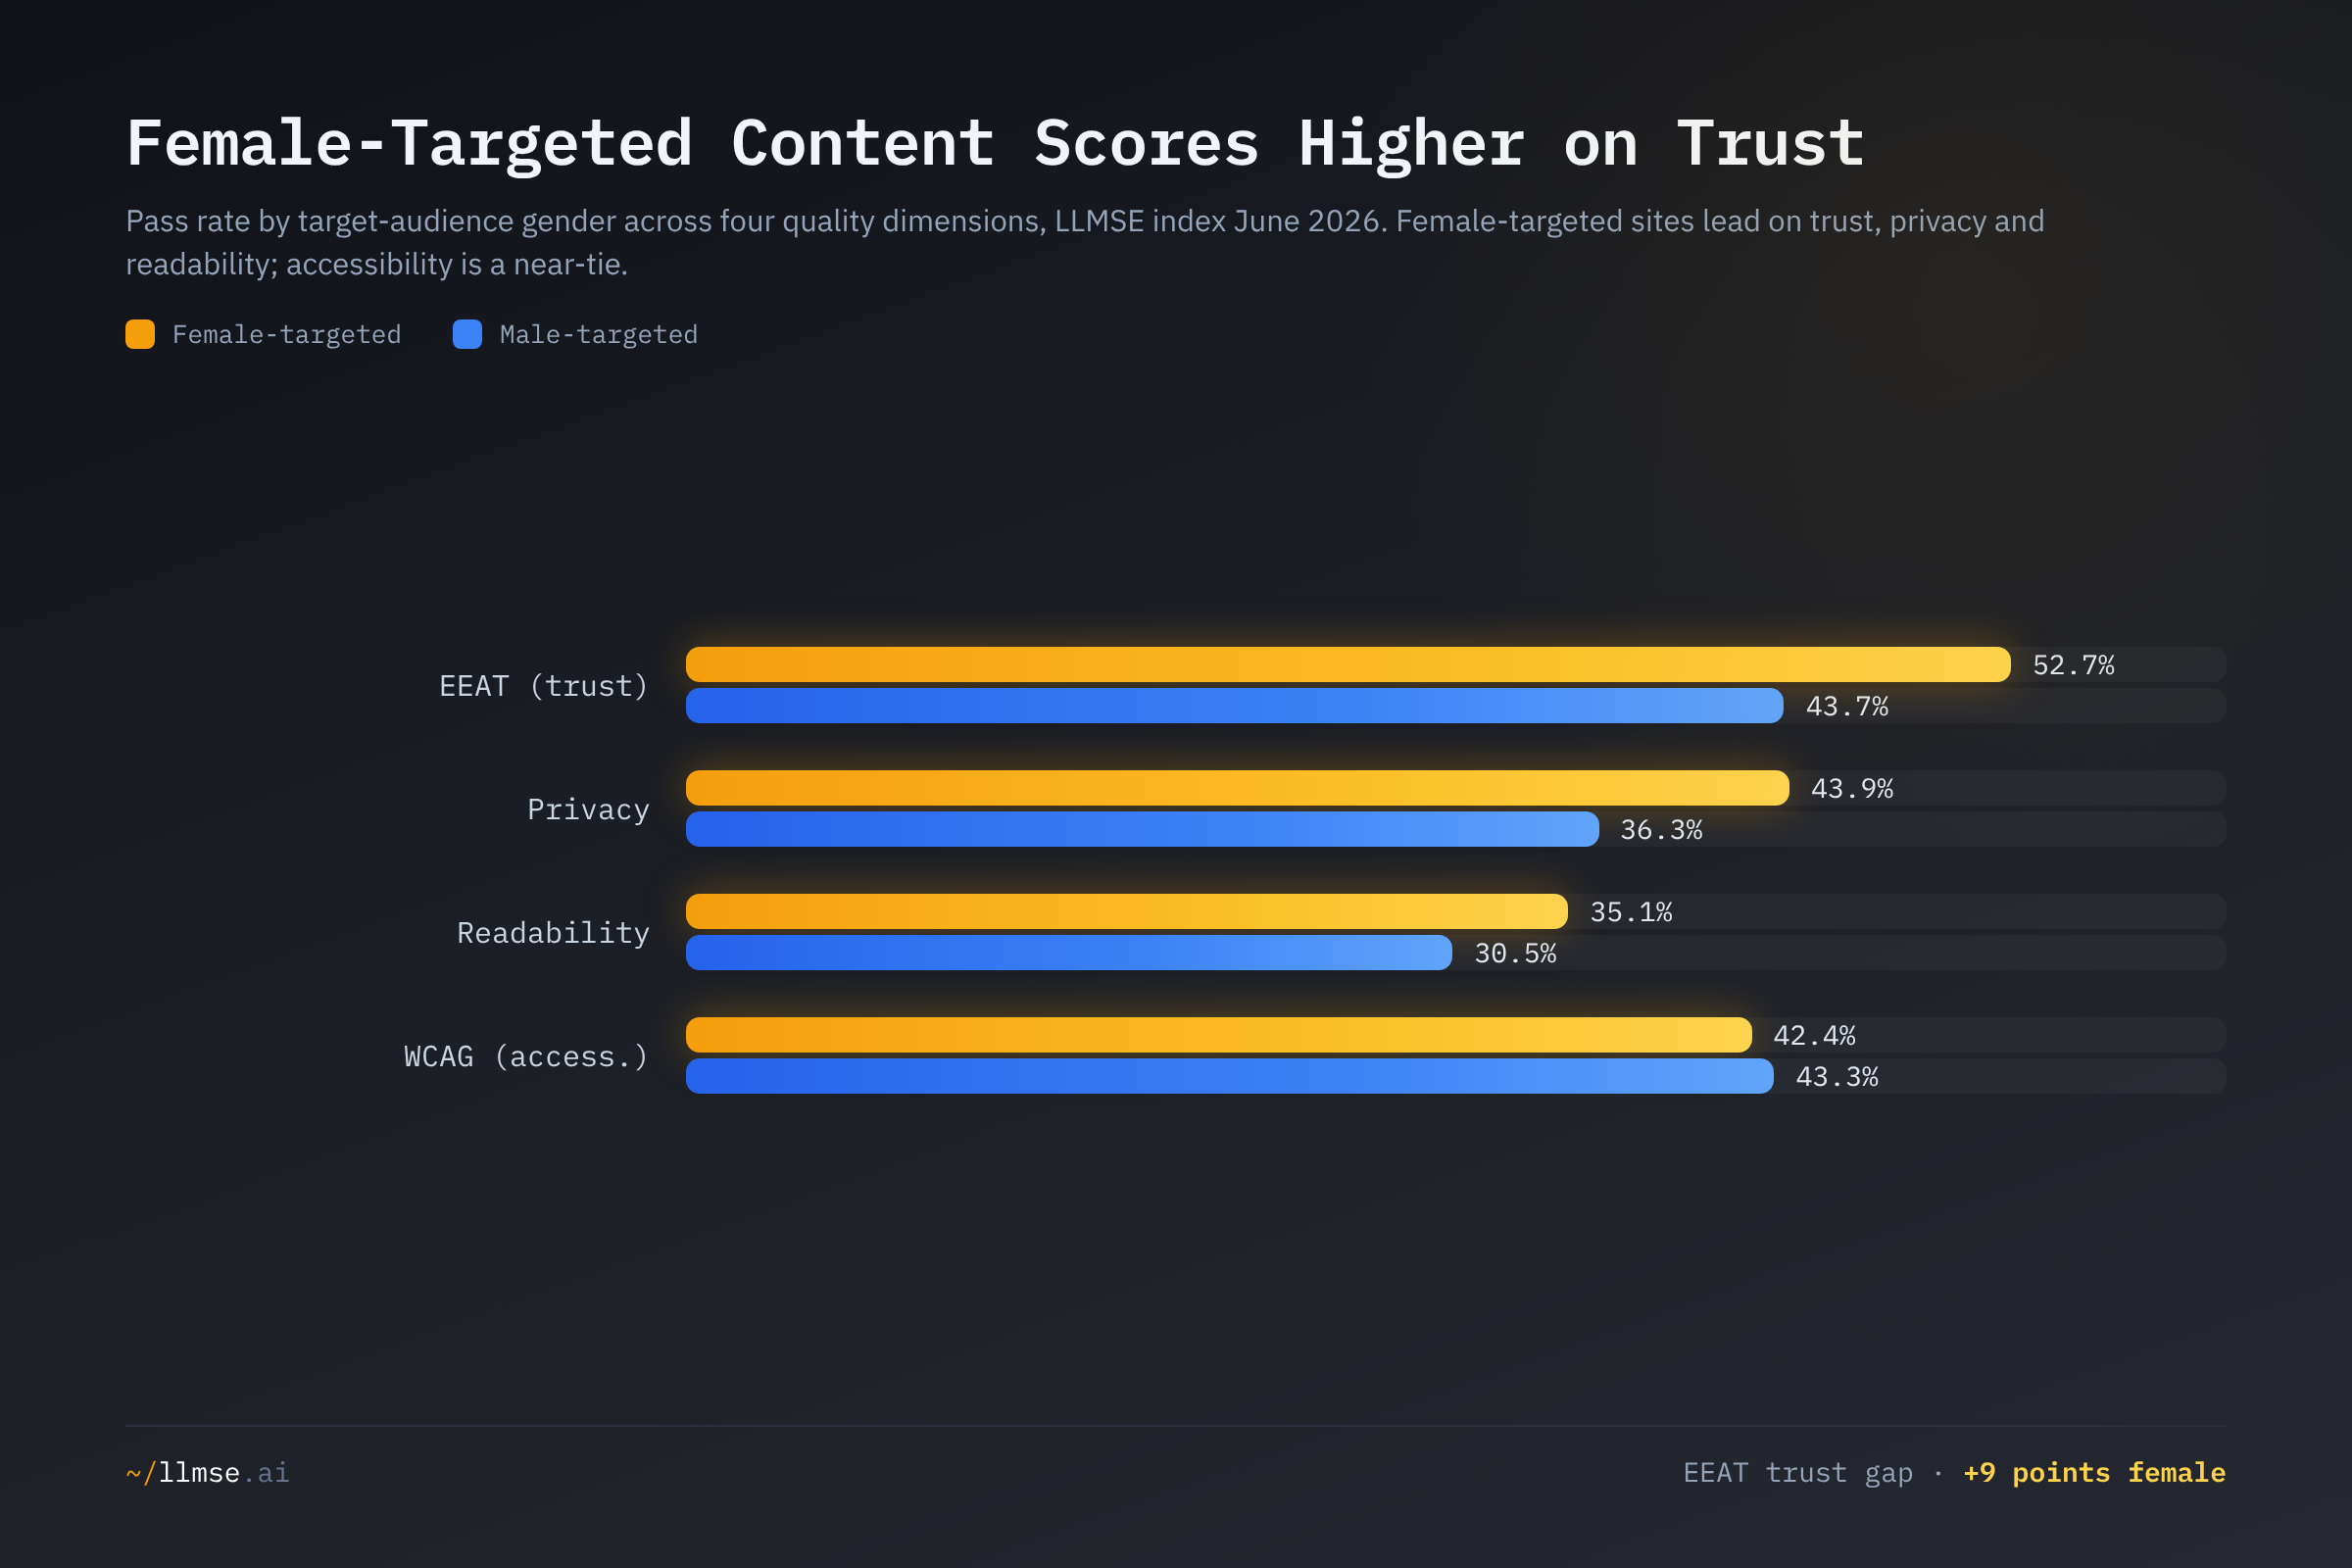
No single audience leads everywhere, but female-targeted content owns the dimensions that signal credibility. Female-targeted sites top EEAT, privacy, and brand safety, and edge ahead on readability; male-targeted sites hold only a narrow lead on the two discovery axes (SEO and AEO); gender-neutral content quietly leads accessibility and readability while trailing badly on privacy and brand safety. The headline contrast — female content scores +9 points on trust and +7.6 on privacy — is the durable finding of this study. The two places the original gave men an edge, accessibility and sentiment, are now a tie or a reversal, examined below.
Trust: Female-Targeted Content Earns the Web's Higher EEAT
The single largest, most consistent gap in the data is trust: female-targeted content passes EEAT at 52.7% against 43.7% for male-targeted — a 9-point advantage on a sample of nearly three million graded sites.
| Target gender | Graded | A | B | C | D | F | Pass |
|---|---|---|---|---|---|---|---|
| Female | 917,802 | 6.8% | 20.3% | 25.5% | 38.4% | 8.9% | 52.7% |
| Male | 1,829,122 | 5.3% | 14.2% | 24.2% | 50.0% | 6.3% | 43.7% |
| Gender-neutral | 583,649 | 3.7% | 14.3% | 20.0% | 54.0% | 8.0% | 38.0% |
The gap is driven by the B band: 20.3% of female-targeted sites earn a B on EEAT versus 14.2% of male-targeted ones, while male content piles up in D (50.0% versus 38.4%). EEAT measures exactly the signals Google's Search Quality Rater Guidelines reward — author credentials, organizational identity, about and contact pages, editorial transparency, citations. Female-targeted verticals (shopping, beauty, parenting, education, lifestyle) are content categories where those signals are commercial and editorial table stakes; many male-targeted verticals (technology documentation, forums, project pages, automotive listings) carry technical substance but little explicit identity or credentialing.
This is a description, not a verdict on honesty — high EEAT reflects the presence of trust signals, not their truth. But the pattern is large and one-directional: when content is written for women, it is far more likely to show who is behind it and why they should be believed. The same gap appears, sector by sector, in the cross-industry quality report card, where Shopping (91.7% female-targeted) leads the web on trust and Computer & Electronics (96.1% male-targeted) sits dead last.
Discovery: A Narrow Male Edge in SEO and AEO
The only dimensions where male-targeted content leads are the two that govern discoverability, and the lead is slim. Male-targeted sites pass technical SEO at 2.2% and AEO at 1.7%, against 1.8% / 1.3% for female-targeted and 1.4% / 1.1% for gender-neutral. Every figure is low — discovery optimization is rare across the entire web, the central finding of The State of Website SEO 2026 — but the ordering is consistent: male, then female, then neutral.
The most plausible explanation is compositional rather than causal. The male-targeted bucket is dominated by the technology, gambling, and finance verticals, which are precisely the categories that invest most in crawlable structure, schema, and AI-citation signals (gambling alone passes AEO at 14.2%, ten times the web average — see The House Always Optimizes). The male SEO edge is a side-effect of which industries write for men, not evidence that male-targeted content is intrinsically better optimized. Strip out the hyper-optimized tech-and-gambling core and the gap would likely close.
Where the Web Is Male
| Category | Gender-tagged sites | Male | Female | Neutral |
|---|---|---|---|---|
| Military & Defense | 7,101 | 98.7% | 0.0% | 1.3% |
| Computer & Electronics | 402,858 | 96.1% | 0.6% | 3.3% |
| Adult | 36,923 | 95.8% | 3.9% | 0.3% |
| Automotive | 67,191 | 93.2% | 1.1% | 5.7% |
| Internet & Telecom | 72,592 | 90.7% | 3.0% | 6.3% |
| Gambling | 77,463 | 90.3% | 2.9% | 6.8% |
| Agriculture | 65,259 | 85.9% | 11.7% | 2.5% |
| Sports | 37,050 | 85.0% | 6.6% | 8.5% |
| Finance | 18,444 | 83.1% | 11.6% | 5.2% |
| Business & Industry | 1,024,032 | 72.8% | 22.2% | 5.0% |
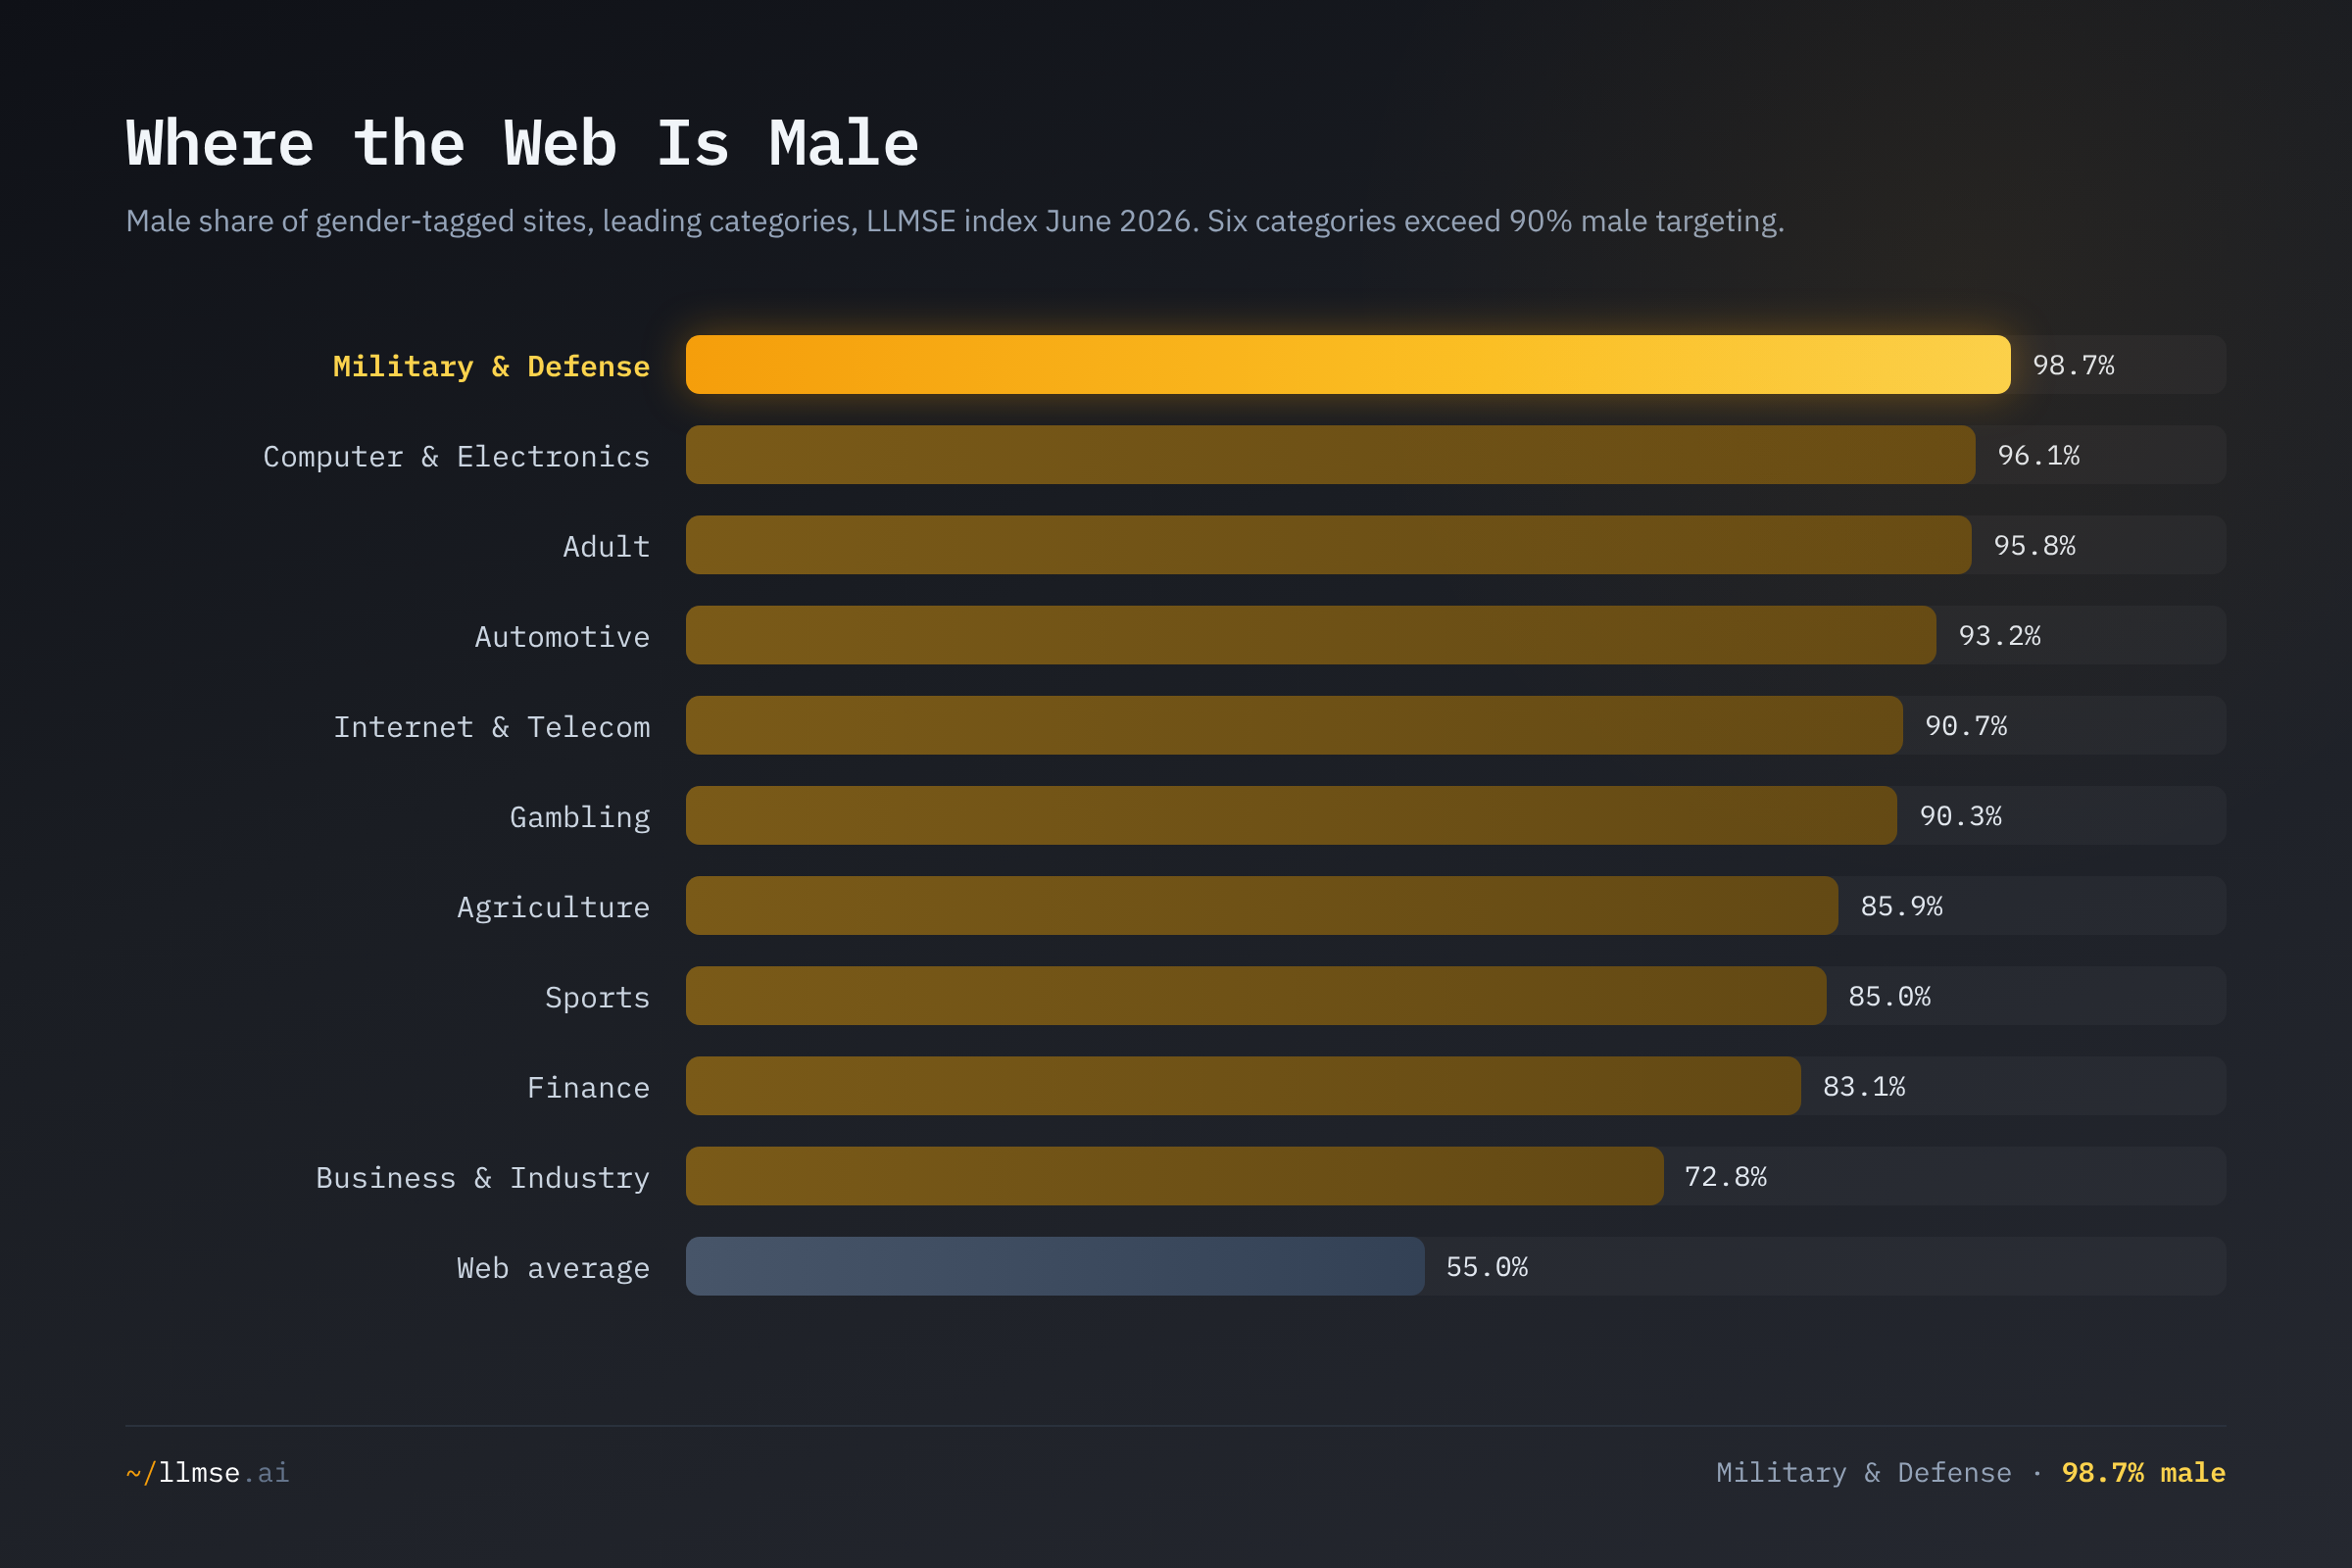
Six categories exceed 90% male targeting, and they are not niche. Computer & Electronics — 96.1% male — is the second-largest category on the web at 403,000 sites; together with Internet & Telecom, Automotive, and Gambling it forms a functionally single-gender ecosystem spanning more than 580,000 sites. Business & Industry, the largest category of all at over a million sites, is 73% male-targeted, with its 22% female share concentrated in HR, marketing, and healthcare-business sub-content.
Two corrections to the original here: Finance (83.1%) and Sports (85.0%) have both fallen below the 90% line they crossed in the 2026-02 data, as the larger sample pulled in more general-interest financial and sports content. The most-male category is no longer a consumer vertical at all but Military & Defense, at 98.7%.
Where the Web Is Female
| Category | Gender-tagged sites | Male | Female | Neutral |
|---|---|---|---|---|
| Parenting | 5,702 | 0.0% | 100.0% | 0.0% |
| Pets & Animals | 8,774 | 4.1% | 95.9% | 0.0% |
| Shopping | 41,842 | 8.1% | 91.7% | 0.2% |
| Style & Fashion | 9,136 | 9.8% | 89.2% | 1.0% |
| Fine Art | 8,154 | 0.0% | 87.4% | 12.6% |
| Education | 123,436 | 0.0% | 84.1% | 15.9% |
| Family & Relationships | 25,415 | 0.0% | 82.3% | 17.7% |
| Religion & Spirituality | 22,305 | 16.4% | 78.7% | 4.9% |
| Beauty & Fitness | 46,204 | 21.7% | 78.3% | 0.0% |
| Home & Garden | 43,923 | 37.4% | 54.9% | 7.7% |
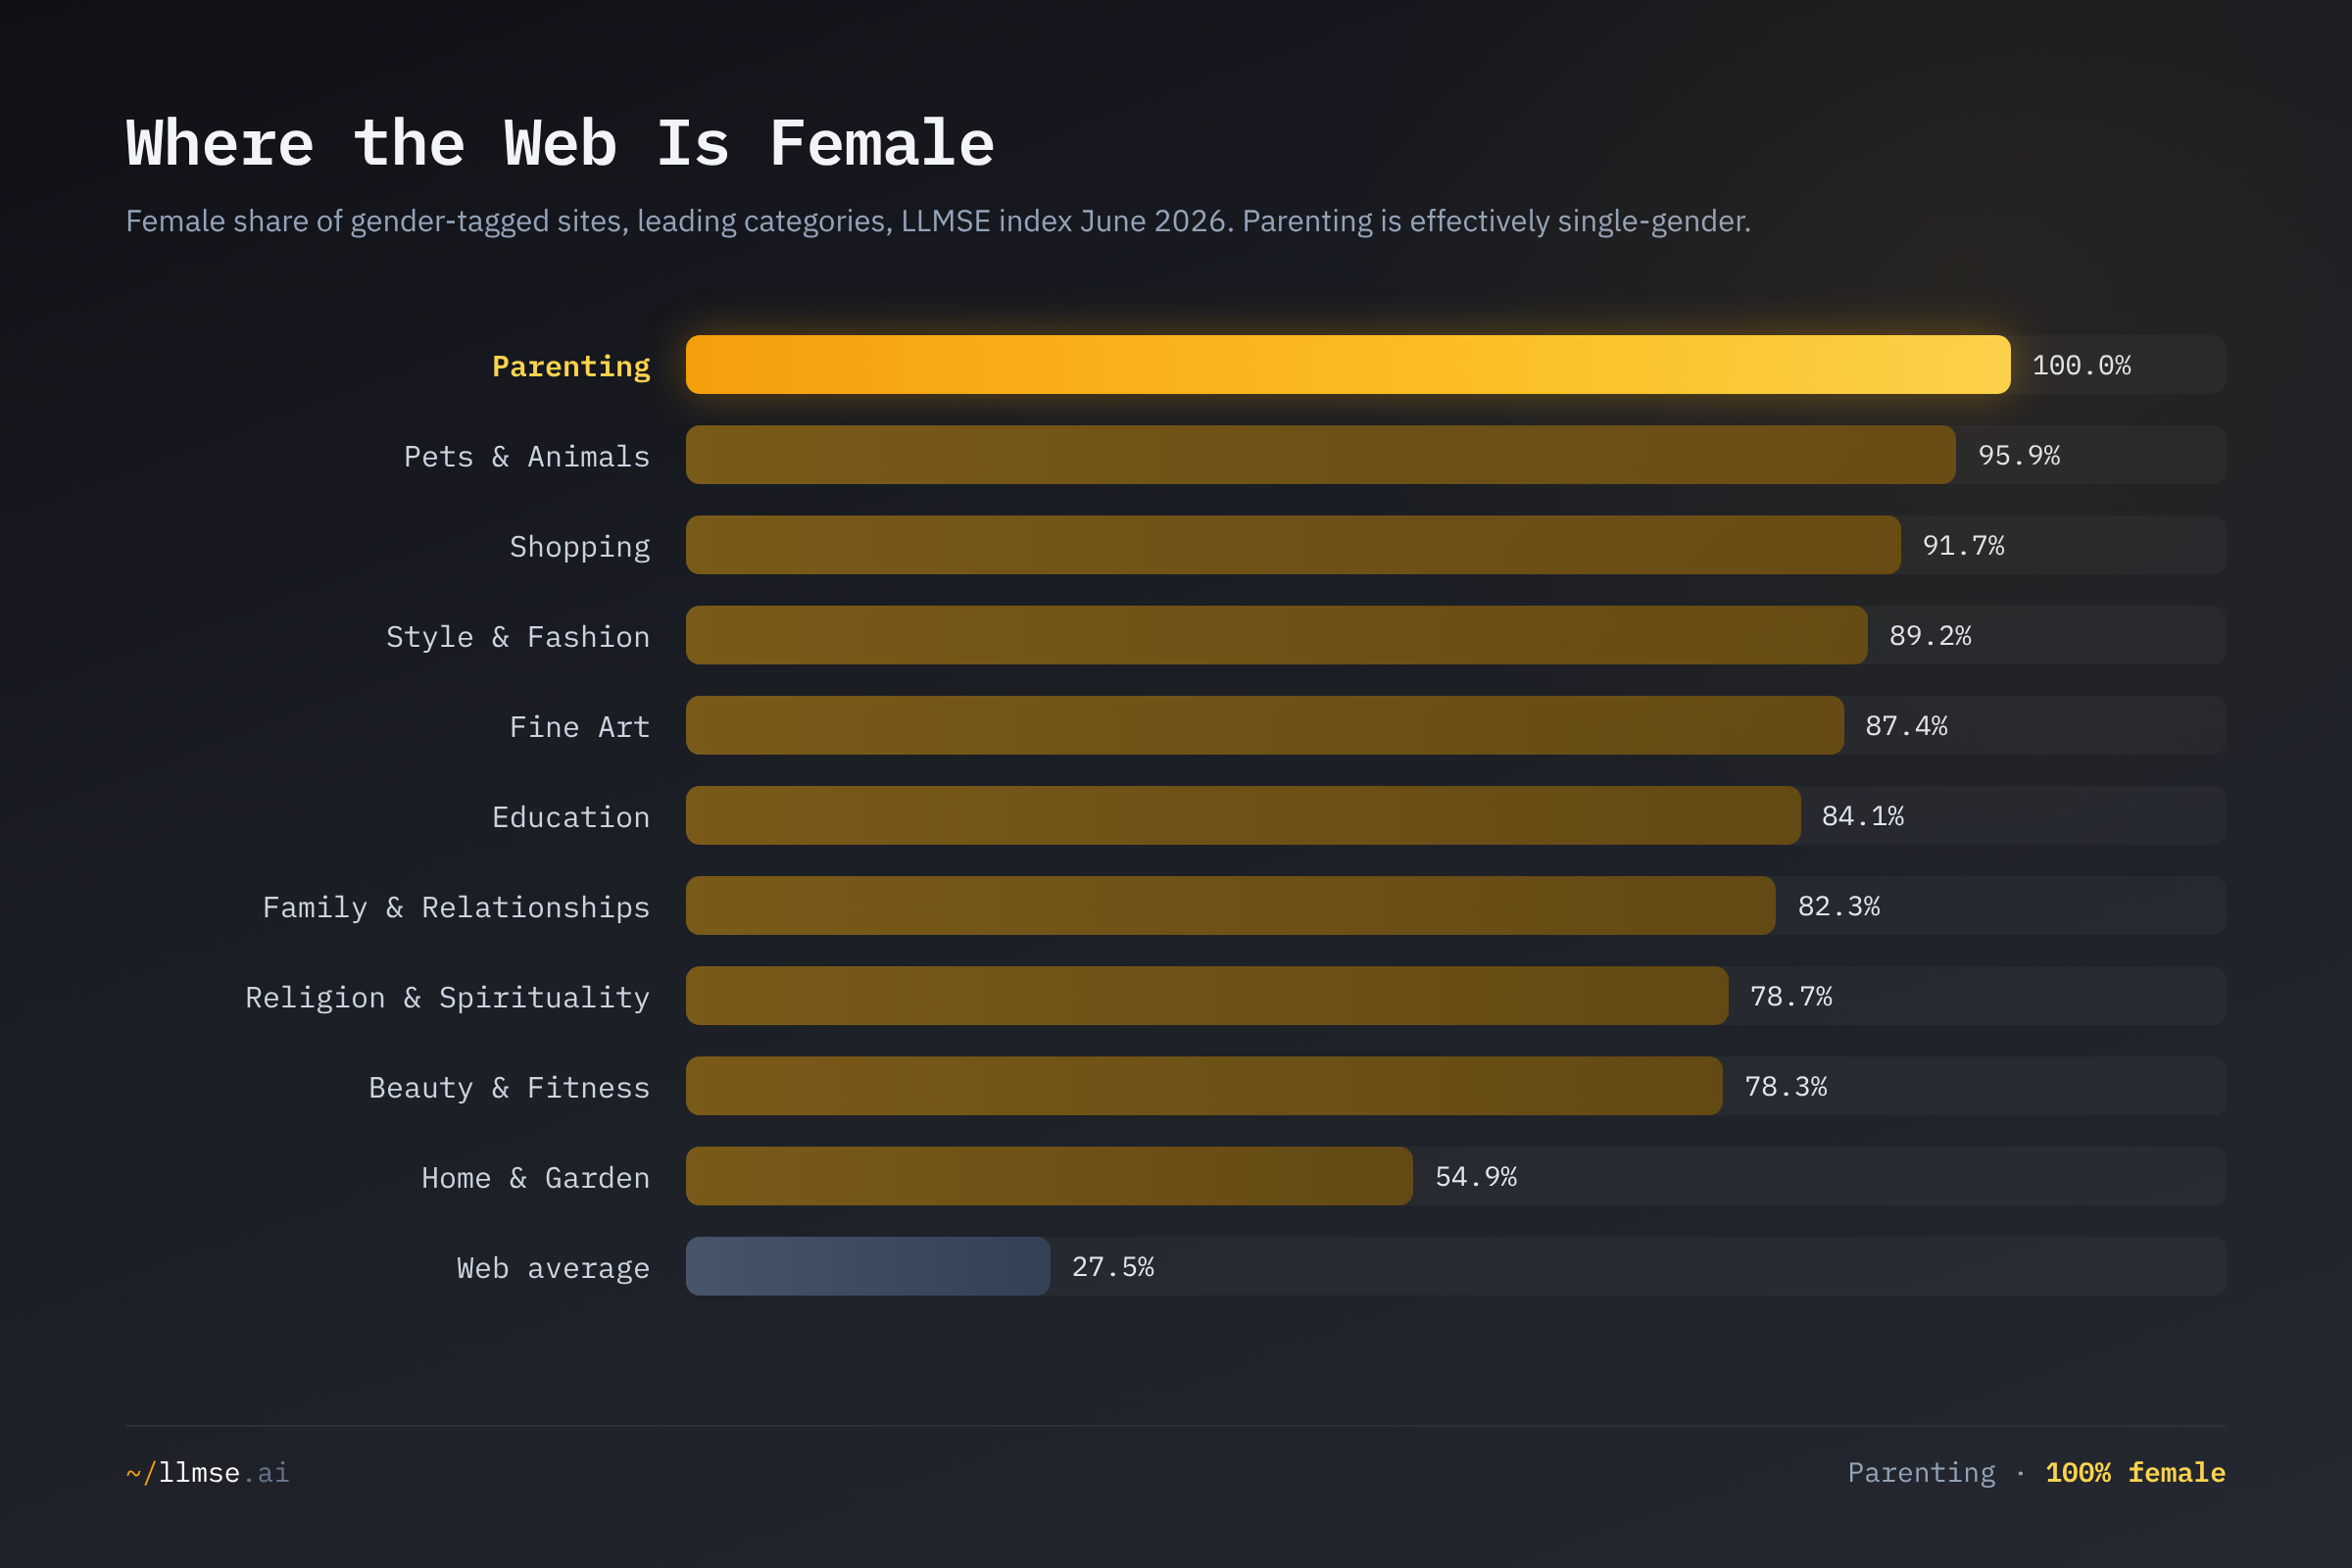
Parenting is effectively single-gender: every one of its 5,702 gender-tagged sites is classified female-targeted. The female concentration then runs through pets, e-commerce, fashion, fine art, and — most consequentially by scale — Education, where 123,000 sites are 84.1% female-targeted and zero are male-targeted. That figure almost certainly reflects the demographics of teaching and educational-content production rather than who learns; it is a statement about who writes the content, not who consumes it.
The mirror image of these two tables is the gender-neutral middle, which the category data shows is where the web is most balanced. Real Estate (87.9% neutral), Weather (82.2%), Reference (59.4%), News & Media (62.1%), and Entertainment (57.4%) lead the neutral column — property listings, forecasts, encyclopedic pages, and journalism written for a general audience. Entertainment, at 228,000 sites, is the largest major category that leans neutral rather than to either gender, which makes its inventory unusually well-suited to gender-balanced reach.
Two Corrections: Accessibility and Sentiment Have Equalized
The original post reported two male advantages outside of discovery. Both were artifacts of small early samples, and both disappear on the current data.
Accessibility now favors gender-neutral content, not male. On 1.9 million more graded sites than the original measured, WCAG pass rates run:
| Target gender | Graded | WCAG pass |
|---|---|---|
| Gender-neutral | 580,558 | 48.1% |
| Male | 1,818,319 | 43.3% |
| Female | 914,839 | 42.4% |
The original's "slight male-targeted advantage at 54.1% versus 51.1%" is gone; the spread is now 5.7 points and led by gender-neutral content (reference, news, infrastructure pages built on clean, semantic templates), with male and female targeting effectively tied at the bottom. Accessibility — measured here against the automated subset of W3C's WCAG 2.1 Level A criteria — turns out to track template and platform choices, not audience gender. (The sector view is in WCAG Compliance by Industry.)
Sentiment is now even across genders. The original claimed male-targeted content had "nearly triple the rate of 'Bad' sentiment." It does not:
| Target gender | Good | Neutral | Bad | % Good | % Bad |
|---|---|---|---|---|---|
| Female | 773,278 | 65,866 | 5,708 | 91.5% | 0.68% |
| Male | 1,554,220 | 162,784 | 12,432 | 89.9% | 0.72% |
| Gender-neutral | 494,772 | 57,555 | 5,242 | 88.7% | 0.94% |
The "Bad"-sentiment rate sits between 0.68% and 0.94% for all three audiences — a spread of a quarter of a percentage point, with gender-neutral content (which includes disasters, crime, and conflict news) actually carrying the most. Female-targeted content remains marginally more positive overall (91.5% Good versus 89.9%), but the threefold gap the original reported was a small-sample artifact, not a structural feature of male content.
Privacy and Brand Safety: The Widest Female Advantage
If trust is the clearest female lead, privacy and brand safety are the widest. Female-targeted content passes privacy at 43.9% against 36.3% for male and just 27.5% for gender-neutral, and it is the most brand-safe audience on the web — 97.2% GARM-safe versus 90.7% for male content.
| Dimension | Male | Female | Neutral | Web average |
|---|---|---|---|---|
| Privacy (A+B+C) | 36.3% | 43.9% | 27.5% | 37.0% |
| GARM brand-safe (A) | 90.7% | 97.2% | 77.8% | 90.2% |
The privacy lead is consistent with the female-targeted category mix: shopping, beauty, parenting, and education are sectors that take payments, run accounts, and operate under consumer-facing data expectations, so consent banners and policies are commonplace — the same data-sensitivity pattern documented in the Privacy Compliance Report. The brand-safety gap is the inverse story on the male side: the 90.7% male figure is dragged down by the adult, gambling, and weapons-adjacent content that concentrates in the male bucket and trips GARM's floor exclusions, where almost none of that content qualifies as fully brand-safe.
Gender-neutral content's low GARM-safe share (77.8%) is a different phenomenon and not a harm signal: it is mostly news and "sensitive topics" content rated B (medium risk) rather than unsafe — 21% of neutral sites are GARM-B and only a fraction of a percent are GARM-F. Hard news about disasters and conflict is brand-adjacent-risky, not brand-unsafe.
What's at Stake
- The access gap closed; the content gap didn't. Women are roughly half of internet users (ITU 2024: 65% of women online versus 70% of men, parity 0.94) but are the intended audience for only 27.5% of gender-tagged content. The web has equalized who can get online faster than it has equalized who it is written for.
- The purchasing-power mismatch is structural. NielsenIQ estimates women control about $31.8 trillion in worldwide spending and influence 70-80% of consumer purchases, yet the web produces roughly twice as much content for men. For advertisers, that is a content-supply imbalance against the demographic with the most spending power.
- Female-targeted inventory is the higher-trust, higher-privacy, more brand-safe option. Content written for women clears EEAT, privacy, and GARM at materially higher rates. As third-party identifiers face mounting privacy constraints and buyers lean harder on contextual signals, content-level audience classification becomes a more durable targeting input — and the female-targeted long tail grades out as safer inventory than its share of the web suggests.
- Discovery quality is near-zero for every audience. SEO and AEO pass rates top out at 2.2% (male). The narrow male edge is a composition effect from tech and gambling, not a property of male content. As AI answer engines replace blue links, content that is trusted but not extractable — much of the female-targeted long tail — risks being trusted and unseen.
- "Quality" depends on which axis you measure. Male content leads discovery, female content leads trust and privacy, neutral content leads accessibility. No audience is uniformly best, so any single-number claim about which content is "better" is a measurement artifact of the dimension chosen.
What Would Help
- Advertisers and media buyers: treat female-targeted inventory as a trust-and-safety advantage, not an afterthought. It under-indexes on supply (27.5% of content) while over-indexing on the spending power that matters (~$31.8T) and on the brand-safety and privacy grades buyers screen for (97.2% GARM-safe, 43.9% privacy pass). Use content-level classification via the REST API to find it.
- Male-targeted publishers — especially technology: add the credibility layer you're missing. The 9-point EEAT deficit in male-targeted content is concentrated in the D band: pages with substance but no visible author, organization, or editorial identity. Author bylines, organizational schema, and about/contact pages are cheap fixes that also lift AI-citation odds. Check your grades at llmse.ai/classify.
- Female-targeted publishers: close the discovery gap, because trust without findability is wasted. Female-targeted content earns the trust signals search rewards but trails on the technical SEO and AEO that surface it. The trust work is largely done; the structured-data and answer-extractability work is not. See The AI Citation Readiness Gap.
- Platform and CMS vendors: ship accessibility by default, since it tracks templates, not audience. Accessibility splits by 5.7 points across genders and the leader is neutral, template-driven content — evidence that WCAG outcomes are set by the platform, not the writer. Semantic defaults, alt-text enforcement, and keyboard-navigable components in the base theme would move the whole web at once.
- Researchers and journalists: use the aggregate, not the anecdote. The original version of this analysis leaned on hand-picked subcategory lists; every figure here is reproducible by intersecting LLMSE's gender and grade indices. Audience-level claims about "what the web is for" should be measured against the full index, where the gender-neutral middle and the within-category mix complicate every tidy binary.
This analysis was conducted using LLMSE, which has classified over 3.4 million websites across SEO, EEAT, AEO, WCAG accessibility, readability, GARM brand safety, and privacy dimensions. Gender figures reflect the 3,362,254 sites carrying a target-audience gender tag in the index as of June 2026; Russian-language sites are excluded from every breakdown. To analyze your own site across every dimension in this post, visit llmse.ai/classify.