The Sentiment Economy: What 3.15 Million URLs Reveal About Positive vs Negative Web Content
Update — 2026-06-29: Refreshed against LLMSE's current index of 3.4 million classified URLs, of which 3.15M now carry a sentiment label (up from ~1.17M at first publication), and re-cut against six quality dimensions plus GARM brand safety. The topline moved: the web is now 90.1% Good and 0.75% Bad (was 83.5% / 0.32%) — a Good:Bad ratio of 121:1, down from 260:1. More positive overall, yet the Bad share has more than doubled. The original's "Shopping is the most positive category" claim no longer holds (Business & Industry at 95.4% and Attractions at 96.5% now lead), and two unreproducible or mis-attributed claims were dropped: the curated per-subcategory "where the Bad URLs hide" table, and the "$26.8B sentiment over-blocking" cost (that figure measures programmatic fraud and ad-tech fees, not tone-based blocking). Every structural finding survives — Adult is still the most negative category, Neutral content is still the most authoritative, negative content is still the least accessible, and sentiment is still not brand safety. Four charts added.
The internet feels negative. Doom-scrolling is a measured phenomenon, not a vibe: a peer-reviewed Nature Human Behaviour study of 105,000 headline variations and 5.7 million clicks found that each additional negative word in a headline raises its click-through rate by 2.3%, while positive words depress it. The algorithm rewards outrage, so the slice of the web we see skews dark. The perception is that the web itself is a hostile place.
The underlying content says otherwise. We classified 3,145,849 URLs by content tone — Good, Neutral, or Bad — as part of LLMSE's multi-dimensional analysis. The result: 90.1% of classified content is Good (positive), 9.2% is Neutral, and 0.75% is Bad (negative). For every URL classified as Bad, there are roughly 121 classified as Good. Negativity is not the texture of the web; it is the exception that the recommendation layer magnifies.
That gap between what circulates and what exists has a price. Advertisers and ad-verification vendors filter inventory to keep brands away from unsafe content, and the crudest filters key on tone and keywords. But tone is a poor proxy for risk: when Integral Ad Science tested Reuters, 54% of brand-suitable pages would have been flagged by a typical keyword blocklist — brand-safe journalism, demonetized for sounding negative. The shared industry standard that once defined "unsafe," the GARM Brand Safety Floor and Suitability Framework, was dissolved in August 2024 after X filed an antitrust suit against its members — leaving no common definition in its place.
This report maps the sentiment landscape: where positivity concentrates, where the 0.75% hides, how tone correlates with quality and brand safety, and why conflating negative sentiment with brand risk over-blocks the majority of negative content — because 72.1% of Bad-sentiment URLs are still brand-safe.
The Data
We analyzed every URL carrying a sentiment classification in LLMSE's index — 3,145,849 of them — as of the current crawl. Sentiment is one label in a larger automated pipeline that also grades category, language, demographics, SEO, EEAT, accessibility, readability, privacy, and GARM brand safety.
| Sentiment | URLs | Share |
|---|---|---|
| Good (positive) | 2,833,596 | 90.1% |
| Neutral | 288,758 | 9.2% |
| Bad (negative) | 23,495 | 0.75% |
| Total graded | 3,145,849 | 100% |
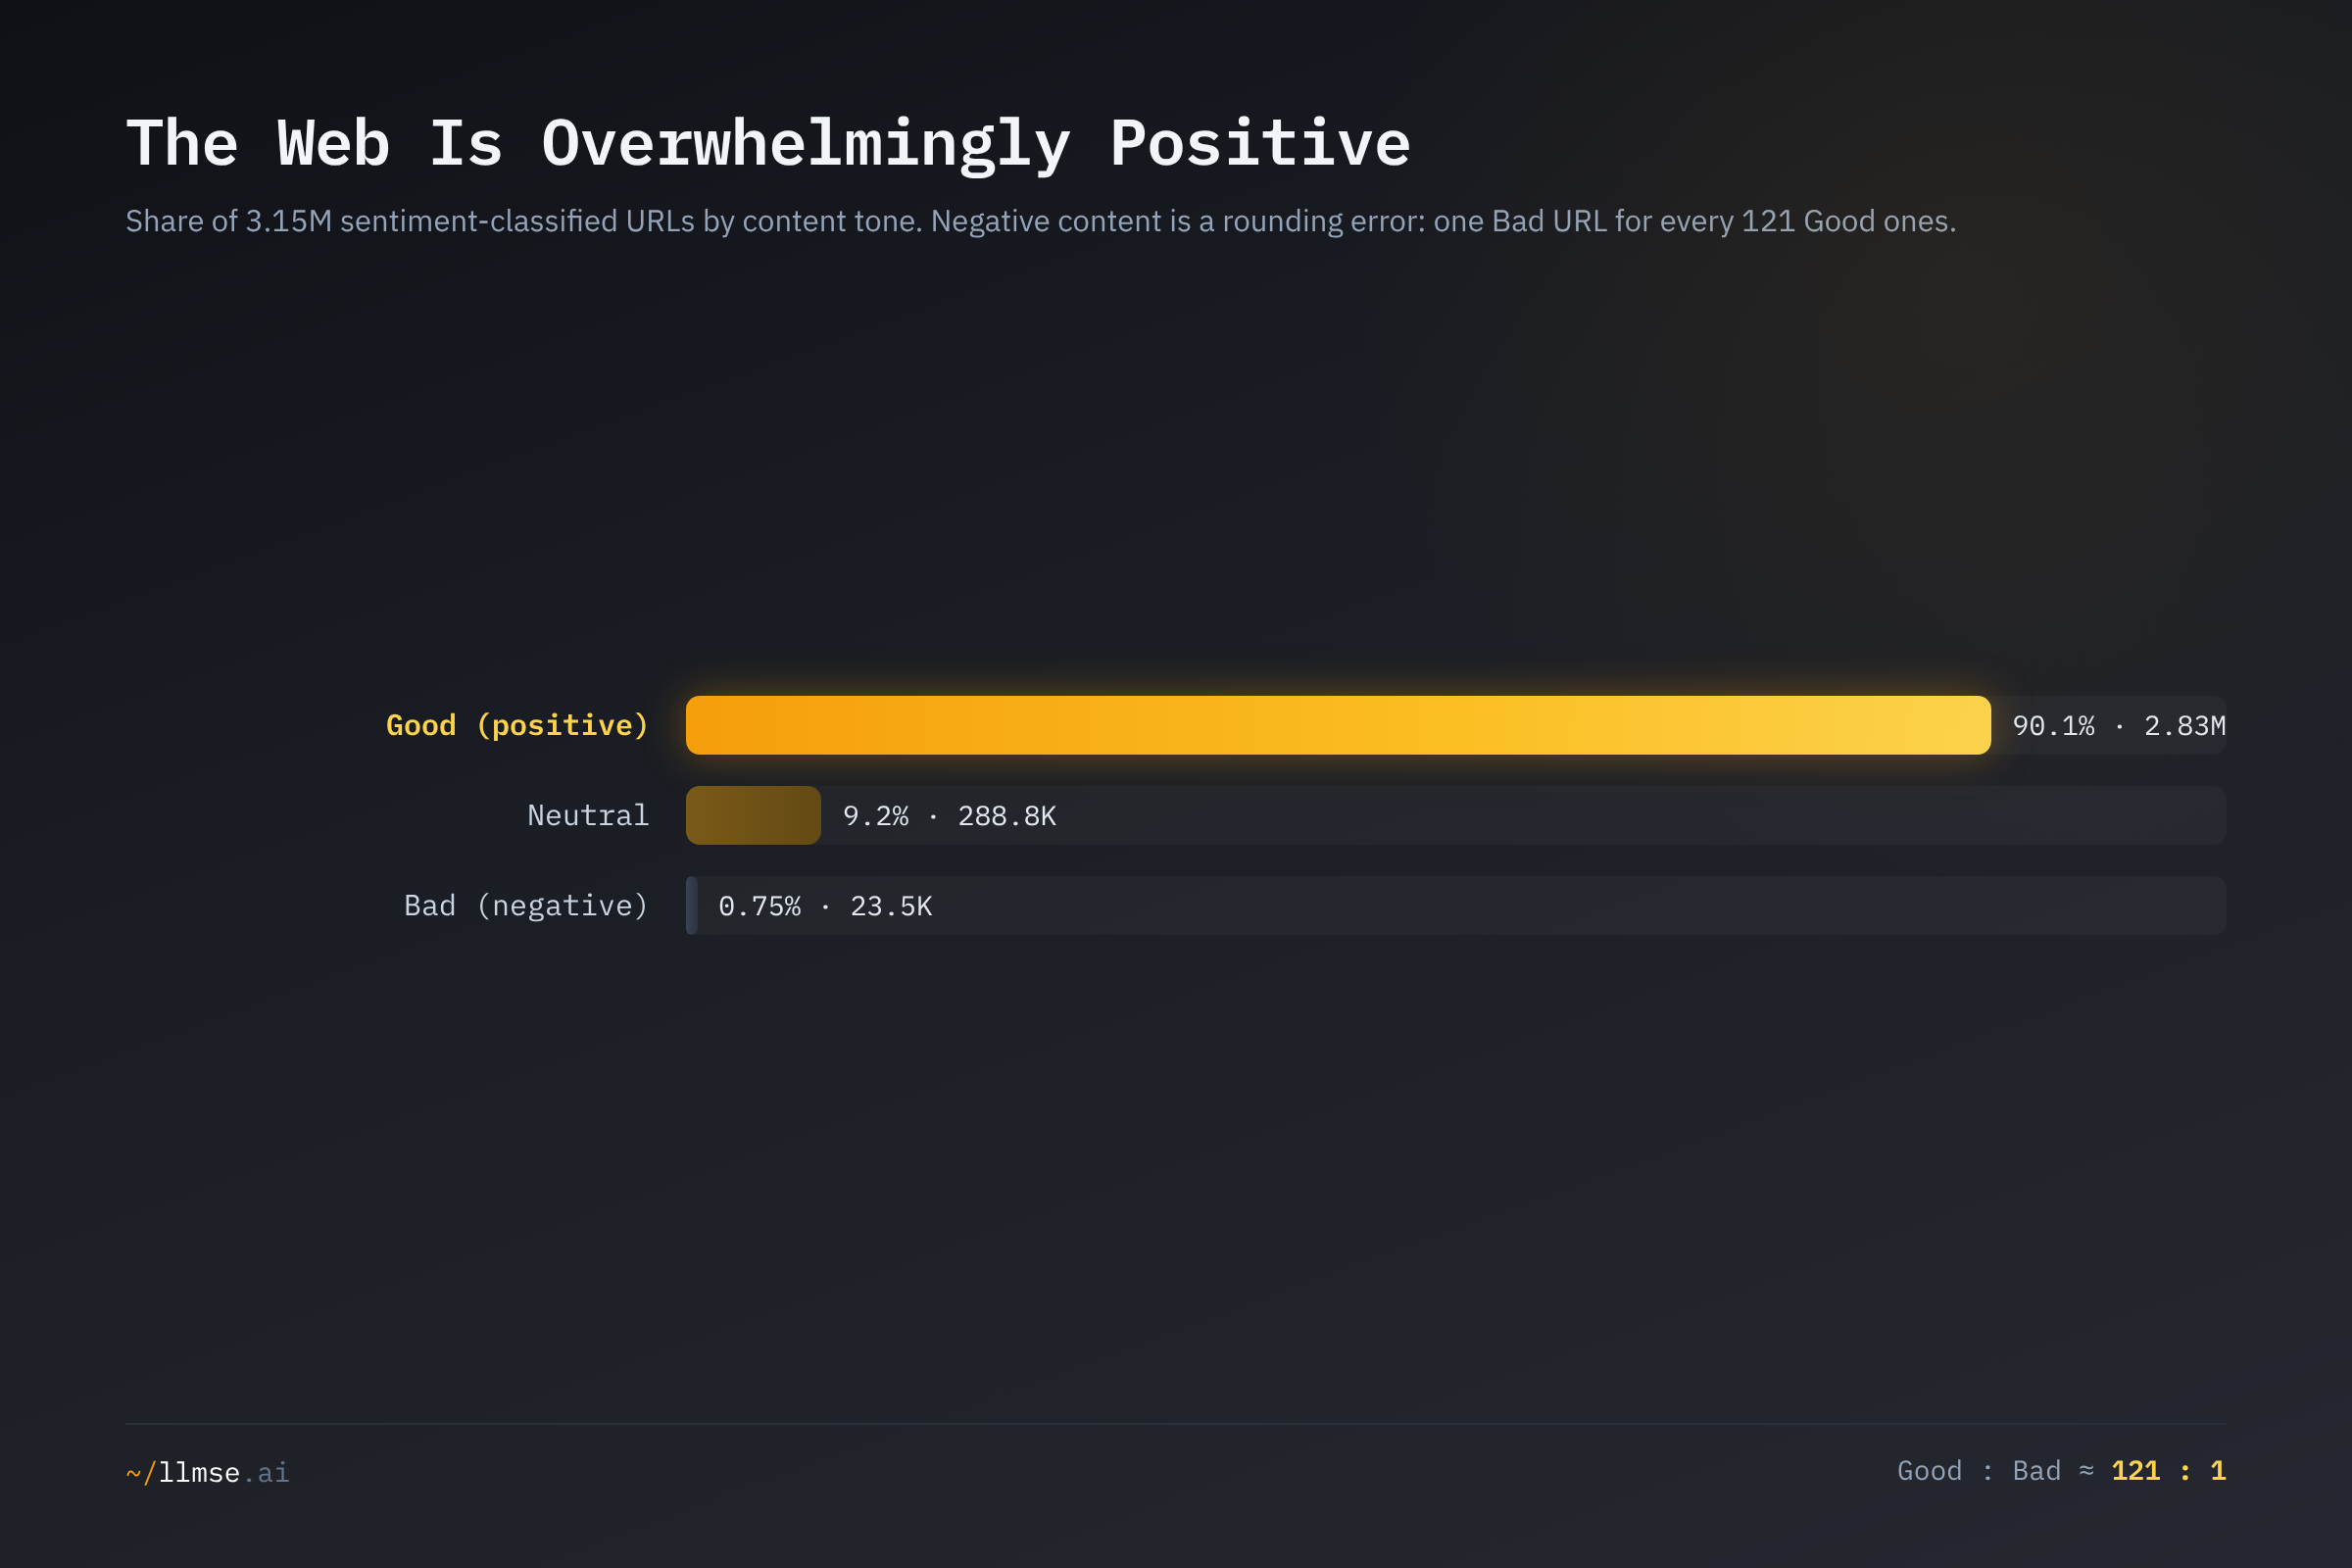
Three observations stand out:
- The web is overwhelmingly positive. 90.1% of classified content is upbeat, constructive, or affirmatively toned — product pages, guides, listings, portfolios, and the vast commercial middle of the web. This is consistent with the GARM brand-safety analysis, which finds 90.2% of the web is brand-safe at the A grade.
- Neutral is the real second tier, and it shrank. 9.2% of URLs are neutral — reference material, documentation, and straight reporting. At first publication Neutral was 16.2%; as the graded population nearly tripled, much of the newly-classified commercial web landed in Good rather than Neutral.
- Negative content is vanishingly rare — but rising. At 0.75%, Bad sentiment is still a rounding error against Good. Yet its share has more than doubled from the original 0.32%, and in absolute terms there are now 23,495 negative URLs where the first cut found 3,762. The web tilted more positive and surfaced more negativity at the same time, because a broader, less-curated crawl reaches further into both tails.
Methodology
This post makes quantitative claims, so the definitions and limits matter.
- Sentiment labels. Each URL is assigned Good, Neutral, or Bad by the LLM during classification, reflecting the model's read of overall content tone — affirmative/constructive (Good), informational/unmarked (Neutral), or negative/critical/distressing (Bad). This is a three-class polarity judgment, not a human-annotated gold standard. As the peer-reviewed survey literature on sentiment analysis stresses, polarity classification is subjective and context-dependent, and a coarse three-class label does not distinguish the type of negativity — a critical product review, a disaster bulletin, and genuinely harmful content can all read as "Bad."
- Quality grades and "pass." Every other dimension is graded A–F by a dedicated automated analyzer (there is no E grade). "Pass" means A+B+C for SEO, AEO, EEAT, WCAG, and Privacy; A+B for Readability (Flesch Reading Ease ~50+, ≈ 8th-grade level or below); and for GARM, "safe" = A only (brand-suitable, outside all floor categories). The GARM floor (grade F) maps to the framework's universally-unsuitable categories — adult/explicit content, illegal drugs, crime, hate speech, terrorism, and the like.
- Cross-references are computed as set intersections (Redis
ZINTERCARD) between thesentiment-{Good|Neutral|Bad}indices and the category, grade (eeat-A,wcag-F,garm-A…), language, and demographic indices. All of these are URL-keyed, so the intersections are reproducible; all counts are aggregate and no individual site is identified. Pass rates are computed over the population actually graded on each dimension, so denominators differ across SEO/AEO/EEAT/WCAG/Readability/Privacy/GARM. - Known limits. The graded set is biased toward the commercial, crawlable web — it is not a random sample of all internet content. Sentiment reflects model judgment and inherits its errors. The Readability grade uses Flesch scoring, which is calibrated for English, so cross-language readability is unreliable and we avoid it. Counts are a live snapshot and drift as classification continues. Segments below ~10,000 graded URLs are flagged or excluded. Russian-language content is excluded from every aggregate.
- Why these numbers differ from the original. The sentiment-graded population grew from ~1.17M to 3.15M URLs. The distribution shifted (Good 83.5%→90.1%, Neutral 16.2%→9.2%, Bad 0.32%→0.75%) as the broader crawl reached deeper into the commercial web and into both tails. Independently, web-wide quality pass rates fell a few points as early, quality-skewed coverage broadened (web EEAT 48%→45.4%, WCAG 53%→43.8%), so the absolute pass figures below are lower than the first cut even where the ranking by sentiment is unchanged.
The Scorecard
Cross-referencing each sentiment band against all seven graded dimensions produces a table where the standout in each column rarely belongs to the positive majority.
| Sentiment | SEO | AEO | EEAT | WCAG | Readability | Privacy | GARM-safe |
|---|---|---|---|---|---|---|---|
| Good | 1.7% | 1.0% | 42.3% | 44.6% | 33.1% | 36.1% | 90.8% |
| Neutral | 2.7% | 3.8% | 55.3% | 41.6% | 33.6% | 31.8% | 85.9% |
| Bad | 2.3% | 0.7% | 52.6% | 31.5% | 40.1% | 31.0% | 72.1% |
| Web average | 1.9% | 1.5% | 45.4% | 43.8% | 32.8% | 37.0% | 90.2% |
Sentiment predicts quality, but not in the direction intuition expects. Positive content — the 90% majority — leads on only two dimensions (accessibility and privacy), and trails the web average on the trust dimension (EEAT). The standouts cluster in the minorities: Neutral content tops trust, AI-answer readiness, and SEO; Bad content tops readability and bottoms out on accessibility and brand safety. Two patterns govern the rest of this report: tone is decoupled from search and brand risk, and the kind of negativity matters more than its presence. SEO is the clearest case of decoupling — all three bands sit within a point of the 1.9% web average, confirming the State of Website SEO finding that almost everything fails SEO regardless of what it says.
Tone Is Not Brand Safety: The Over-Blocking Trap
The central economic finding is that negative sentiment and brand risk are correlated but not equivalent. Map sentiment against GARM, the advertising industry's content-suitability scale:
| Sentiment | GARM-safe (A) | GARM floor (F) |
|---|---|---|
| Good | 90.8% | 0.84% |
| Neutral | 85.9% | 3.05% |
| Bad | 72.1% | 7.20% |
| Web average | 90.2% | 1.09% |
72.1% of Bad-sentiment URLs are still brand-safe. A negative product review, a critical investigation, a storm warning, or a complaint about a telecom provider all read as negative tone while sitting comfortably outside every GARM floor category. At the same time, the correlation is real at the extreme: negative content hits the GARM floor at 7.2%, against 0.84% for positive — 8.6 times more likely. Tone is a directional signal for unsafe content, but a blunt one: it flags the right tail while sweeping in three-quarters of negative content that carries no risk at all.
That is exactly the failure mode that over-blocking research documents. Keyword and tone filters, applied to protect inventory, demonetized 54% of brand-suitable Reuters pages in IAS's test — and the same dynamic systematically defunds crisis journalism, where the news is negative but the content is brand-safe. The tooling gap widened in 2024: the GARM framework that provided the shared definition of "floor" was dissolved after X's antitrust suit, and no replacement standard has taken its place. In the vacuum, tone-based proxies do more of the filtering — over-blocking the brand-safe 72%. The data here argues for the opposite design: a filter that distinguishes a negative-but-safe restaurant review from genuine floor content, rather than treating all negativity as risk.
Trust and Access: Neutral Earns Authority, Negative Loses the Reader
Sentiment's relationship to content quality splits along a clean line. On the signals that reward dispassionate substance, neutral content wins; on the signal that rewards investment in infrastructure, negative content loses.
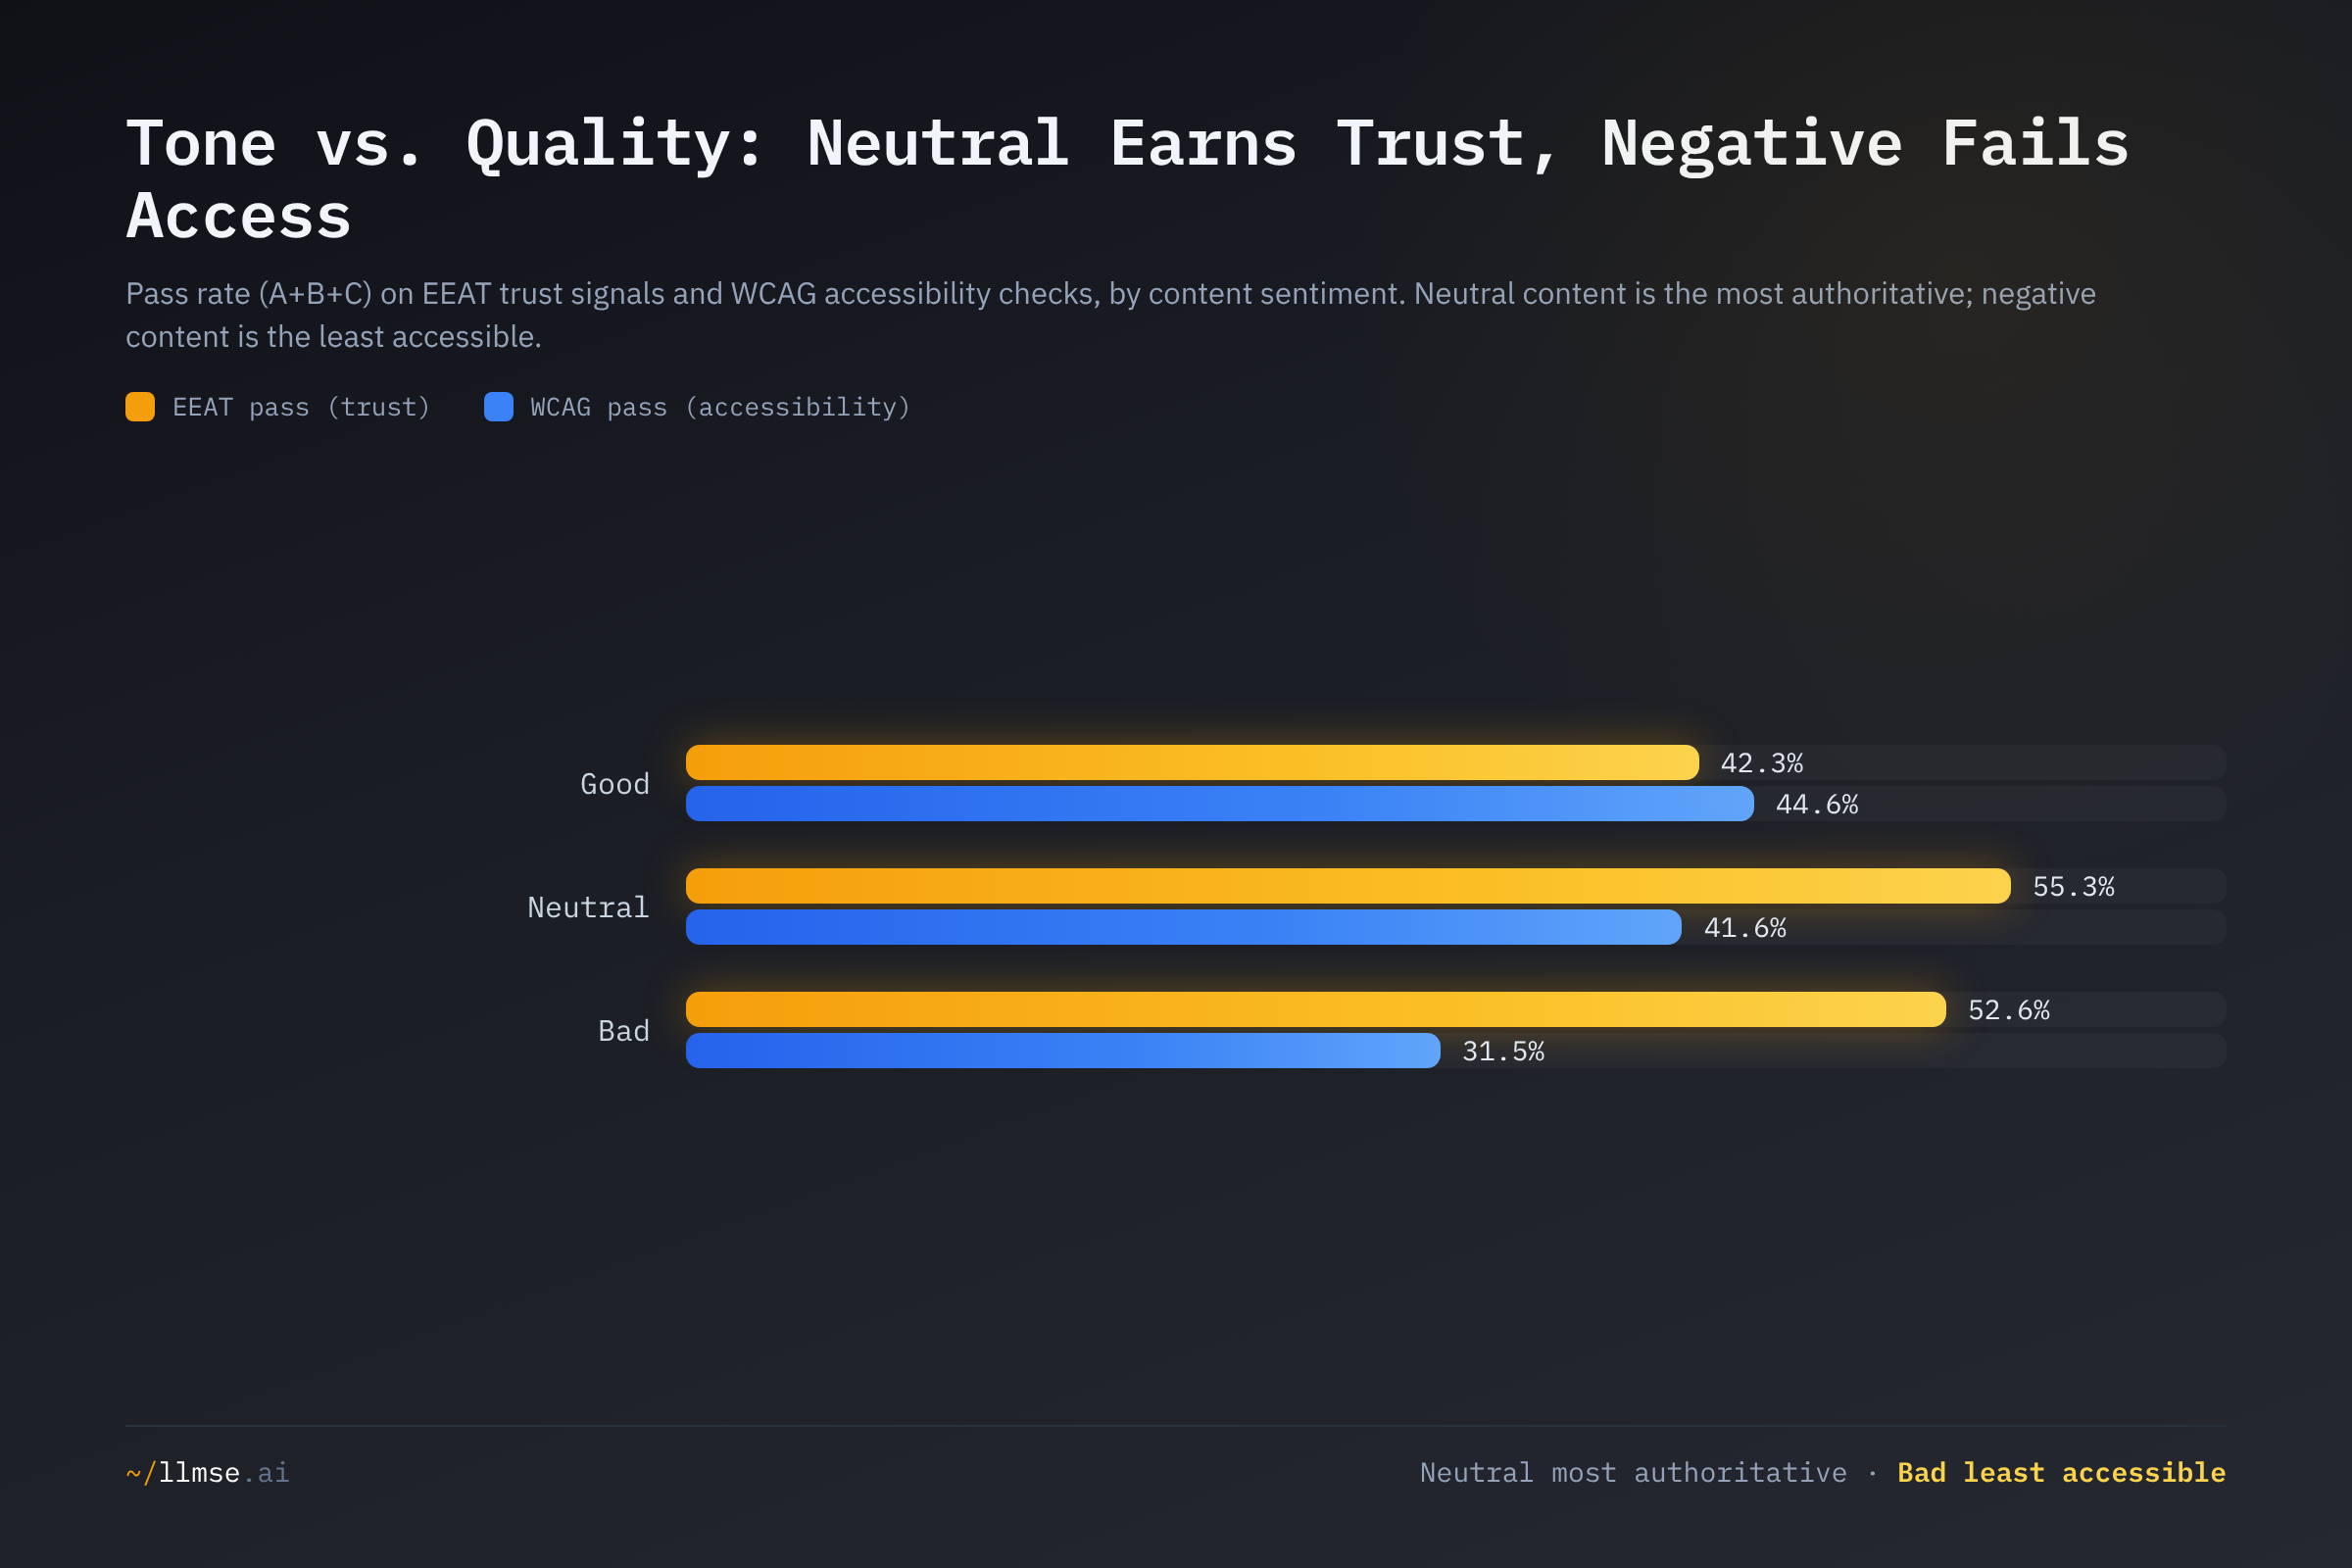
Neutral content is the most authoritative on the web. It passes EEAT at 55.3% — ahead of Bad (52.6%) and well ahead of Good (42.3%) — and earns the top A grade at 8.2%, nearly double Good's 4.5% and almost four times Bad's 2.1%. This is the durable "authority" finding, and it makes structural sense: the most credentialed sources — universities, government agencies, standards bodies, reference databases — present information without positive or negative framing, and Google's Quality Rater guidance rewards exactly that dispassionate, well-sourced register. The same logic shows up in AEO, where Neutral's 3.8% answer-extractability rate leads the field (Good 1.0%, Bad 0.7%) — informational content is what answer engines lift, a pattern explored in the AI Citation Readiness Gap. Positive content's lower trust score is a composition effect: the 90% Good majority is dominated by thin, promotional commercial pages that score well below institutional sources on EEAT.
Negative content is the least accessible on the web. Bad-sentiment URLs pass WCAG accessibility checks at just 31.5%, versus 44.6% for Good and 41.6% for Neutral, and fully 49.6% score F (vs 36.9% of Good). The pattern is consistent with negative content originating disproportionately from sites that invest least in front-end infrastructure — and it compounds an equity problem, because assistive-technology users are then most excluded from precisely the content (breaking news, complaints, crisis information) where access matters most. One countervailing curiosity: Bad content leads readability at 40.1%, plausibly because negative prose — alarms, complaints, short critical posts — tends to be simple and emotional, which Flesch scores as "easier." We flag this as indicative only; the Readability grade is English-calibrated and we do not lean on it.
The Category Map: Where Negativity Lives — and Where It Doesn't
The 0.75% average masks an order-of-magnitude spread across categories. The negative tail is concentrated and largely predictable.
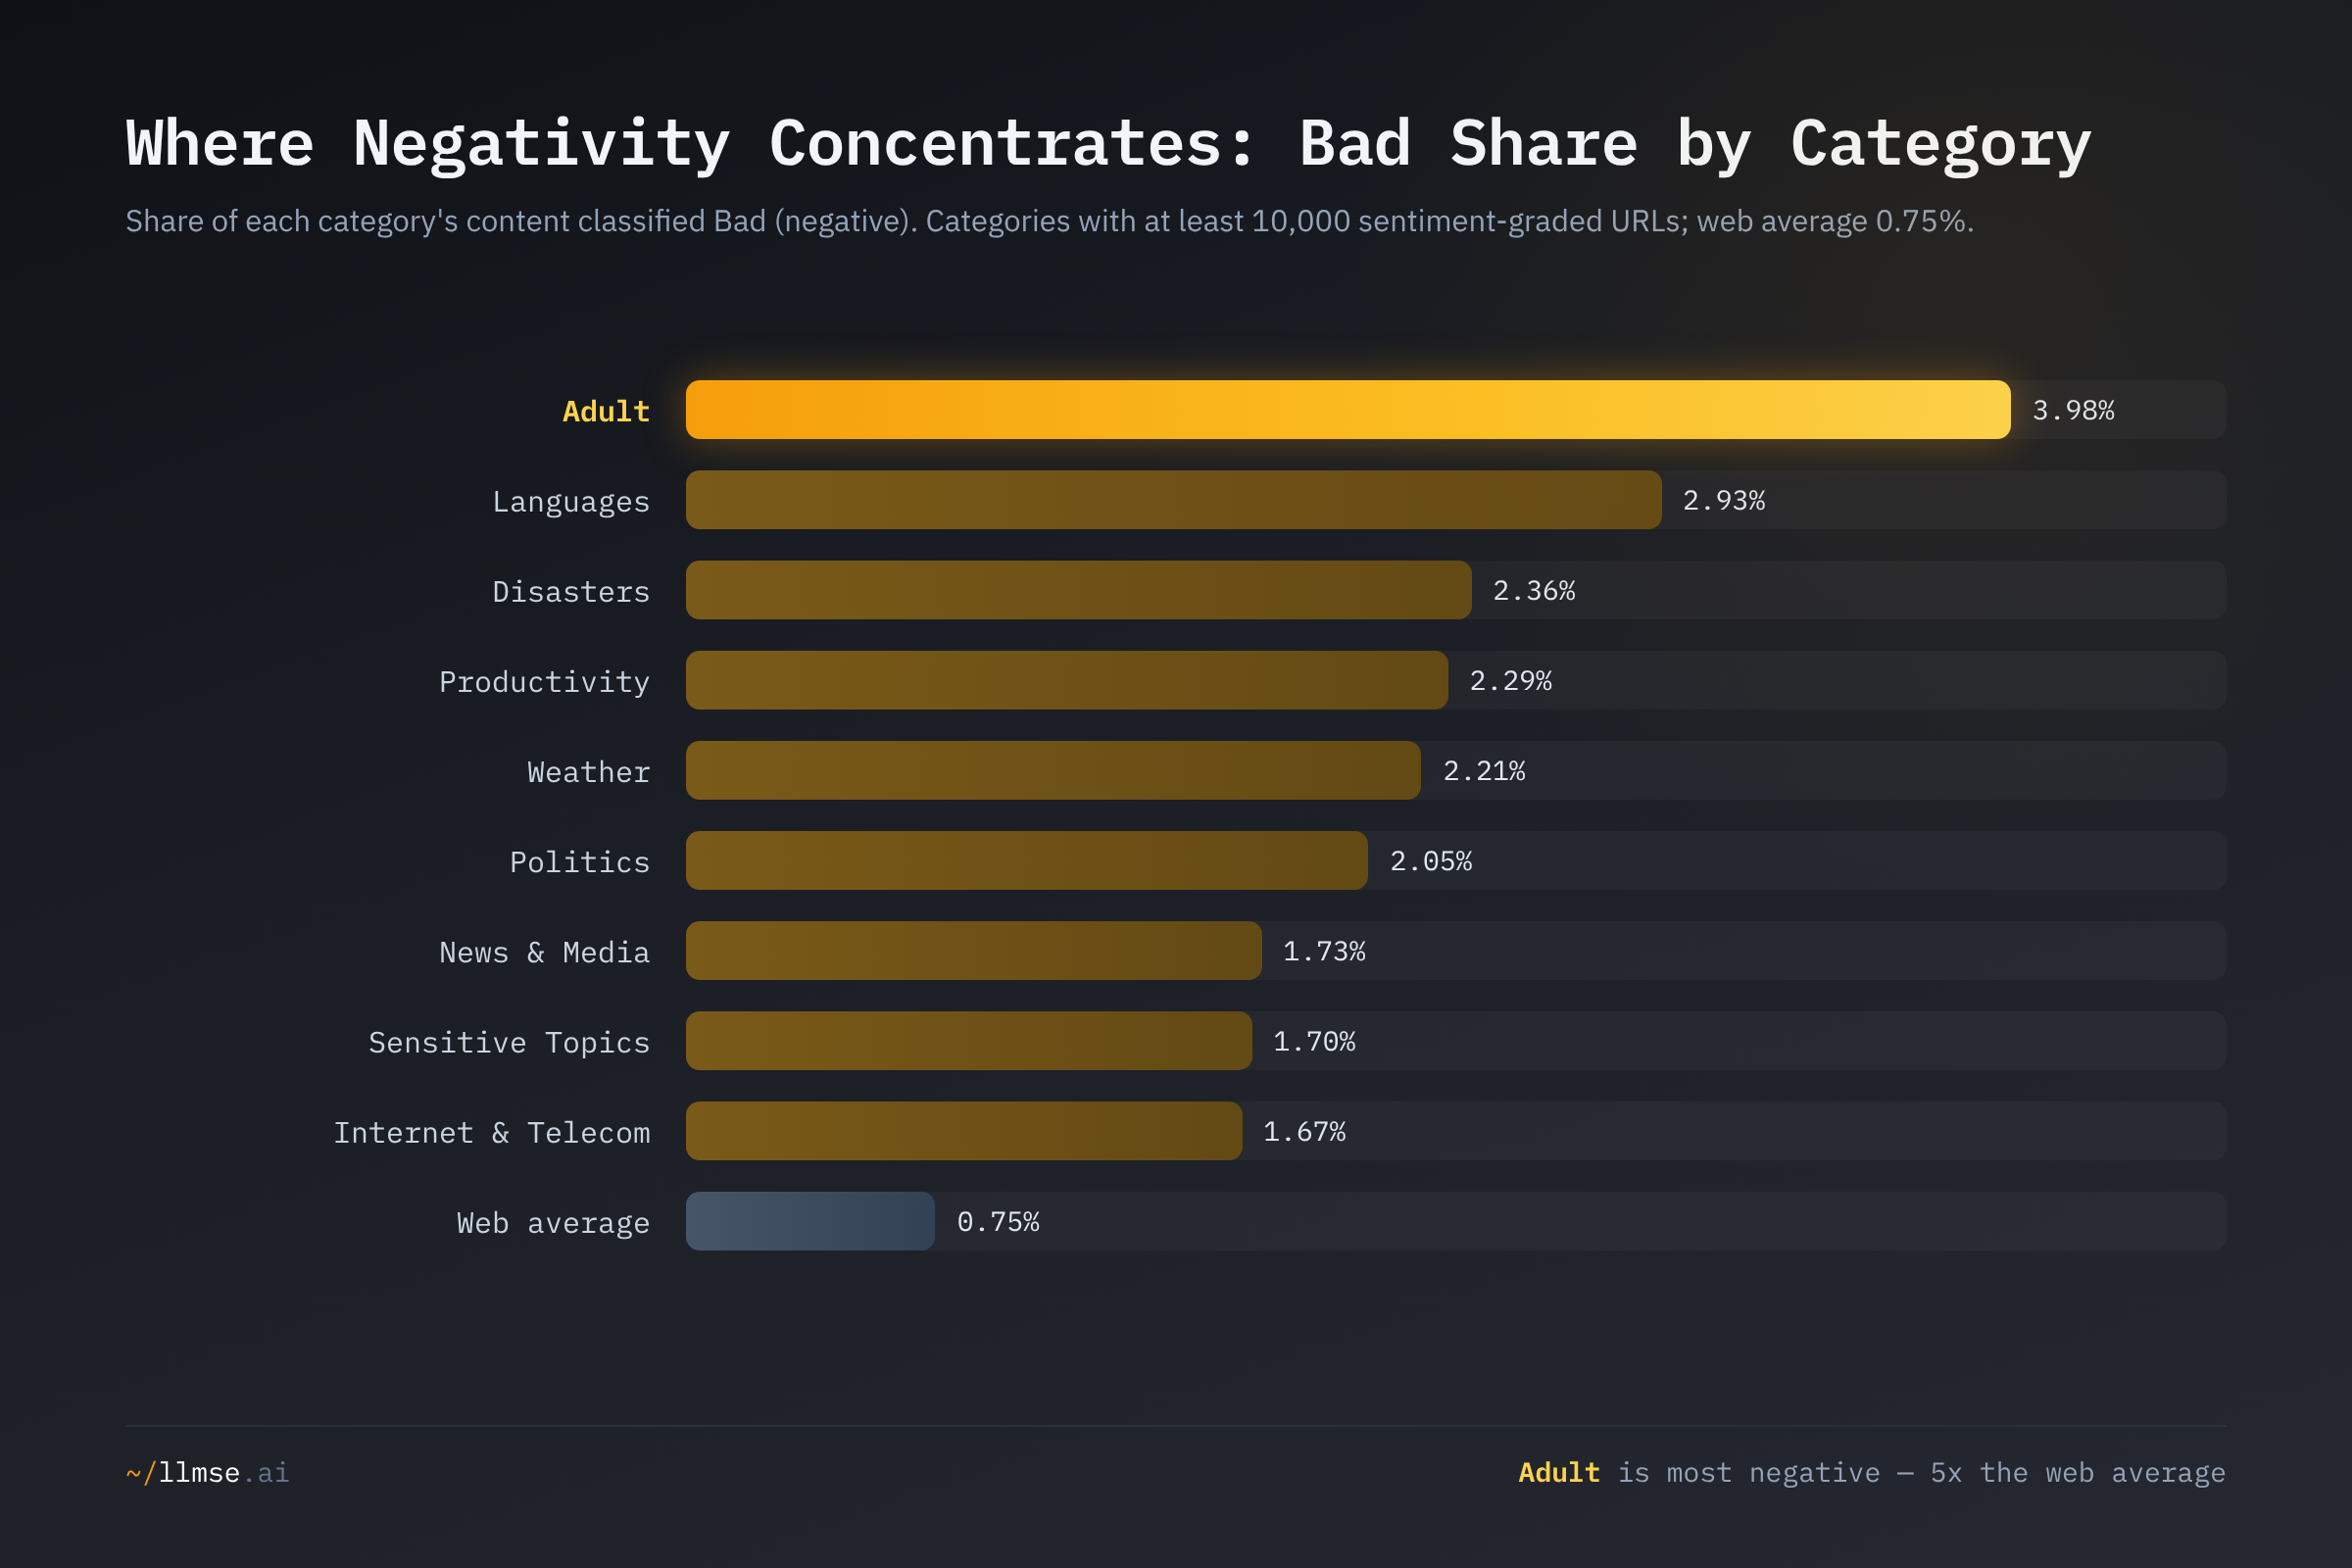
Adult is the most negative category at 3.98% Bad — more than five times the web average — and it remains the single largest contributor of Bad URLs (1,348). Yet even Adult is 70.0% Good: the category is negative relative to the web, not in absolute terms. Below it sit the categories whose subject matter is inherently fraught — Disasters (2.36%), Weather (2.21%, severe-weather and storm coverage), Politics (2.05%), and News & Media (1.73%) — and two less obvious entries. Languages (2.93%) and Productivity (2.29%) rank high on negativity; manual spot-checking suggests these capture critical, frustration-toned content (language-exchange disputes, software complaints) rather than the inherently grim topics above. Crime is even more negative at 3.51% Bad but sits just under the 10,000-URL reporting threshold (8,488 graded), so we exclude it from the chart while noting it.
The positive end is where the original report needs correcting. It named Shopping the most positive category; that no longer holds.
| Category | Sentiment-graded | Good% | Bad% |
|---|---|---|---|
| Attractions | 75,066 | 96.5% | 0.78% |
| Business & Industry | 978,458 | 95.4% | 0.51% |
| Sensitive Topics | 145,711 | 94.7% | 1.70% |
| Home & Garden | 39,757 | 94.1% | 0.40% |
| Reference | 44,432 | 93.8% | 0.92% |
| Food & Drink | 37,560 | 91.6% | 0.29% |
| Shopping | 33,588 | 91.5% | 0.48% |
Business & Industry — the web's largest category at roughly a million graded URLs — is 95.4% positive, and Attractions tops the rate at 96.5%. Shopping, the original's champion, has slipped to mid-pack among positive categories at 91.5%. Two nuances reward attention. Food & Drink has the lowest Bad share of any large category (0.29%) — recipes and restaurant content are almost uniformly upbeat. And Sensitive Topics is the paradox of the table: 94.7% Good and an elevated 1.70% Bad, the highest of any top-positive category — a polarized bucket with little neutral middle, where content is either affirmative or sharply negative. This is the clearest illustration of why a single sentiment label is a weak safety signal: a category can be both highly positive and disproportionately negative at once.
The Czech Anomaly: Negativity by Language
Sentiment varies far more by language than by category, and the spread is dominated by a single outlier.
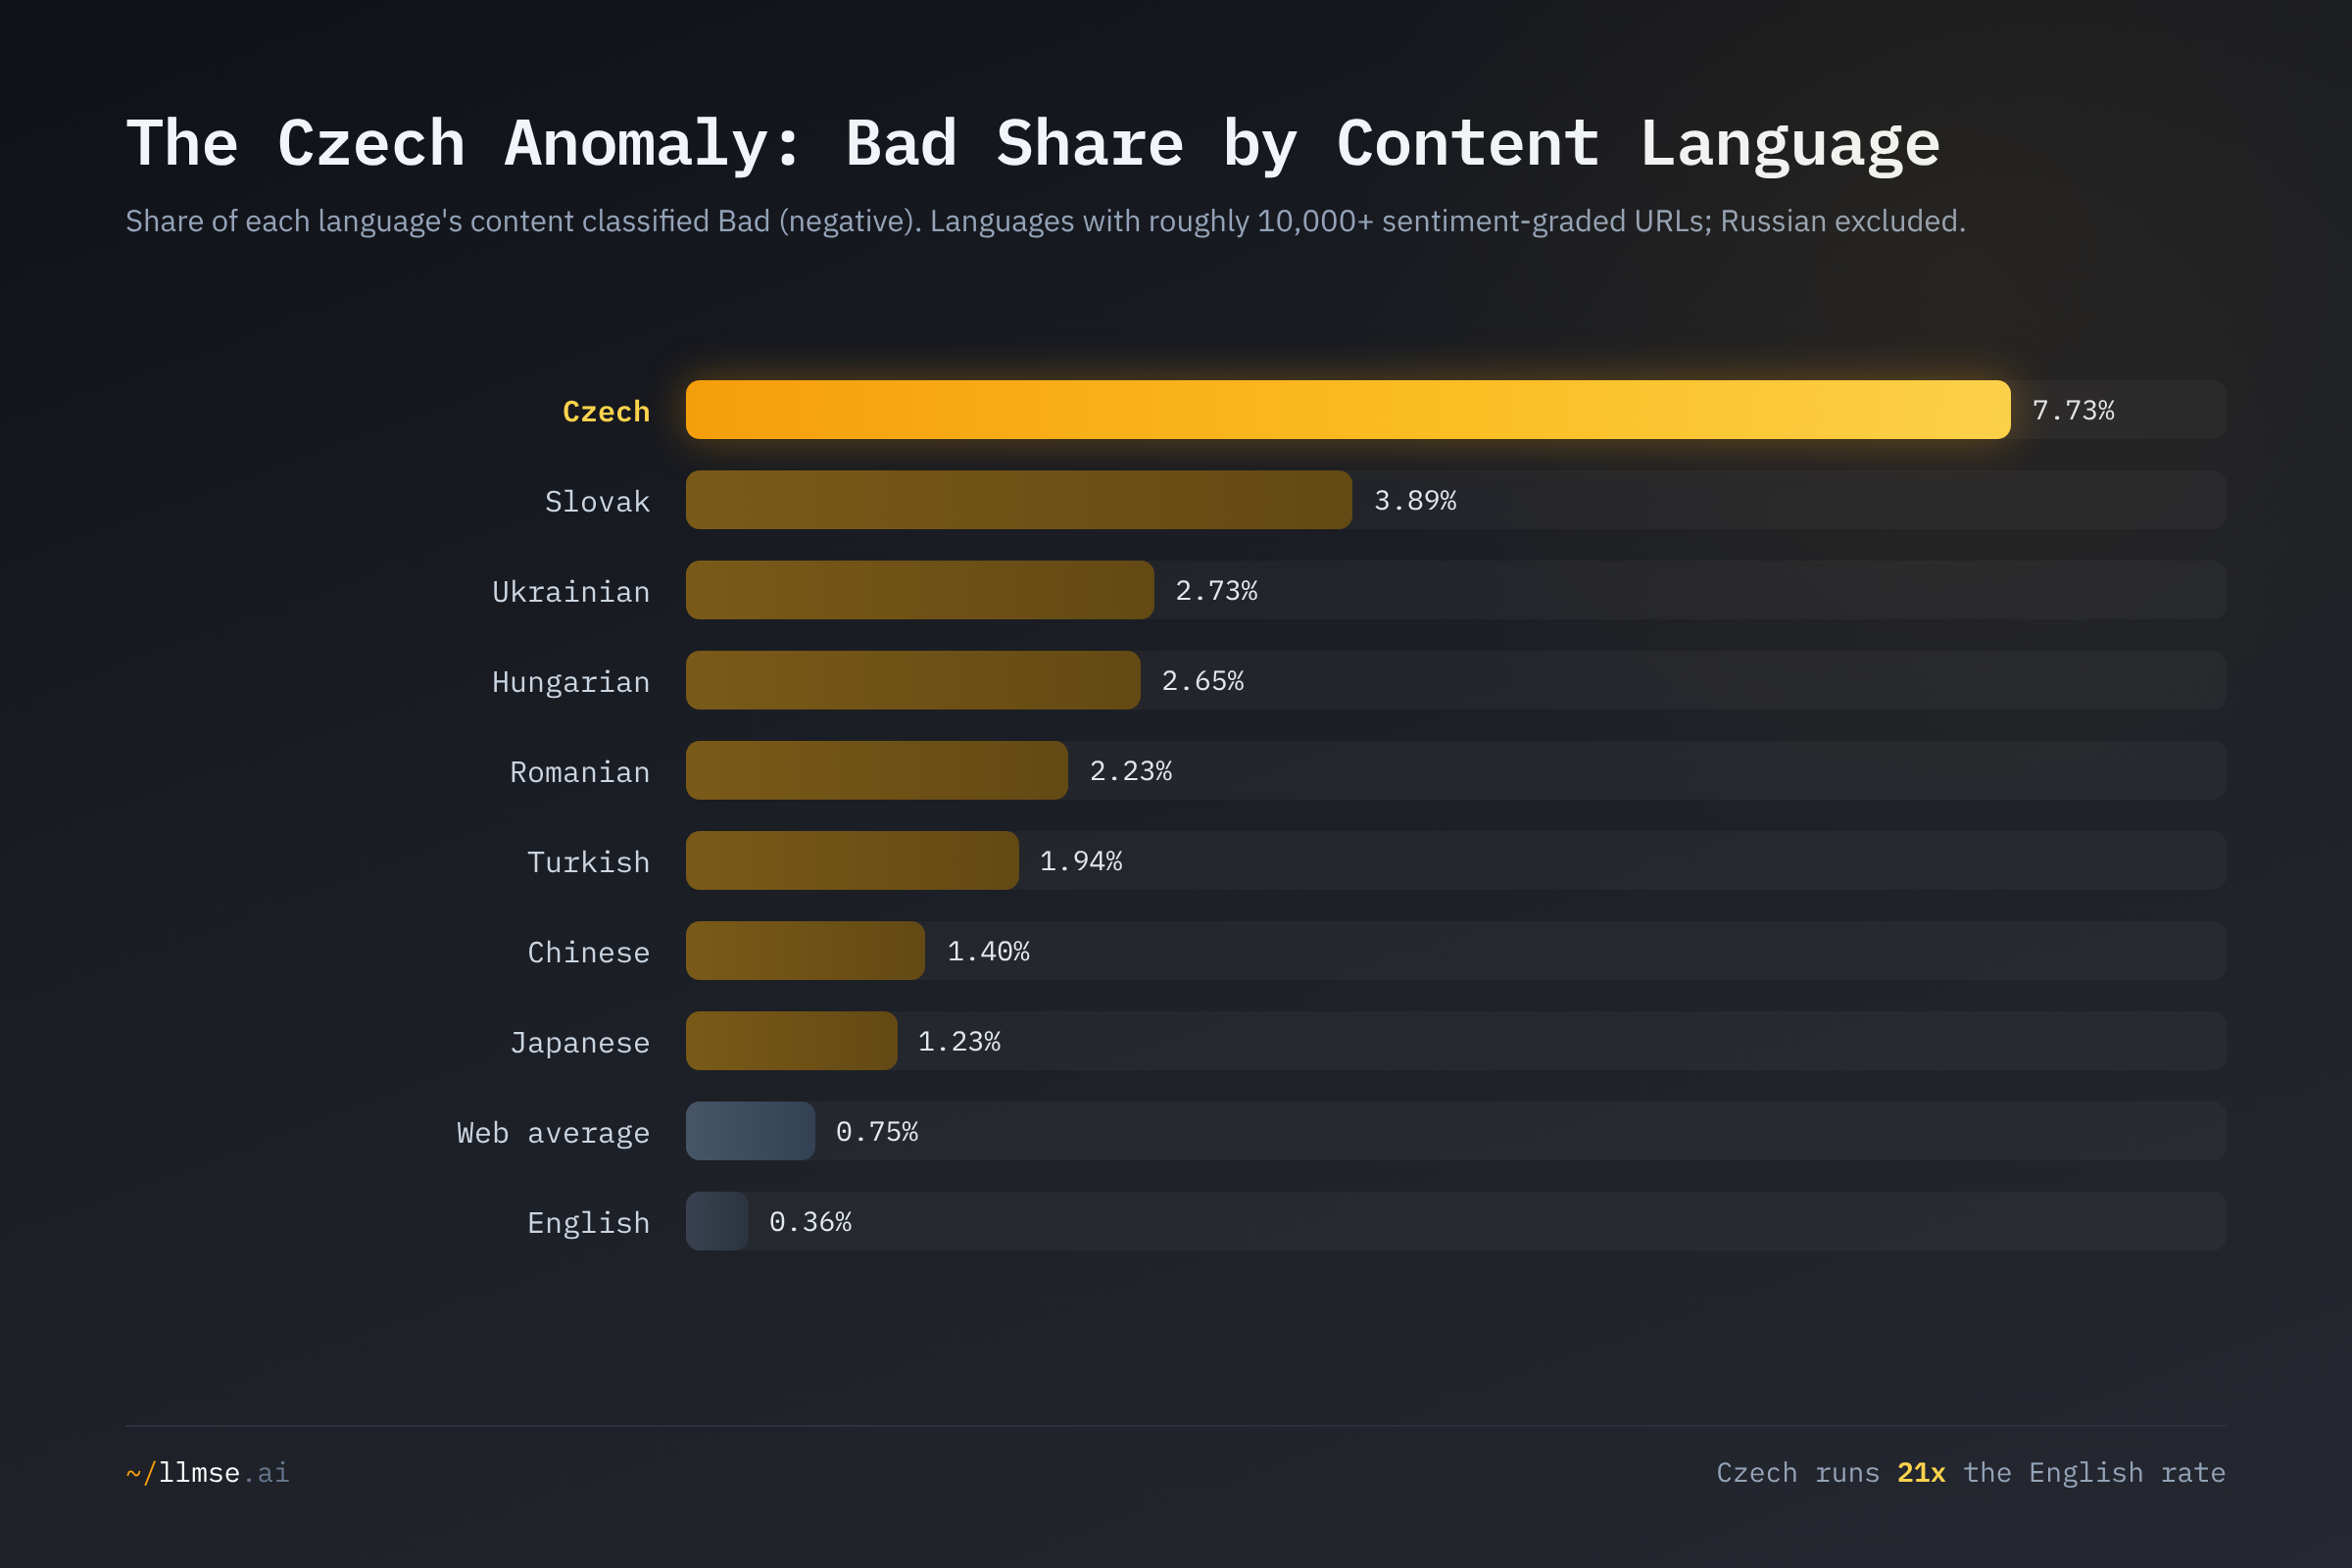
Czech content is classified Bad at 7.73% — roughly 21 times the English rate of 0.36%, and double the next language (Slovak, 3.89%). Czech is a genuine statistical anomaly, not a small-sample artifact: it rests on 33,527 sentiment-graded URLs. Its neighbors in Central and Eastern Europe — Slovak (3.89%), Ukrainian (2.73%), Hungarian (2.65%), Romanian (2.23%) — cluster well above the web average, suggesting a regional pattern in the kind of content indexed (or in how the classifier reads those languages' register) rather than anything intrinsic to one country. English, the largest market at 1.89M URLs, anchors the floor at 0.36% — its sheer volume of commercial, corporate, and institutional content dilutes any negative signal. We state these as correlations: a page's language is a coarse proxy for its market, and the multilingual quality divide shows non-English webs differ structurally in ways that confound naive comparison.
For comparison, the demographic dimension barely moves: male-targeted content runs 0.72% Bad, female-targeted 0.68%, all-audience 0.94% — a non-effect beside the 21-fold language spread. Audience gender does not predict sentiment; content language does.
What's at Stake
- The web tilted more positive while surfacing more negativity — Good rose to 90.1% but the Bad share more than doubled to 0.75%, so safety models calibrated to the old 0.32% baseline are now tuned to the wrong floor and will mis-rate a negative tail that is twice as large in share and six times as large in absolute count.
- Filtering ad inventory on tone over-blocks the brand-safe majority — 72.1% of Bad-sentiment URLs carry no GARM risk, and crude keyword/tone filters demonetize brand-safe content at scale (54% of suitable Reuters pages in IAS's test), defunding journalism and other negative-but-safe content while the actual floor (7.2% of Bad) goes under-addressed.
- Negative content is the least accessible on the web — at 31.5% WCAG pass (vs 44.6% for positive), the content people may most need in a crisis is the hardest to reach with assistive technology, an equity gap that tone-blind accessibility tooling will not catch.
- Neutral content is the AI-answer and trust leader — it tops EEAT (55.3%) and AEO (3.8%), so answer engines that retrieve on extractability and authority will naturally surface dispassionate, neutral sources — a structural advantage for reference content and a disadvantage for the positive commercial majority.
- The GARM vacuum has no fill — with the shared suitability standard dissolved since August 2024 and no replacement, tone-based proxies are doing more of the filtering, which deepens over-blocking precisely because tone is the wrong signal.
What Would Help
- Advertisers and verification vendors: separate tone from safety. The data is unambiguous — 72.1% of negative content is brand-safe. Replace keyword/sentiment blocklists with content-suitability classification that distinguishes a critical review (safe) from GARM-floor content (unsafe). The 7.2% floor share of Bad content is where tone and risk genuinely overlap; target that, not all negativity. Audit your own exposure with the GARM analyzer.
- AI answer engines: prefer Neutral, but weight provenance. Neutral content leads both authority (EEAT 55.3%) and answer-readiness (AEO 3.8%), so naive retrieval will already favor it — but verify provenance rather than register alone, so that dispassionate-sounding low-quality pages don't ride the neutral signal. See the AI Citation Readiness Gap.
- News and negative-but-safe publishers: contest over-blocking. If your content reads as negative but clears the GARM floor, you are in the 72% being demonetized by tone filters. Document brand-suitability with contextual classification and push exchanges toward suitability scoring over keyword exclusion — the over-blocking research is now on your side.
- International advertisers: set language-specific thresholds. A global negativity blocklist treats Czech (7.73% Bad) and English (0.36%) as the same risk — a 21-fold error. Calibrate sentiment and suitability thresholds per market, informed by the multilingual quality divide, rather than applying one global rule.
- Site owners and accessibility teams: close the negative-content access gap. Negative content passes WCAG at just 31.5%. If you publish news, reviews, complaints, or crisis information, the accessibility deficit is largest exactly where access matters most — semantic structure, alt text, and keyboard navigation are the cheapest fixes. Run a full check at llmse.ai/classify.
This analysis was conducted using LLMSE, which has classified over 3.4 million websites across SEO, EEAT, AEO, WCAG accessibility, readability, GARM brand safety, and privacy dimensions. Sentiment figures reflect the 3,145,849 URLs carrying a sentiment label as of June 2026; all cross-references are reproducible set intersections over those indices, and Russian-language content is excluded throughout. To analyze your own site across every dimension in this post, visit llmse.ai/classify.